
Investing in the stock market entails risk. Diversification is one way of spreading the risk with the belief that as one stock falls, another may not fall as severely or even rise. Diversifying by sectors and industries is a different way to spread the risk. Beta can be used as a barometer of risk. It measures a stock's volatility compared to the macro market. A beta of 1 implies that the stock moves with the market. Less than one means it's less volatile than the market. A higher than one means it's more volatile than the overall market. Technology stocks tend to carry more risk, whereas low-beta stocks carry less risk.
Risk Mitigation
To mitigate risk in a portfolio, it's prudent to consider adding low-beta stocks to offset the higher-beta stocks or riskier components. Investors tend to overlook liquidity as a risk factor. The reality is that even if a stock has a low beta, the thinner liquidity results in more slippage if the volume is also low. High liquidity should also be a factor when mitigating risk, so there is less slippage when making a trade. The following two stocks both carry low beta and high liquidity averaging over two million to 12 million shares a day in volume, one in consumer staples and the other in healthcare.
General Mills Inc. (NYSE: GIS)
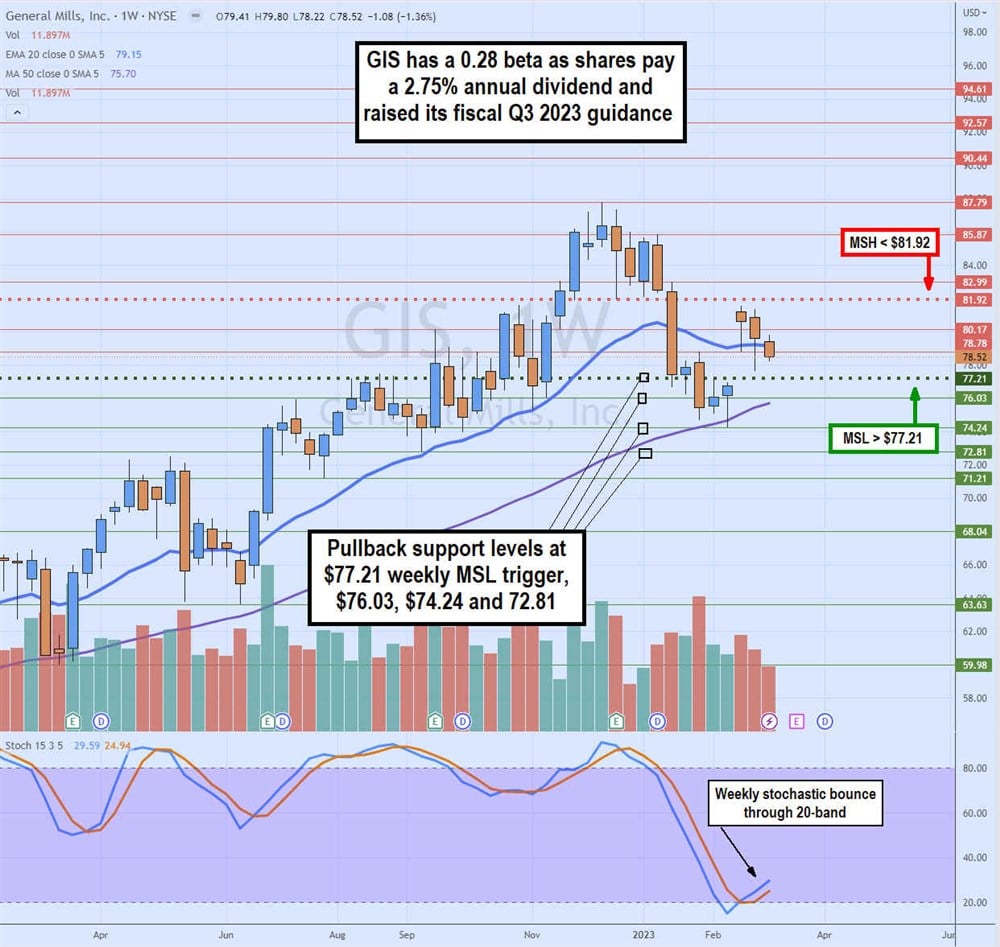
General Mills is a consumer staples and food manufacturer. It's known for its portfolio of popular cereal brands, including Cheerios, Wheaties, Raisin Nut Bran, Golden Grahams, Cocoa Puffs, and Lucky Charms. The company also produces meal kits, organic and natural products, snacks like Bugles, soups, ice creams like Haagen-Dazs, and pet food from Blue Buffalo. The stock has consistently performed up 28.72% in one-year performance. This stock has a 0.28 beta and pays a 2.75% dividend yield.
Fiscal Q2 2023 Earnings
General Mills beat its fiscal Q2 2023 EPS estimates at $1.10 versus $1.06, by $0.04. Revenues rose 3.9% YoY to $5.22 billion versus $5.19 billion. The company raised its earnings forecasts on Feb. 21, 2023, during the CAGNY conference. It sees adjusted EPS growth of 7% to 8% in constant currency, translating to $4.21 to $4.26 versus $4.14 consensus analyst estimates. Adjusted operating profit is expected to grow 6% to 7% in constant currency. Free cash flow conversion should be 90% of adjusted after-tax earnings.
Technical Analysis
The weekly candlestick chart peaked at $87.79 in December 2022. Shares have been falling since triggering the weekly MSH breakdown at $81.92. The weekly MSL trigger support is $77.21 as the weekly stochastic attempts to bounce through the 20-band. The weekly 20-period exponential moving average (EMA) is flat at $79.15, followed by the weekly 50-period MA at $75.70. Pullback support levels are $77.21 weekly MSL trigger, $76.03, $74.24, and $72.91.
The MarketBeat MarketRank™ Forecast gives it 2.5 out of 5 stars with a 4.63% upside price target of $82.16 per share.
Premiere Inc. (NASDAQ: PINC)
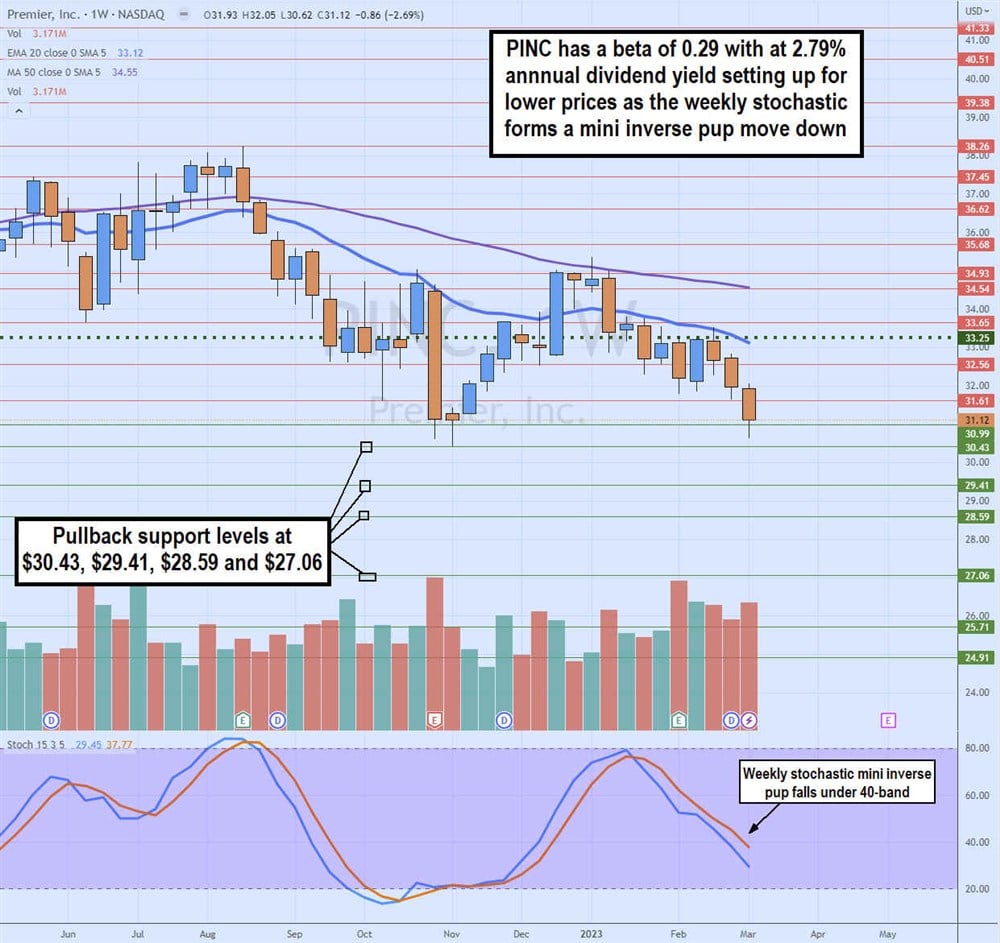
This stock has a 0.29 beta and pays a 2.79% dividend yield. Premiere provides products and services to improve healthcare. Its services include group purchasing, consulting, data analytics, and advocacy. Its services help to improve cost savings, efficiency, and outcomes in the healthcare space. It's a group purchasing organization (GPO) that uses economies of scale with over 3,000 negotiated contracts with leading manufacturers to get better pricing for healthcare supplies. The company has saved over $100 million in customer supply chain expenses with its $82 billion in purchasing volume. Healthcare has several major tailwinds led by the aging population with chronic diseases that will entail more spending and advancements in medical technology.
Fiscal Q2 2023 Earnings
Premiere beat is fiscal Q2 2023 EPS estimates at $0.72 versus $0.66 consensus analyst estimates by $0.06. Revenues fell (5.2%) YoY to $359.6 million beating $359.6 consensus analyst estimates. The company guided full-year 2023 EPS of $2.53 to $2.63 versus $2.63 analyst estimates. It expects full-year 2023 revenues between $1.38 billion to $1.45 billion versus $1.41 billion consensus analyst estimates. PINC shares trade at 12X forward earnings and have a 2% short interest.
Technical Analysis
The weekly candlestick chart shows an inverse pup breakdown comprising the falling 20-period exponential moving average (EMA) resistance at $33.12, followed by the falling 50-period MA at $34.55. The weekly stochastic has a mini inverse pup falling under the 40-band. The weekly MSL triggers above $33.25. Pullback support levels are $30.43, $29.31, $28.59, and $27.06.
The MarketBeat MarketRank™ Forecast gives it 2.5 out of 5 stars with a 15.6% upside price target of $41.50 per share.


