Racing, gaming, and entertainment company Churchill Downs (NASDAQ: CHDN) met Wall Street’s revenue expectations in Q1 CY2026, with sales up 3.2% year on year to $663 million. Its non-GAAP profit of $1.21 per share was 20.4% above analysts’ consensus estimates.
Is now the time to buy Churchill Downs? Find out by accessing our full research report, it’s free.
Churchill Downs (CHDN) Q1 CY2026 Highlights:
- Revenue: $663 million vs analyst estimates of $662.6 million (3.2% year-on-year growth, in line)
- Adjusted EPS: $1.21 vs analyst estimates of $1.00 (20.4% beat)
- Adjusted EBITDA: $257 million vs analyst estimates of $248.7 million (38.8% margin, 3.3% beat)
- Operating Margin: 21.6%, in line with the same quarter last year
- Free Cash Flow Margin: 38.5%, up from 25.9% in the same quarter last year
- Market Capitalization: $6.33 billion
Company Overview
Famous for hosting the Kentucky Derby, Churchill Downs (NASDAQ: CHDN) operates a horse racing, online wagering, and gaming entertainment business in the United States.
Revenue Growth
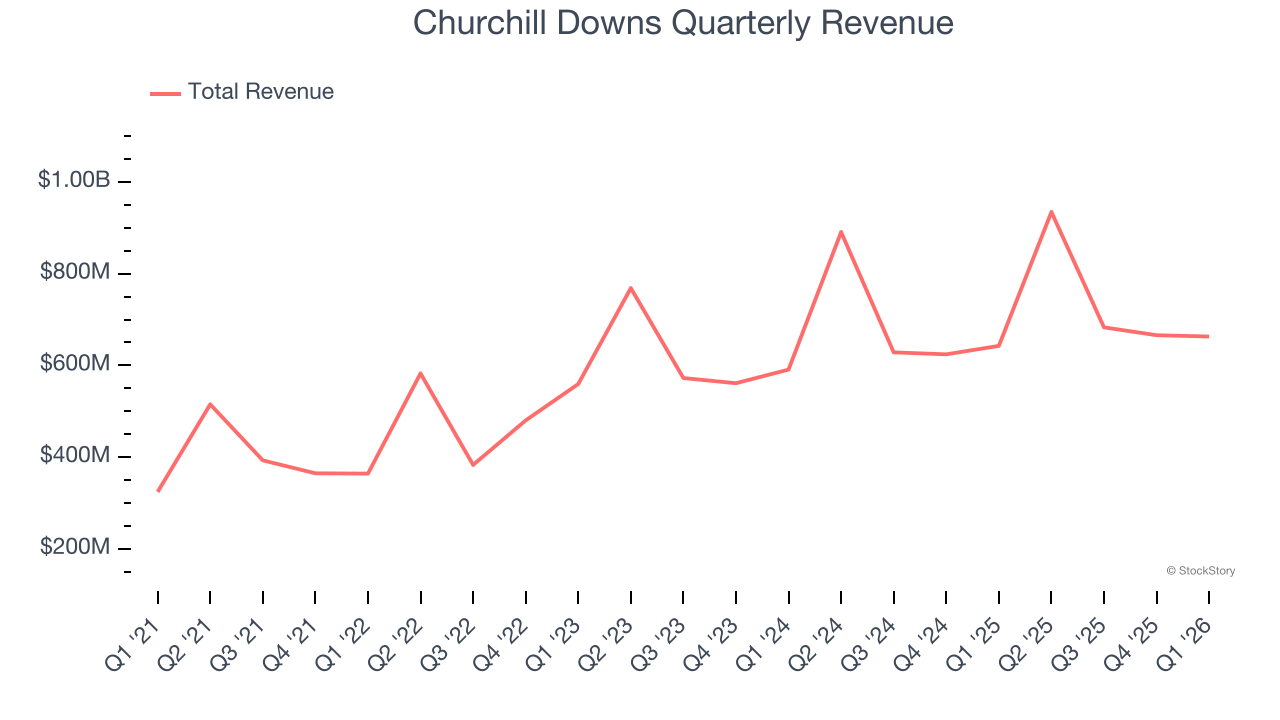
Reviewing a company’s long-term sales performance reveals insights into its quality. Any business can have short-term success, but a top-tier one grows for years. Over the last five years, Churchill Downs grew its sales at a 21.2% compounded annual growth rate. Though this growth is acceptable on an absolute basis, we need to see more than just topline growth for the consumer discretionary sector, which can display significant earnings volatility. This means our bar for the sector is particularly high, reflecting the non-essential and hit-driven nature of the products and services offered. Additionally, five-year CAGR starts around Covid, when revenue was depressed then rebounded.
Long-term growth is the most important, but within consumer discretionary, product cycles are short and revenue can be hit-driven due to rapidly changing trends and consumer preferences. Churchill Downs’s recent performance shows its demand has slowed as its annualized revenue growth of 8.7% over the last two years was below its five-year trend. We’re wary when companies in the sector see decelerations in revenue growth, as it could signal changing consumer tastes aided by low switching costs. 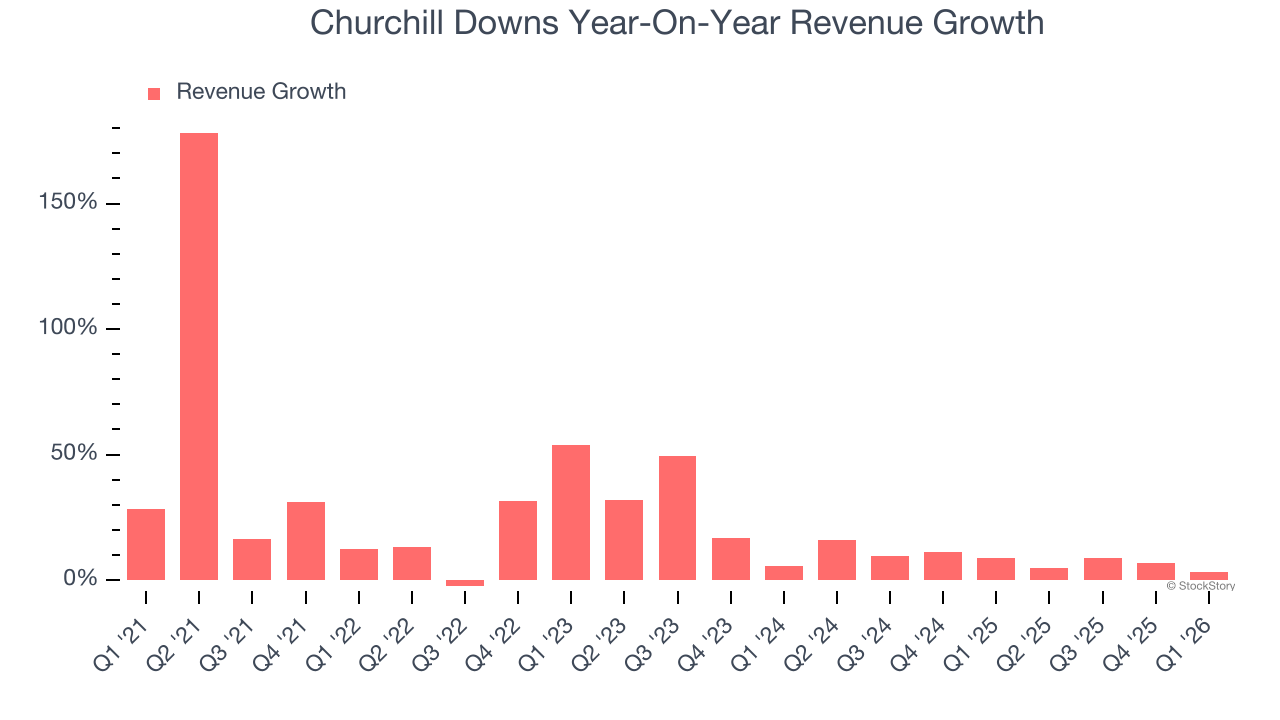
Churchill Downs also breaks out the revenue for its most important segments, Horse Racing and Gaming, which are 45.4% and 38.8% of revenue. Over the last two years, Churchill Downs’s Horse Racing revenue (live and historical) averaged 12.2% year-on-year growth while its Gaming revenue (casino games) averaged 2.8% growth. 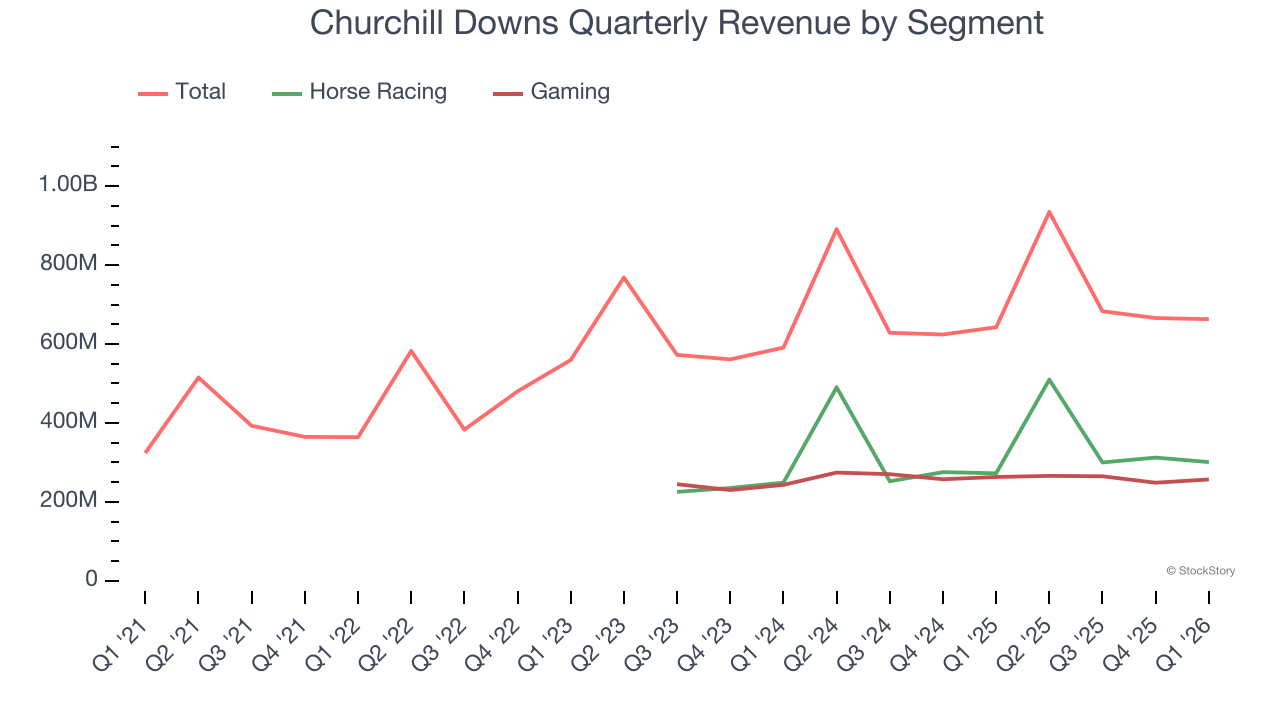
This quarter, Churchill Downs grew its revenue by 3.2% year on year, and its $663 million of revenue was in line with Wall Street’s estimates.
Looking ahead, sell-side analysts expect revenue to grow 3.8% over the next 12 months, a deceleration versus the last two years. This projection doesn't excite us and implies its products and services will face some demand challenges.
WHILE YOU’RE HERE: The Next Palantir? One satellite company captures images of every point on Earth. Every single day. The Pentagon wants it. Hedge funds are using it to beat earnings. You’ve probably never heard of it.
This is what the early days of Palantir looked like before it became a $437 billion giant. Same playbook. Different technology. If you missed Palantir, you need to see this. Claim The Stock Ticker for Free HERE.
Operating Margin
Operating margin is a key measure of profitability. Think of it as net income - the bottom line - excluding the impact of taxes and interest on debt, which are less connected to business fundamentals.
Churchill Downs’s operating margin has shrunk over the last 12 months and averaged 24.6% over the last two years. The company’s profitability was mediocre for a consumer discretionary business and shows it couldn’t pass its higher operating expenses onto its customers.
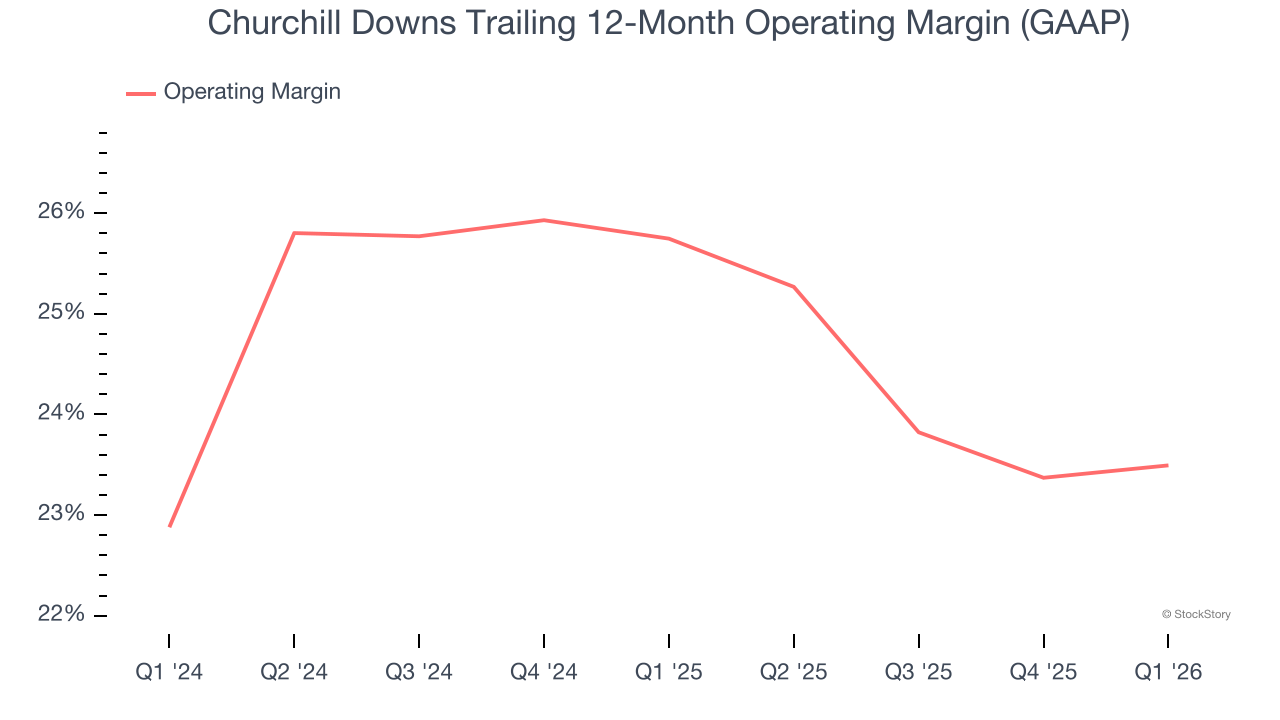
This quarter, Churchill Downs generated an operating margin profit margin of 21.6%, in line with the same quarter last year. This indicates the company’s overall cost structure has been relatively stable.
Earnings Per Share
Revenue trends explain a company’s historical growth, but the long-term change in earnings per share (EPS) points to the profitability of that growth – for example, a company could inflate its sales through excessive spending on advertising and promotions.
Churchill Downs’s EPS grew at 49.3% compounded annual growth rate over the last five years, higher than its 21.2% annualized revenue growth. This tells us the company became more profitable on a per-share basis as it expanded.
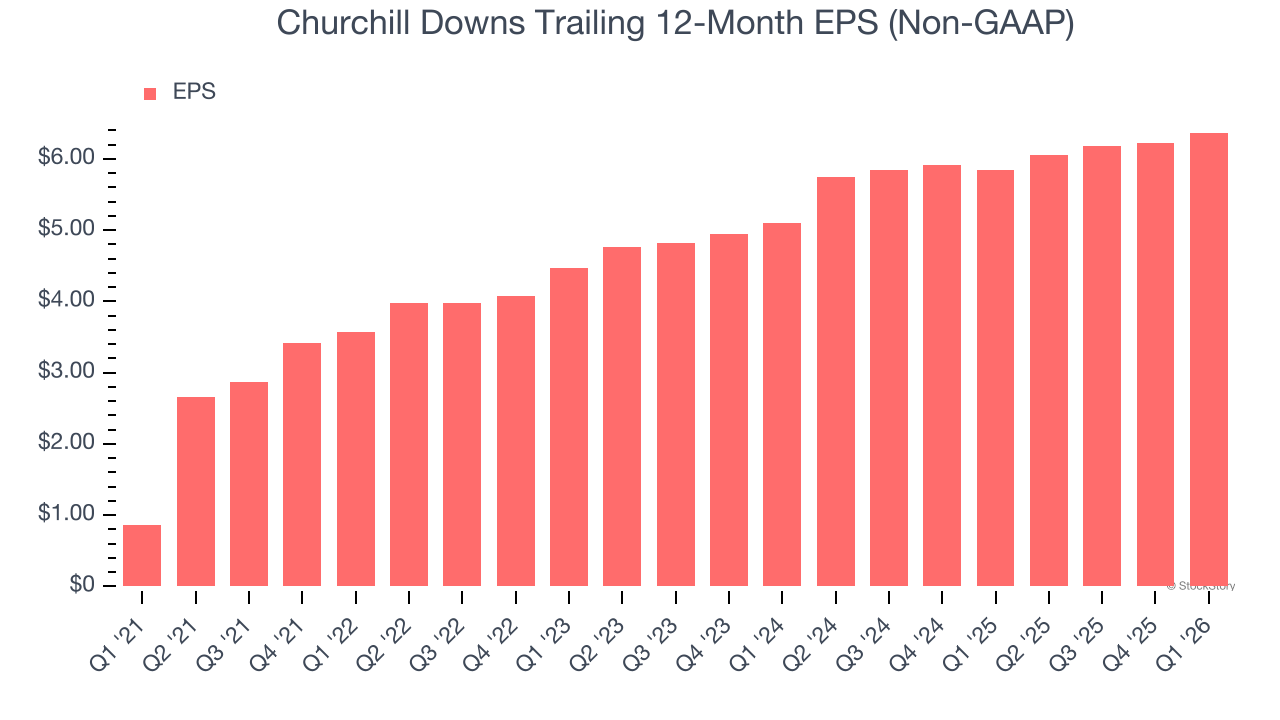
In Q1, Churchill Downs reported adjusted EPS of $1.21, up from $1.07 in the same quarter last year. This print easily cleared analysts’ estimates, and shareholders should be content with the results. Over the next 12 months, Wall Street expects Churchill Downs’s full-year EPS of $6.37 to grow 3.7%.
Key Takeaways from Churchill Downs’s Q1 Results
It was good to see Churchill Downs beat analysts’ EPS expectations this quarter despite in line revenue. Overall, this print wasn't perfect, but it was fine. The stock remained flat at $88.97 immediately after reporting.
So do we think Churchill Downs is an attractive buy at the current price? When making that decision, it’s important to consider its valuation, business qualities, as well as what has happened in the latest quarter. We cover that in our actionable full research report which you can read here (it’s free).