Fashion conglomerate G-III (NASDAQ: GIII) fell short of the market’s revenue expectations in Q2 CY2026, with sales falling 9.6% year on year to $554.1 million. Next quarter’s revenue guidance of $870 million underwhelmed, coming in 3.2% below analysts’ estimates. Its non-GAAP profit of $0.26 per share was 11.4% above analysts’ consensus estimates.
Is now the time to buy G-III? Find out by accessing our full research report, it’s free.
G-III (GIII) Q2 CY2026 Highlights:
- Revenue: $554.1 million vs analyst estimates of $570.4 million (9.6% year-on-year decline, 2.9% miss)
- Adjusted EPS: $0.26 vs analyst estimates of $0.23 (11.4% beat)
- Adjusted EBITDA: $20.23 million vs analyst estimates of $23.1 million (3.7% margin, 12.4% miss)
- The company reconfirmed its revenue guidance for the full year of $2.71 billion at the midpoint
- Management raised its full-year Adjusted EPS guidance to $2.25 at the midpoint, a 2.3% increase
- EBITDA guidance for the full year is $176 million at the midpoint, above analyst estimates of $170 million
- Operating Margin: 2%, in line with the same quarter last year
- Market Capitalization: $1.36 billion
Morris Goldfarb, G-III’s Chairman and Chief Executive Officer, said, “Our second quarter results reflect strong execution across the organization, with earnings exceeding our guidance, driven by substantial gross margin expansion. Our go-forward portfolio grew at a high-single digit rate during the quarter, reinforcing our confidence in the power of our brands and business model.”
Company Overview
Founded as a small leather goods business, G-III (NASDAQ: GIII) is a fashion and apparel conglomerate with a diverse portfolio of brands.
Revenue Growth
A company’s long-term sales performance is one signal of its overall quality. Any business can experience short-term success, but top-performing ones enjoy sustained growth for years. Unfortunately, G-III’s 3.9% annualized revenue growth over the last five years was weak. This fell short of our benchmark for the consumer discretionary sector and is a rough starting point for our analysis.
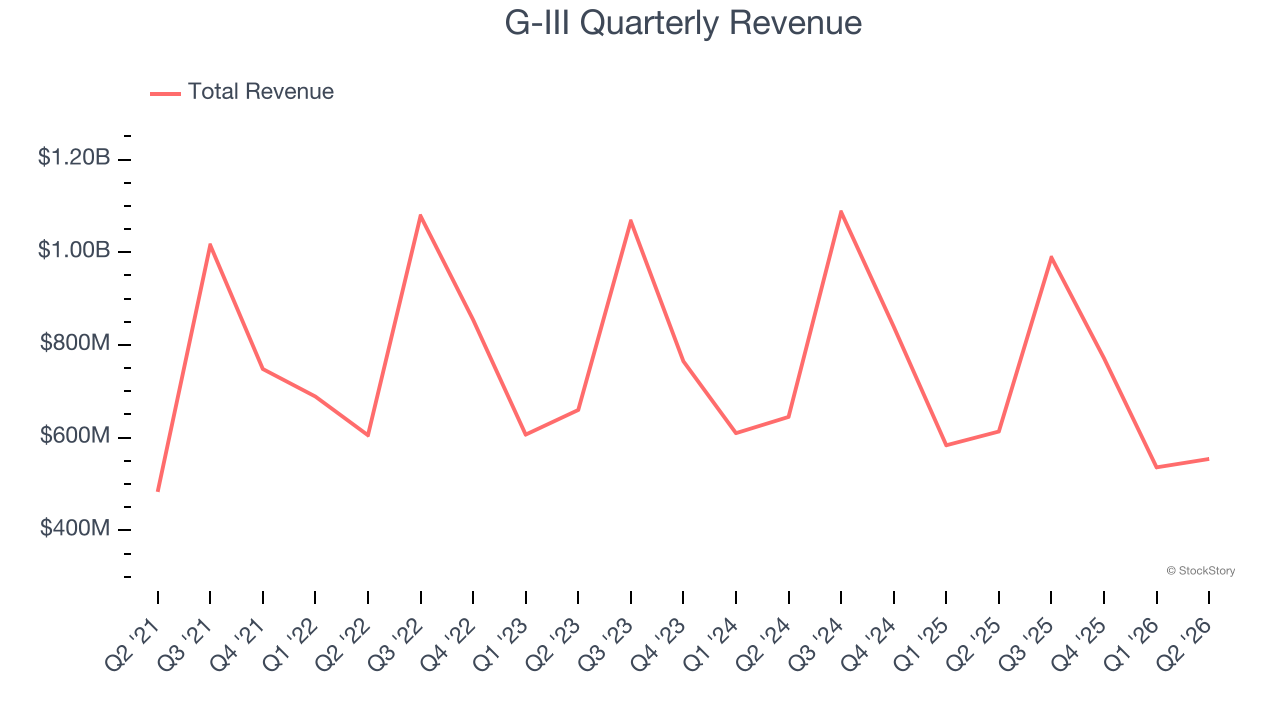
We at StockStory place the most emphasis on long-term growth, but within consumer discretionary, a stretched historical view may miss a company riding a successful new product or trend. G-III’s performance shows it grew in the past but relinquished its gains over the last two years, as its revenue fell by 3.9% annually. 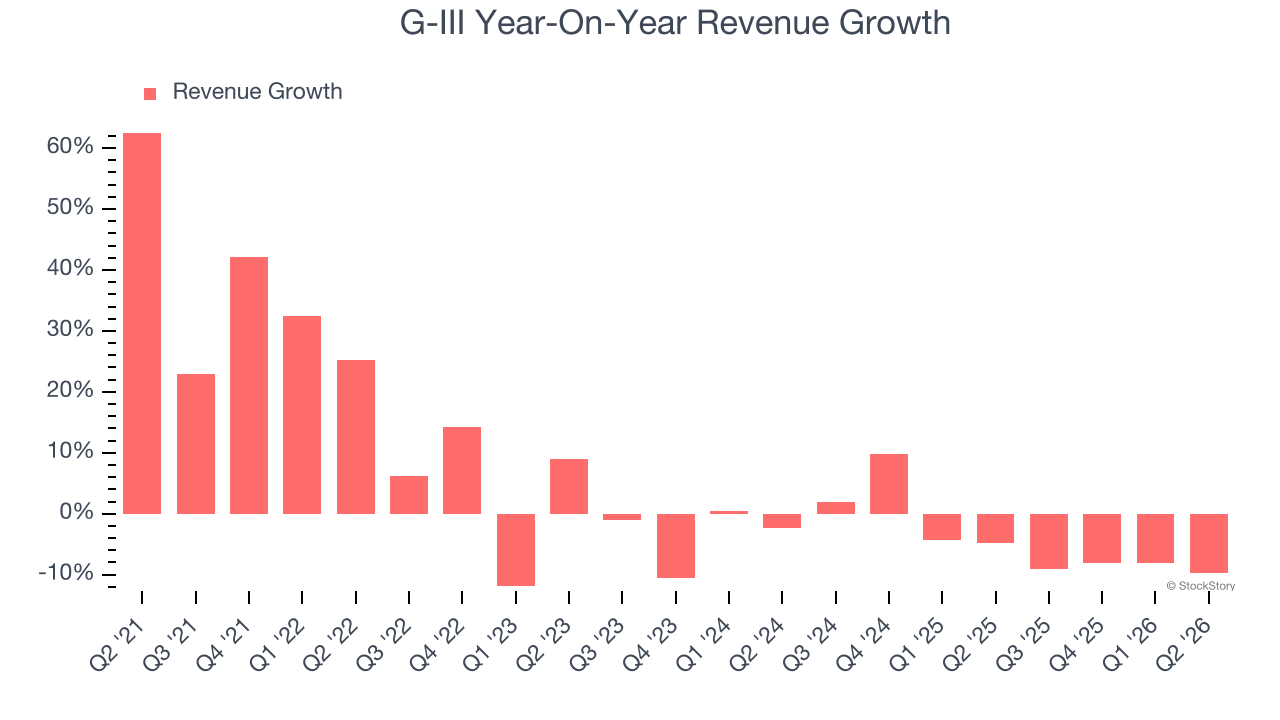
This quarter, G-III missed Wall Street’s estimates and reported a rather uninspiring 9.6% year-on-year revenue decline, generating $554.1 million of revenue. Company management is currently guiding for a 12% year-on-year decline in sales next quarter.
Looking further ahead, sell-side analysts expect revenue to decline by 5.2% over the next 12 months, similar to its two-year rate. This projection is underwhelming and implies its products and services will face some demand challenges.
ALSO WORTH WATCHING: Nvidia’s Quiet Partner. Nvidia’s chips cost a hundred grand. The connectors that make them work cost even more. One company makes them all.
Every AI server needs specialized infrastructure the chip companies don’t make. High-speed cables. Power connectors. Thermal sensors. This 90-year-old company built a monopoly on it. The AI boom just started. This stock is still flying under the radar. Claim The Stock Ticker Here for FREE.
Operating Margin
Operating margin is a key measure of profitability. Think of it as net income - the bottom line - excluding the impact of taxes and interest on debt, which are less connected to business fundamentals.
G-III’s operating margin has been trending down over the last 12 months and averaged 7.4% over the last two years. The company’s profitability was mediocre for a consumer discretionary business and shows it couldn’t pass its higher operating expenses onto its customers.
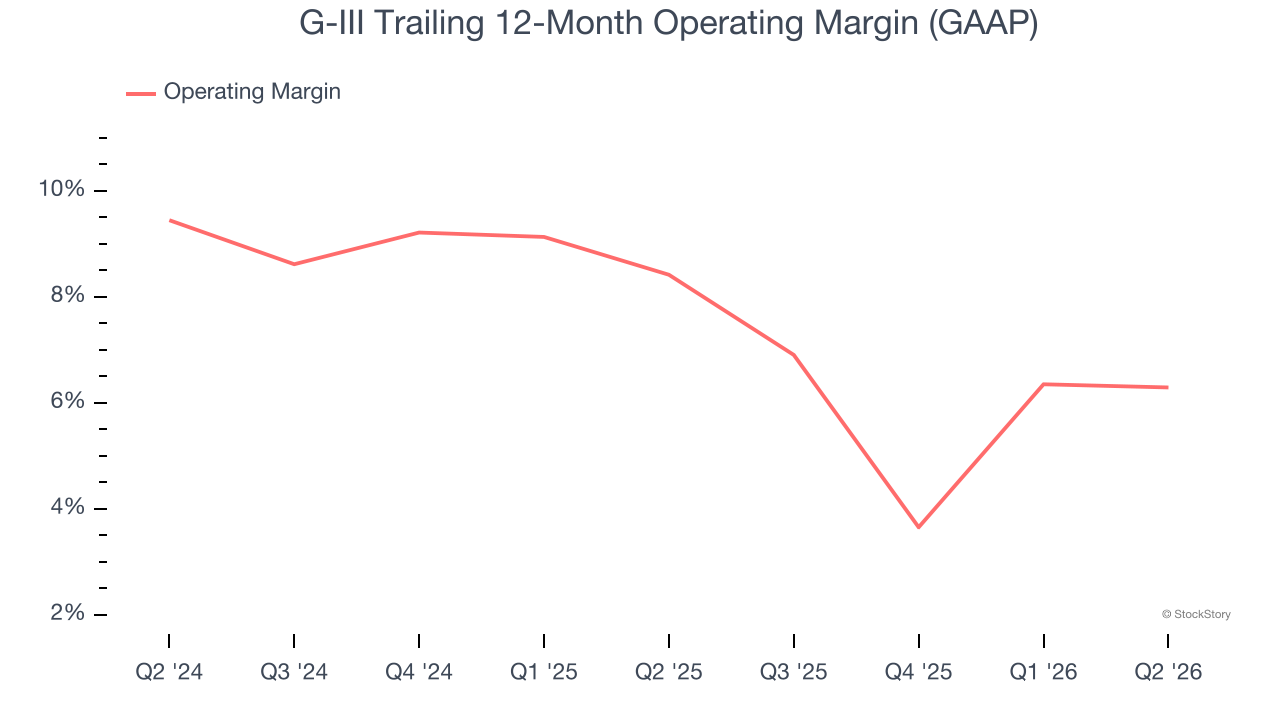
In Q2, G-III generated an operating margin profit margin of 2%, in line with the same quarter last year. This indicates the company’s overall cost structure has been relatively stable.
Earnings Per Share
We track the long-term change in earnings per share (EPS) for the same reason as long-term revenue growth. Compared to revenue, however, EPS highlights whether a company’s growth is profitable.
Sadly for G-III, its EPS declined by 4.2% annually over the last five years while its revenue grew by 3.9%. This tells us the company became less profitable on a per-share basis as it expanded due to non-fundamental factors such as interest expenses and taxes.
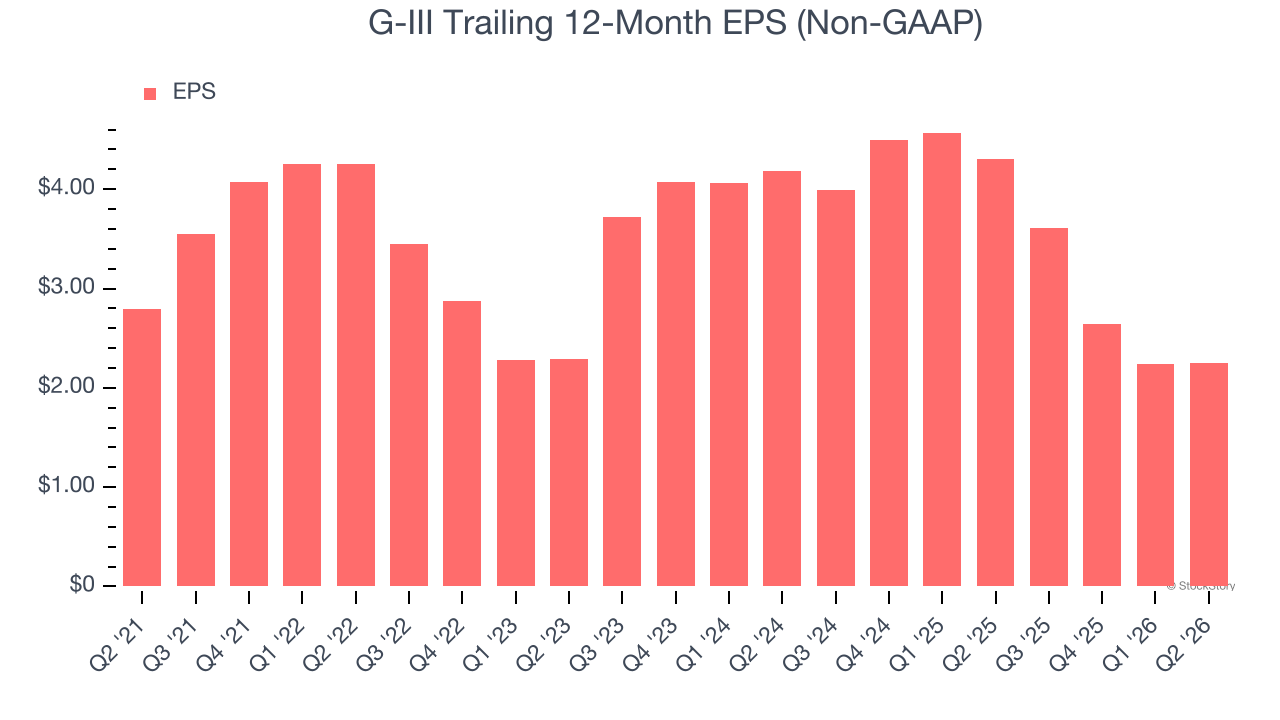
In Q2, G-III reported adjusted EPS of $0.26, up from $0.25 in the same quarter last year. This print easily cleared analysts’ estimates, and shareholders should be content with the results. Over the next 12 months, Wall Street expects G-III’s full-year EPS to grow 7% from $2.25 to $2.41.
Key Takeaways from G-III’s Q2 Results
It was good to see G-III beat analysts’ EPS expectations this quarter. We were also glad its full-year EBITDA guidance exceeded Wall Street’s estimates. On the other hand, its EPS guidance for next quarter missed and its revenue fell short of Wall Street’s estimates. Overall, this was a weaker quarter. The stock traded down 9.2% to $29.20 immediately after reporting.
G-III’s earnings report left more to be desired. Let’s look forward to see if this quarter has created an opportunity to buy the stock. When making that decision, it’s important to consider its valuation, business qualities, as well as what has happened in the latest quarter. We cover that in our actionable full research report which you can read here (it’s free).