
The second quarter 2023 earnings season has seen a wide variance between the "haves" and the "have nots" of performance. While many companies have had impressive earnings beats, some crushed earnings estimates by nearly triple or more. These stocks saw their share prices gap up high as frenzied buyers chased them higher.
Plenty of short-sellers were also rushing to cover as a relatively high short interest was a common factor. Here are two stocks that doubled and tripled their earnings-per-share (EPS) estimates and gapped up huge.
Wayfair Inc. (NYSE: W)
Wayfair is an e-commerce retailer that sells direct-to-consumer furnishings and home goods. It's called the Amazon.com Inc. (NASDAQ: AMZN) of home goods. Wayfair acts as the middleman operating the platform connecting sellers with buyers. Wayfair works with over 11 million suppliers to offer over 18 million products.
It's the country's largest marketplace for home furnishings, with over 65 million active customers. Sellers must have drop shipping and product insurance. Customers buy on the site, and Wayfair sends orders to the seller, who then packages, drops, and ships them.
The Wayfair delivery network (WDN) is a self-logistic system. Its drop shipping model involves sending products from the supplier to the customer. Wayfair holds no inventory and no warehouse space, completely asset-light.
Rather than charging a commission or fees, Wayfair marks up the products and keeps the difference while paying the seller a wholesale price. Wayfair covers the shipping cost and pays the product's wholesale cost as there are no commissions or fees to sell, unlike Amazon.com, eBay Inc. (NASDAQ: EBAY) or Etsy Inc. (NASDAQ: ETSY).
Blowout Earnings
Wayfair reported Q2 2023 earnings-per-share (EPS) of 21 cents crushing consensus analyst estimates for a loss of 72 cents, a 95-cent beat. Revenues fell 3.4% year-over-year (YoY) to $3.17 billion but still beat analyst estimates for $3.1 billion. The company implemented many efficiency initiatives, including layoffs, lowering incidence rates and enhanced shipping to deliver $1.4 billion in annualized cost savings.
This was a return to profitability since it fell into the red after Q3 2021. Sales rose 14.3% sequentially. Most impressive is that Wayfair's top line completely outperformed the rest of the competition as the industry suffered a 10% to 20% decline in topline sales.
It saw that 61.6% of orders were placed on mobile devices. Gross margins rose to 31.1%, the highest ever in its history. While 2023 started slow, the outdoor shopping season picked up quickly.
Prompting Analyst Upgrades
Wayfair's blowout prompted analyst upgrades. Gordon Haskett raised its rating to a Buy from Hold and its price target to $110 per share from $65. Wells Fargo upgraded shares to Overweight from Underweight but lowered its price target from $125 to $100.
A Well Fargo analyst commented, "Topline trends just inflected, profit progress has legs& W is pivoting to a leaner, more productive business. It’s time to re-recognize W as a high growth, share-taking asset with real profit levers & upside catalysts ahead.”
Wayfair analyst ratings and price targets are at MarketBeat.
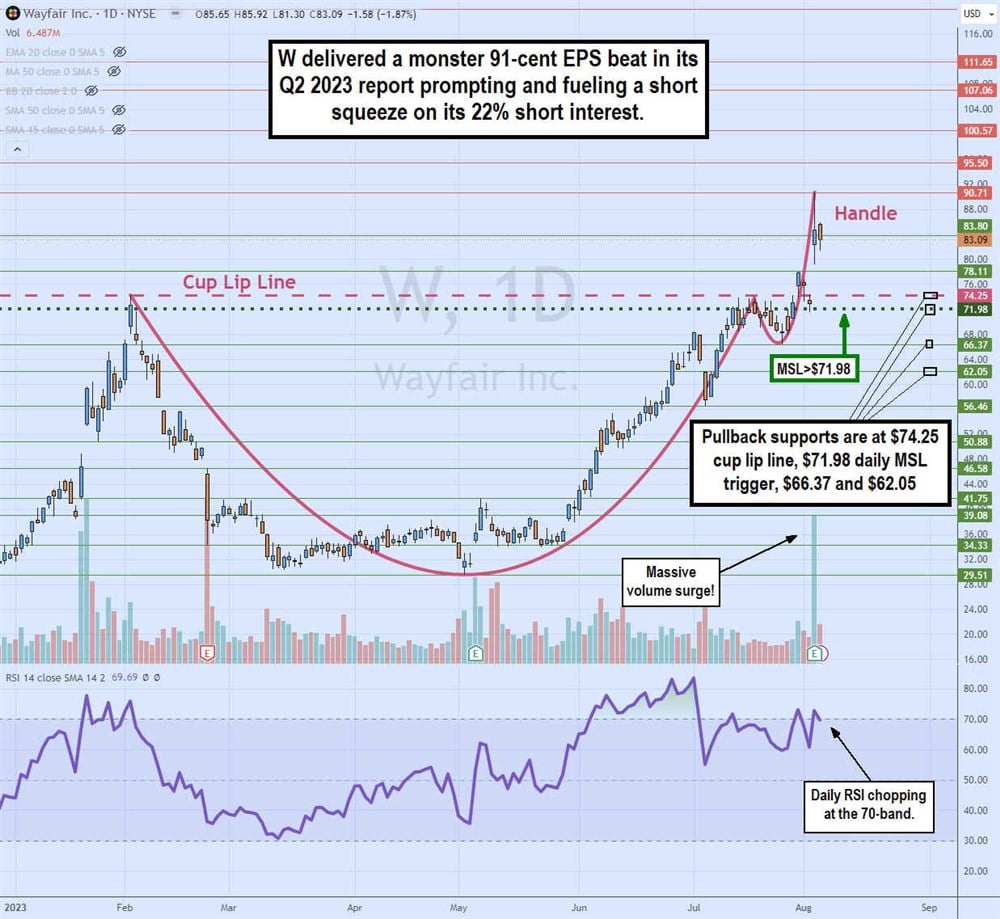
Daily Cup and Handle Breakout
The daily chart on W shows the cup and handle breakout as shares triggered a daily market structure low (MSL) through the $71.98 trigger and the $74.25 cup lip line. Its blowout Q2 2023 earnings gapped it as high as $90.71 from its prior close of $72.89 on Aug. 2, 2023. The daily relative strength index (RSI) has been chopping around the overbought 70-band.
Pullback supports are at $74.25 lip line, $71.98 daily MSL trigger, $66.37 handle low and $62.05.
Wix.com Ltd. (NASDAQ: WIX)
Sticking with the e-commerce theme, Wix.com is a website builder platform under a freemium model where users can create and manage their websites without any coding experience. It uses a drag-and-drop model with included templates, widgets and simple e-commerce capabilities.
The basic service is free but limited. Users can add-on options, services and subscriptions to optimize their websites for a fee. The freemium model lets users try the service with limited options and entices them to upgrade to engage in more features.
The company has over 180 million users throughout 190 countries, ranging from small businesses to Fortune 500 enterprises. The company has integrated generative artificial intelligence (AI) capabilities to help users optimize their content.
Doubling EPS Expectations
On Aug. 3, 2023, Wix.com reported its Q2 2023 EPS of $1.26, beating the 59 cents consensus analyst estimates by 67 cents. GAAP net income was $33.6 million, with net cash from operations being $47.8 million with capex at $15.8 million for a free cash float of $32 million.
Revenues climbed 13% YoY to $390 million, beating analyst estimates of $382.61 million, driven by Creative Subscriptions and Business Solutions growth. Partners revenues grew 36% YoY to $115.2 million. The company completed a $300 million stock buyback program repurchasing 3.6 million shares at an average cost of $82.48.
Wix.com CEO and Co-Founder Avishai Abrahami commented on its AI integration, "Our innovation did not stop there this quarter, as we continued to be at the forefront of AI technology with the introduction of exciting AI and gen-AI-driven products coming soon to all Wix users, including AI Site Generator and AI Assistant for Business, among others.”
Revenue Guidance Lifted
Wix.com raised its Q3 2023 revenue guidance of $386 million to $391 million versus $384.55 million consensus analyst estimates, up 12% to 13% YoY. It raised its full-year 2023 revenue guidance of $1.543 billion to $1.558 billion versus $1.53 billion analyst estimates. Non-GAAP gross margins are expected to be around 68% for the full-year 2023, up from 67%. This is credited to the growing profitability of its Creative subscriptions and business solutions.
Wix.com analyst ratings and price targets are at MarketBeat.
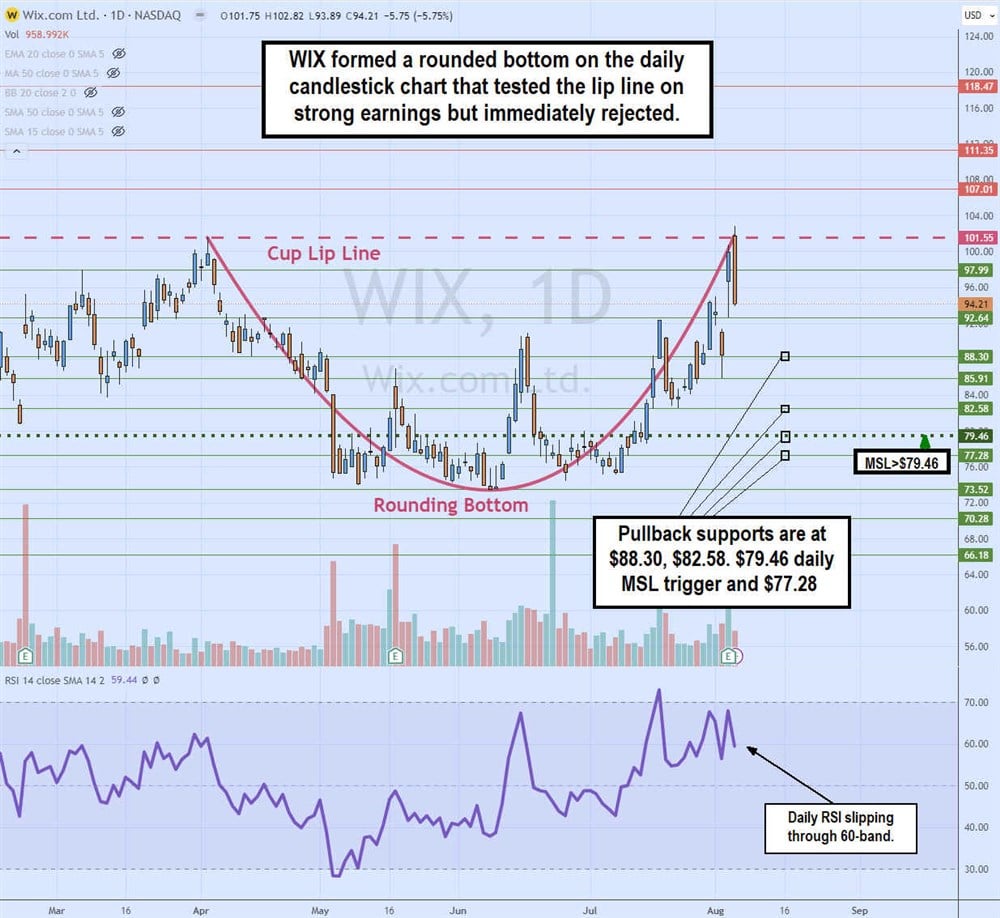
Daily Rounding Bottom
The daily chart on WIX illustrates the rounding bottom that helped complete the cup pattern. Shares gapped up to test the cup lip line at $101.55 on the earnings blowout, but the immediate gap crapped back down to a low of $93.89. This caused the daily relative strength index (RSI) oscillator to turn back down through the 60-band.
If the pullback can find a bottom and coil above the $88.30 level, it can form a handle that can trigger the cup and handle breakout if it can break the cup lip line resistance at $101.55. Pullback support levels are $88.30, $82.58, and $79.46 daily market structure low (MSL) trigger and $77.28.


