Filtration equipment manufacturer Donaldson (NYSE: DCI) beat Wall Street’s revenue expectations in Q1 CY2026, with sales up 5.9% year on year to $995.1 million. Its non-GAAP profit of $1.06 per share was 1.2% above analysts’ consensus estimates.
Is now the time to buy Donaldson? Find out by accessing our full research report, it’s free.
Donaldson (DCI) Q1 CY2026 Highlights:
- Revenue: $995.1 million vs analyst estimates of $979.3 million (5.9% year-on-year growth, 1.6% beat)
- Adjusted EPS: $1.06 vs analyst estimates of $1.05 (1.2% beat)
- Adjusted EBITDA: $195.2 million vs analyst estimates of $191.2 million (19.6% margin, 2.1% beat)
- Management slightly raised its full-year Adjusted EPS guidance to $3.97 at the midpoint
- Operating Margin: 15.6%, up from 9.3% in the same quarter last year
- Free Cash Flow Margin: 11.2%, up from 7.8% in the same quarter last year
- Constant Currency Revenue rose 3.1% year on year (1.6% in the same quarter last year)
- Organic Revenue rose 5.8% year on year (beat)
- Market Capitalization: $9.47 billion
Company Overview
Playing a vital role in the historic Apollo 11 mission, Donaldson (NYSE: DCI) manufacturers and sells filtration equipment for various industries.
Revenue Growth
A company’s long-term sales performance can indicate its overall quality. Any business can experience short-term success, but top-performing ones enjoy sustained growth for years. Unfortunately, Donaldson’s 7.1% annualized revenue growth over the last five years was mediocre. This was below our standard for the industrials sector and is a poor baseline for our analysis.
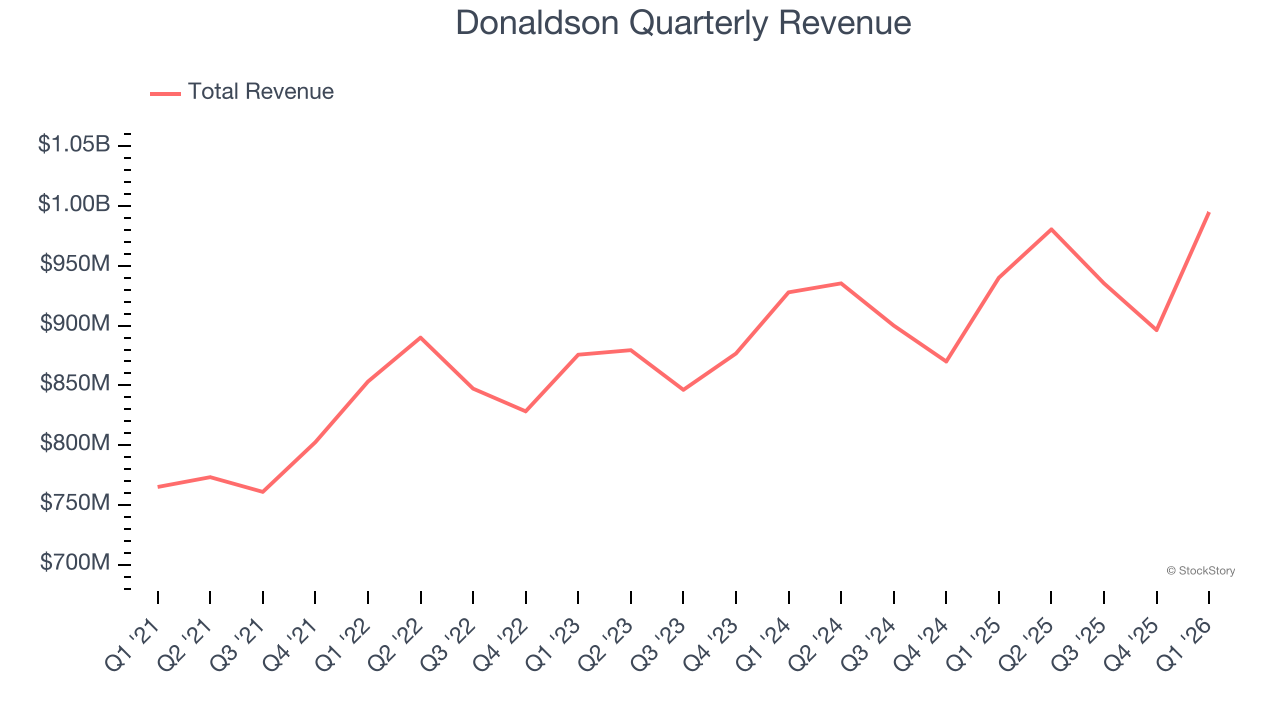
Long-term growth is the most important, but within industrials, a half-decade historical view may miss new industry trends or demand cycles. Donaldson’s recent performance shows its demand has slowed as its annualized revenue growth of 3.8% over the last two years was below its five-year trend. We’re wary when companies in the sector see decelerations in revenue growth, as it could signal changing consumer tastes aided by low switching costs. 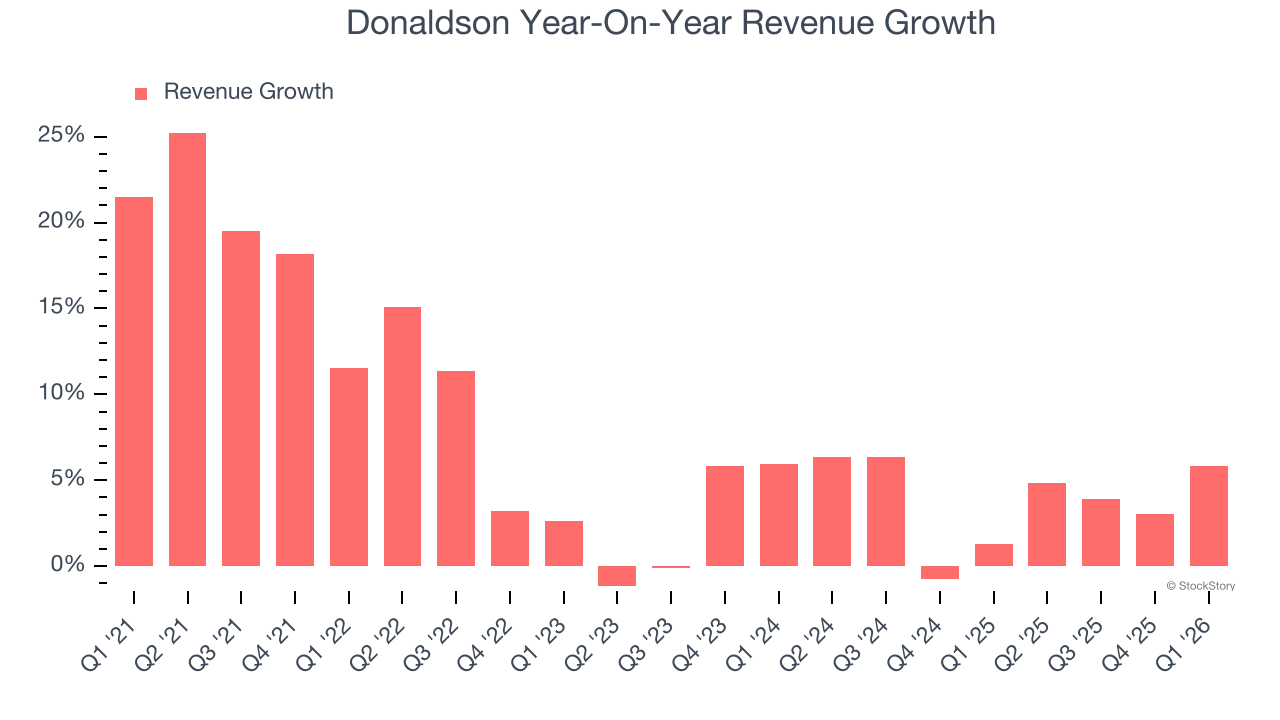
We can dig further into the company’s sales dynamics by analyzing its constant currency revenue, which excludes currency movements that are outside their control and not indicative of demand. Over the last two years, its constant currency sales averaged 3% year-on-year growth. Because this number aligns with its reported revenue growth, we can see that foreign exchange has not had a meaningful impact on topline. 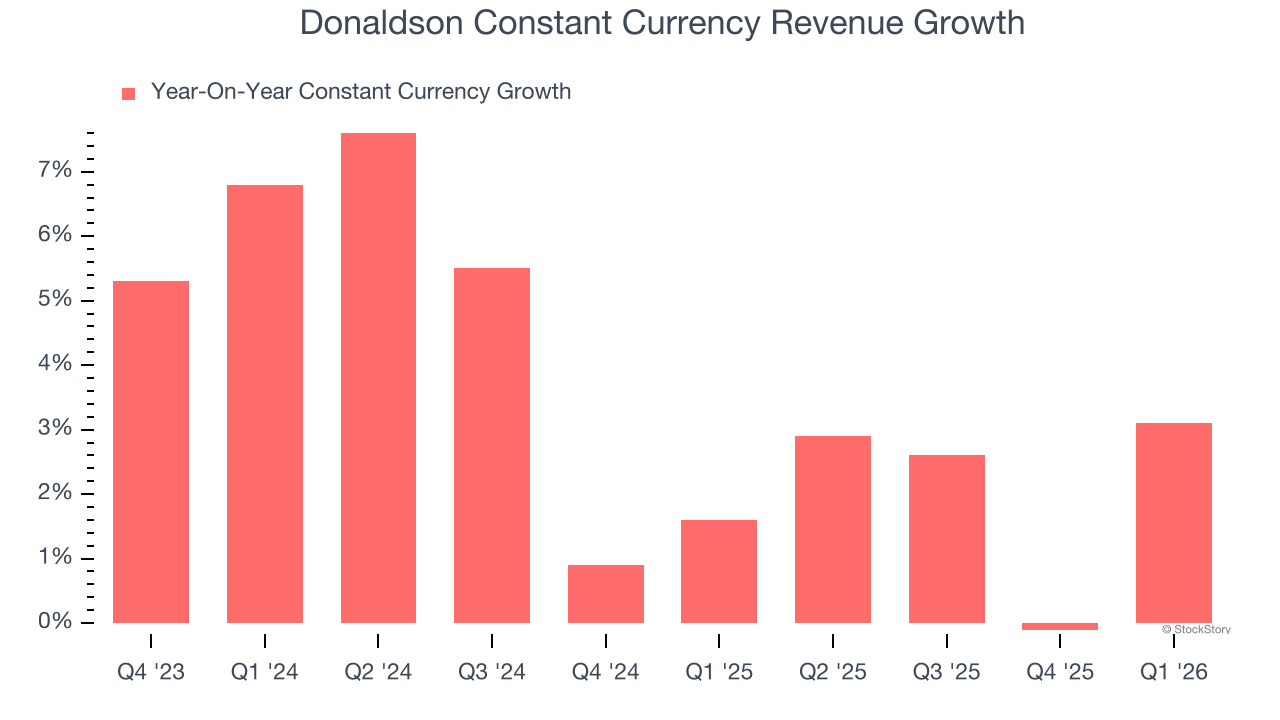
This quarter, Donaldson reported year-on-year revenue growth of 5.9%, and its $995.1 million of revenue exceeded Wall Street’s estimates by 1.6%.
Looking ahead, sell-side analysts expect revenue to grow 3.9% over the next 12 months, similar to its two-year rate. This projection is underwhelming and implies its newer products and services will not catalyze better top-line performance yet.
WHILE YOU’RE HERE: The Next Palantir? One satellite company captures images of every point on Earth. Every single day. The Pentagon wants it. Hedge funds are using it to beat earnings. You’ve probably never heard of it.
This is what the early days of Palantir looked like before it became a $437 billion giant. Same playbook. Different technology. If you missed Palantir, you need to see this. Claim The Stock Ticker for Free HERE.
Operating Margin
Operating margin is one of the best measures of profitability because it tells us how much money a company takes home after procuring and manufacturing its products, marketing and selling those products, and most importantly, keeping them relevant through research and development.
Donaldson has been an efficient company over the last five years. It was one of the more profitable businesses in the industrials sector, boasting an average operating margin of 14.2%. This result isn’t too surprising as its gross margin gives it a favorable starting point.
Analyzing the trend in its profitability, Donaldson’s operating margin rose by 1.7 percentage points over the last five years, as its sales growth gave it operating leverage.
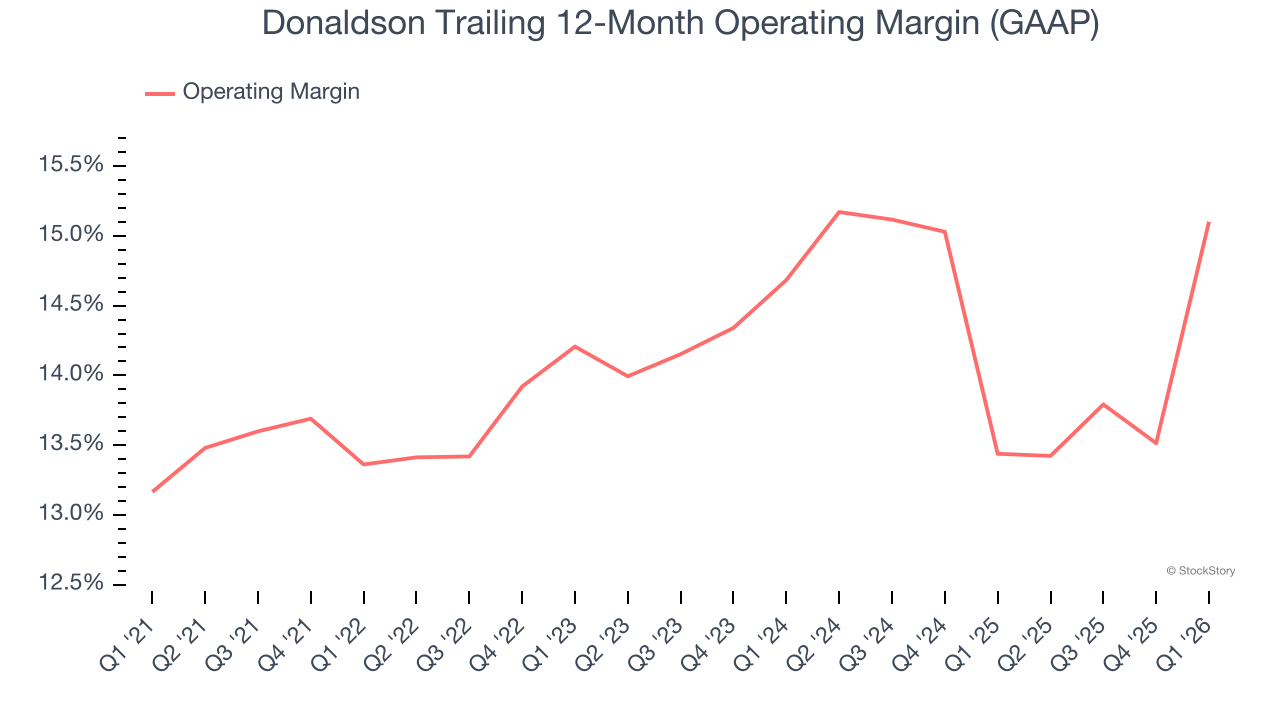
In Q1, Donaldson generated an operating margin profit margin of 15.6%, up 6.3 percentage points year on year. The increase was solid, and because its gross margin actually decreased, we can assume it was more efficient because its operating expenses like marketing, R&D, and administrative overhead grew slower than its revenue.
Earnings Per Share
Revenue trends explain a company’s historical growth, but the long-term change in earnings per share (EPS) points to the profitability of that growth — for example, a company could inflate its sales through excessive spending on advertising and promotions.
Donaldson’s EPS grew at 12.3% compounded annual growth rate over the last five years, higher than its 7.1% annualized revenue growth. This tells us the company became more profitable on a per-share basis as it expanded.
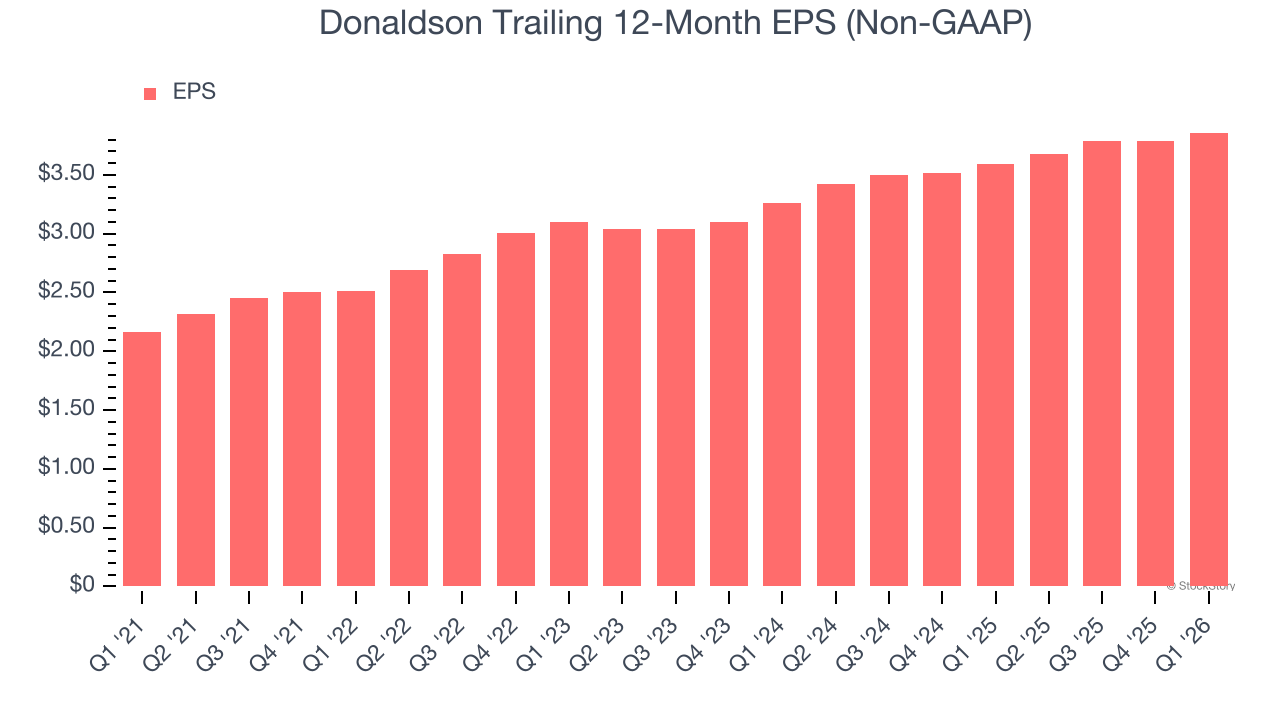
Diving into Donaldson’s quality of earnings can give us a better understanding of its performance. As we mentioned earlier, Donaldson’s operating margin expanded by 1.7 percentage points over the last five years. On top of that, its share count shrank by 8%. These are positive signs for shareholders because improving profitability and share buybacks turbocharge EPS growth relative to revenue growth. 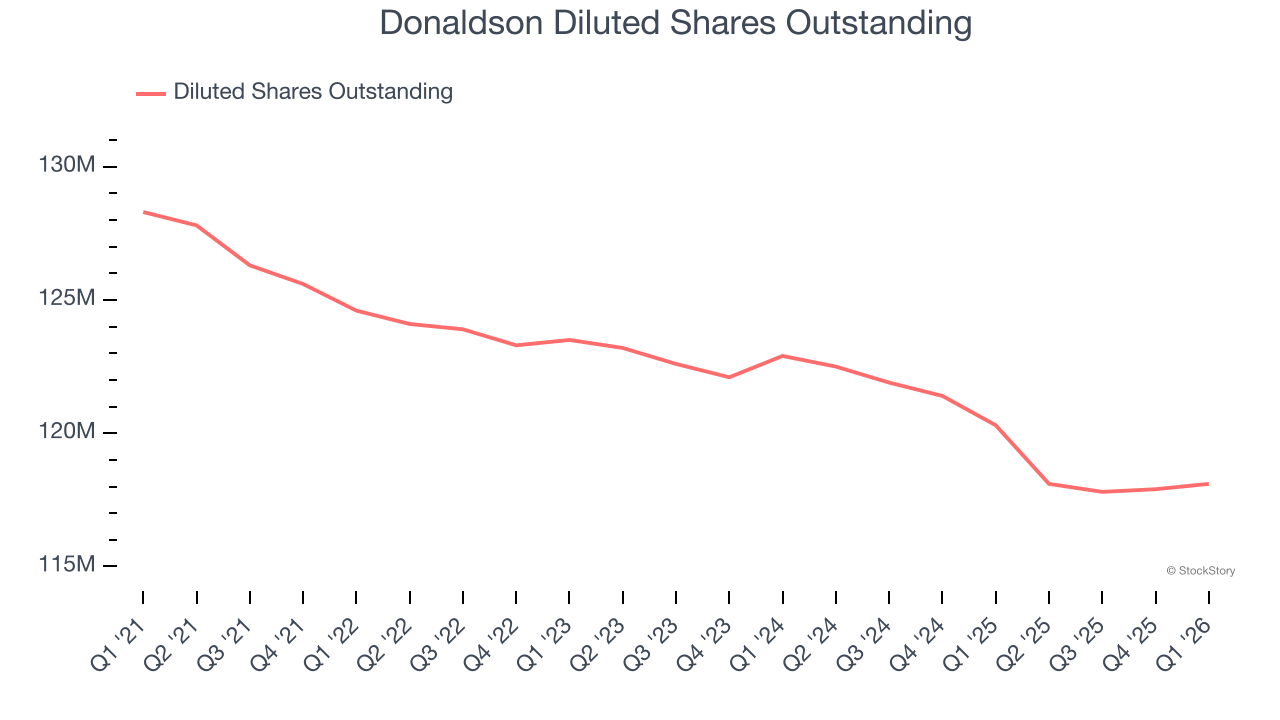
Like with revenue, we analyze EPS over a more recent period because it can provide insight into an emerging theme or development for the business.
For Donaldson, its two-year annual EPS growth of 8.8% was lower than its five-year trend. We hope its growth can accelerate in the future.
In Q1, Donaldson reported adjusted EPS of $1.06, up from $0.99 in the same quarter last year. This print beat analysts’ estimates by 1.2%. We also like to analyze expected EPS growth based on Wall Street analysts’ consensus projections, but there is insufficient data.
Key Takeaways from Donaldson’s Q1 Results
It was good to see Donaldson narrowly top analysts’ organic revenue expectations this quarter. We were also happy its revenue and EPS outperformed Wall Street’s estimates. Zooming out, we think this was a good quarter. The stock traded up 4.9% to $85.76 immediately after reporting.
Should you buy the stock or not? We think that the latest quarter is only one piece of the longer-term business quality puzzle. Quality, when combined with valuation, can help determine if the stock is a buy. We cover that in our actionable full research report which you can read here (it’s free).