


Cable, internet, and telephone services provider Charter (NASDAQ: CHTR) met Wall Street’s revenue expectations in Q1 CY2026, but sales fell by 1% year on year to $13.6 billion. Its GAAP profit of $9.17 per share was 8.2% below analysts’ consensus estimates.
Is now the time to buy Charter? Find out by accessing our full research report, it’s free.
Charter (CHTR) Q1 CY2026 Highlights:
- Revenue: $13.6 billion vs analyst estimates of $13.55 billion (1% year-on-year decline, in line)
- EPS (GAAP): $9.17 vs analyst expectations of $9.98 (8.2% miss)
- Adjusted EBITDA: $5.64 billion vs analyst estimates of $5.63 billion (41.5% margin, in line)
- Operating Margin: 23.6%, in line with the same quarter last year
- Free Cash Flow Margin: 10.1%, down from 13.4% in the same quarter last year
- Internet Subscribers: up 1.58 million year on year
- Market Capitalization: $30.38 billion
"We remain confident about our ability to win in the marketplace and grow over the longer term. That confidence is founded on our advanced network, our core operating strategy of delivering great products at great prices and our focus on increasing customer satisfaction," said Chris Winfrey, President and CEO of Charter.
Company Overview
Operating as Spectrum, Charter (NASDAQ: CHTR) is a leading telecommunications company offering cable television, high-speed internet, and voice services across the United States.
Revenue Growth
A company’s long-term sales performance can indicate its overall quality. Any business can experience short-term success, but top-performing ones enjoy sustained growth for years. Unfortunately, Charter’s 2.3% annualized revenue growth over the last five years was weak. This fell short of our benchmarks and is a tough starting point for our analysis.
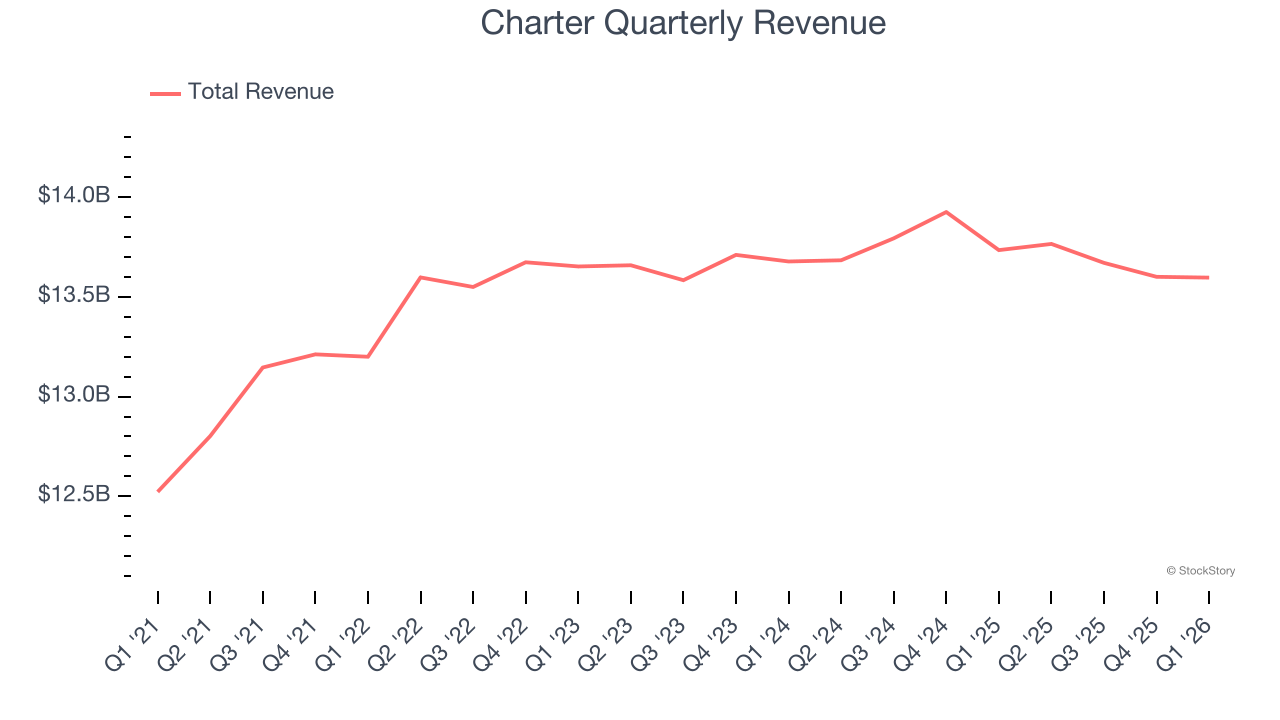
We at StockStory place the most emphasis on long-term growth, but within consumer discretionary, a stretched historical view may miss a company riding a successful new product or trend. Charter’s recent performance shows its demand has slowed as its revenue was flat over the last two years. 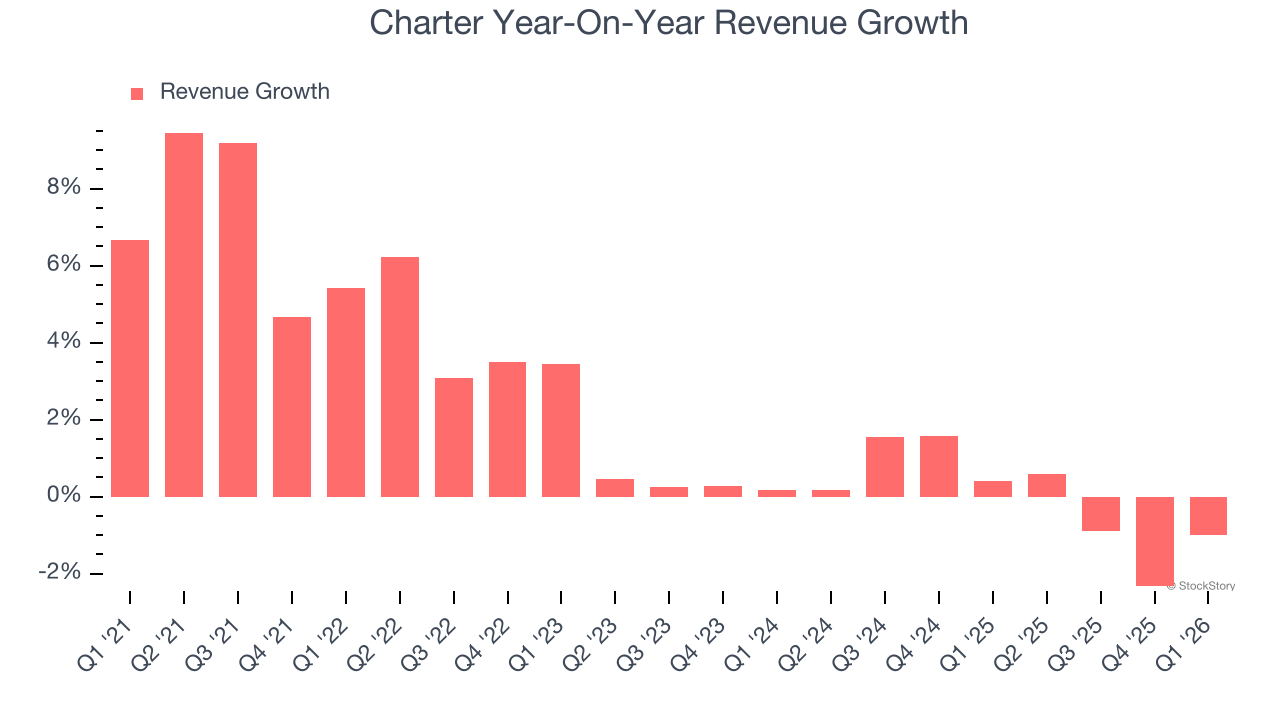
We can dig further into the company’s revenue dynamics by analyzing its number of internet subscribers and video subscribers, which clocked in at 29.56 million and 12.55 million in the latest quarter. Over the last two years, Charter’s internet subscribers averaged 3.2% year-on-year growth. On the other hand, its video subscribers averaged 1.7% year-on-year declines. 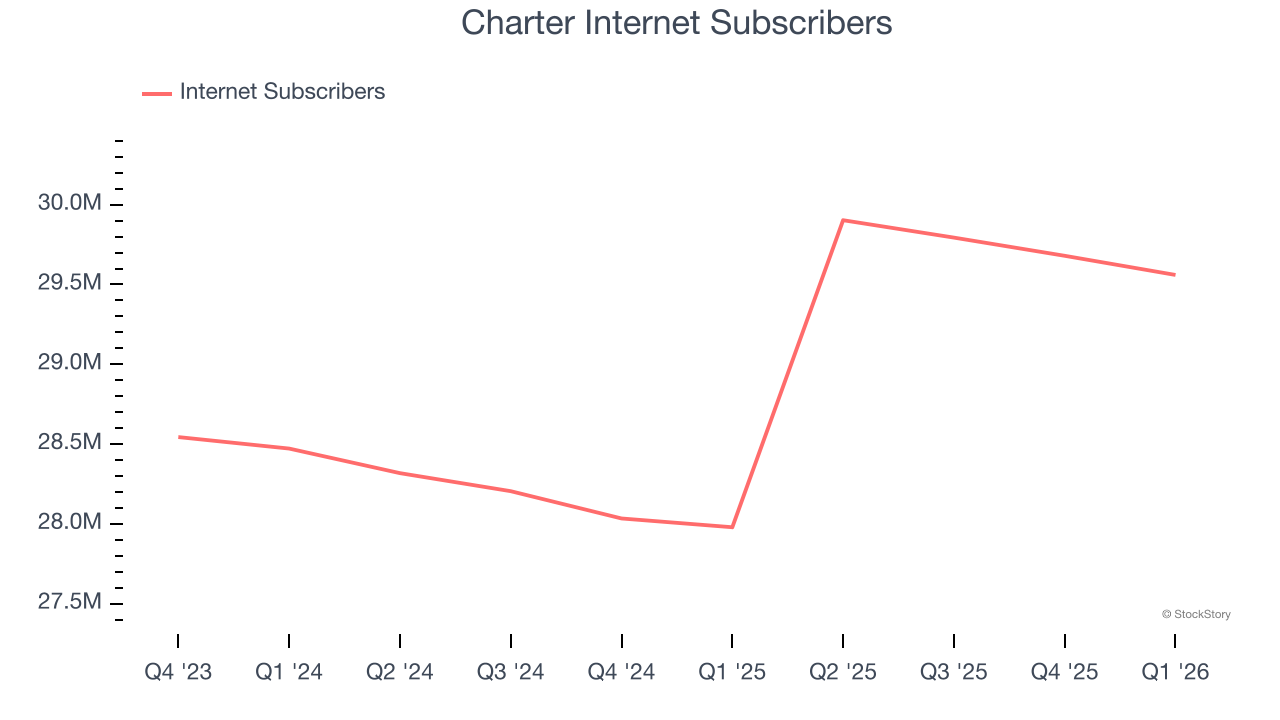
This quarter, Charter reported a rather uninspiring 1% year-on-year revenue decline to $13.6 billion of revenue, in line with Wall Street’s estimates.
Looking ahead, sell-side analysts expect revenue to remain flat over the next 12 months. This projection doesn't excite us and suggests its newer products and services will not accelerate its top-line performance yet.
ONE MORE THING: The $21 AI Application Stock Wall Street Forgot. While Wall Street obsesses over who’s building AI, one company is already using it to print money. And nobody’s paying attention.
AI chip stocks trade at ridiculous valuations. This company processes a trillion consumer signals monthly using AI and trades at a third of the price. The gap won’t last. The institutions will figure it out. You need to see this first. Read the FREE Report Before They Notice.
Operating Margin
Charter’s operating margin has generally stayed the same over the last 12 months, and we generally like to see margin increases due to economies of scale and cost efficiency over time.
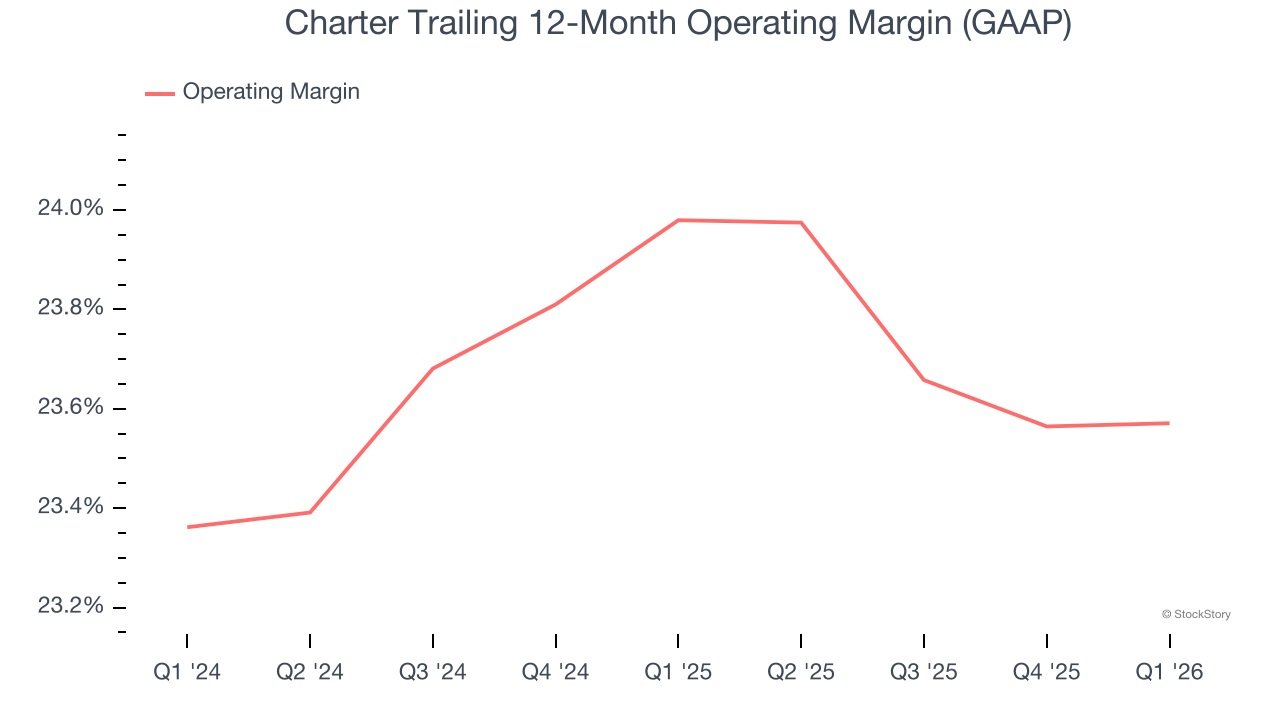
This quarter, Charter generated an operating margin profit margin of 23.6%, in line with the same quarter last year. This indicates the company’s overall cost structure has been relatively stable.
Earnings Per Share
We track the long-term change in earnings per share (EPS) for the same reason as long-term revenue growth. Compared to revenue, however, EPS highlights whether a company’s growth is profitable.
Charter’s EPS grew at 16.4% compounded annual growth rate over the last five years. On the bright side, this performance was better than its 2.3% annualized revenue growth and tells us the company became more profitable on a per-share basis as it expanded.
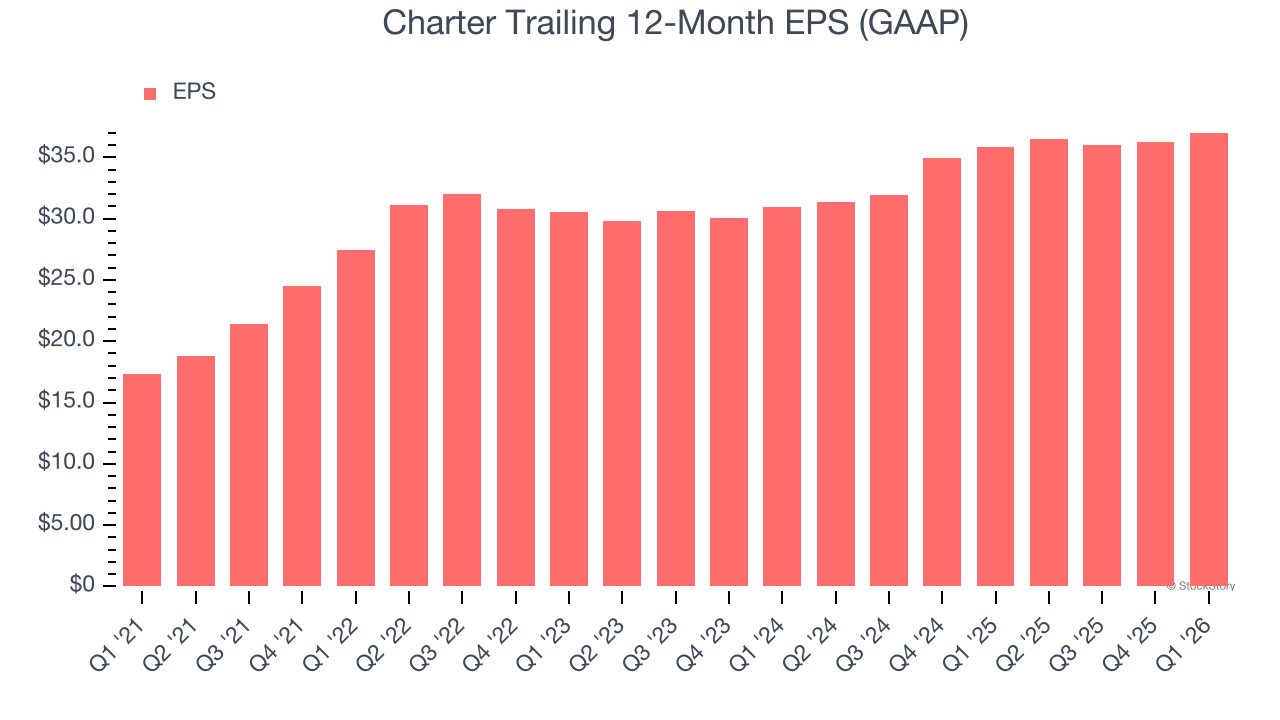
In Q1, Charter reported EPS of $9.17, up from $8.42 in the same quarter last year. Despite growing year on year, this print missed analysts’ estimates. We also like to analyze expected EPS growth based on Wall Street analysts’ consensus projections, but there is insufficient data.
Key Takeaways from Charter’s Q1 Results
It was encouraging to see Charter beat analysts’ adjusted operating income expectations this quarter. On the other hand, its EPS missed. Overall, this was a weaker quarter. The stock traded down 1% to $239.33 immediately following the results.
Charter’s earnings report left more to be desired. Let’s look forward to see if this quarter has created an opportunity to buy the stock. We think that the latest quarter is only one piece of the longer-term business quality puzzle. Quality, when combined with valuation, can help determine if the stock is a buy. We cover that in our actionable full research report which you can read here (it’s free).


