


Industrial supplier Fastenal (NASDAQ: FAST) met Wall Street’s revenue expectations in Q1 CY2026, with sales up 12.4% year on year to $2.2 billion. Its GAAP profit of $0.30 per share was in line with analysts’ consensus estimates.
Is now the time to buy Fastenal? Find out by accessing our full research report, it’s free.
Fastenal (FAST) Q1 CY2026 Highlights:
- Revenue: $2.2 billion vs analyst estimates of $2.2 billion (12.4% year-on-year growth, in line)
- EPS (GAAP): $0.30 vs analyst estimates of $0.30 (in line)
- Adjusted EBITDA: $492.1 million vs analyst estimates of $499.2 million (22.4% margin, 1.4% miss)
- Operating Margin: 20.3%, in line with the same quarter last year
- Free Cash Flow Margin: 14.5%, up from 10.5% in the same quarter last year
- Sales Volumes rose 5.9% year on year (12.4% in the same quarter last year)
- Market Capitalization: $56.46 billion
Company Overview
Founded in 1967, Fastenal (NASDAQ: FAST) provides industrial and construction supplies, including fasteners, tools, safety products, and many other product categories to businesses globally.
Revenue Growth
Examining a company’s long-term performance can provide clues about its quality. Any business can put up a good quarter or two, but the best consistently grow over the long haul. Over the last five years, Fastenal grew its sales at a decent 8.2% compounded annual growth rate. Its growth was slightly above the average industrials company and shows its offerings resonate with customers.
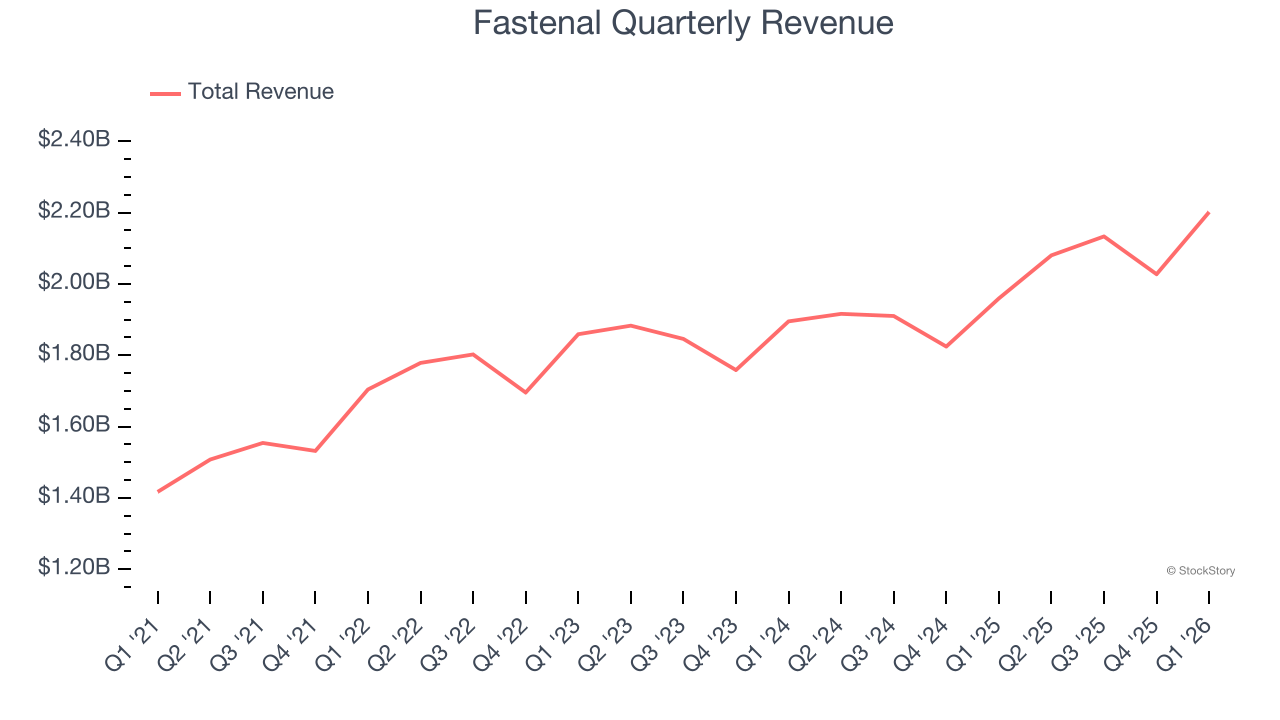
We at StockStory place the most emphasis on long-term growth, but within industrials, a half-decade historical view may miss cycles, industry trends, or a company capitalizing on catalysts such as a new contract win or a successful product line. Fastenal’s recent performance shows its demand has slowed as its annualized revenue growth of 6.9% over the last two years was below its five-year trend. We’re wary when companies in the sector see decelerations in revenue growth, as it could signal changing consumer tastes aided by low switching costs. 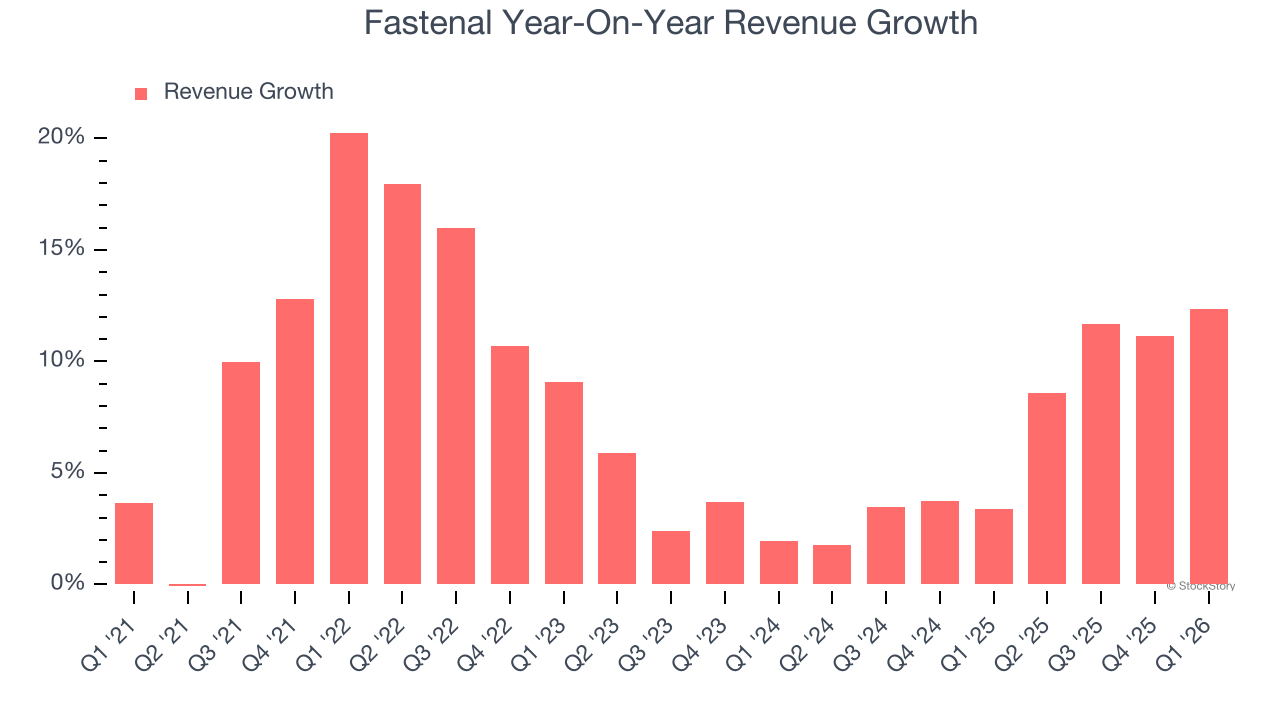
We can better understand the company’s revenue dynamics by analyzing its number of units sold, which reached 137,702 in the latest quarter. Over the last two years, Fastenal’s units sold averaged 9.1% year-on-year growth. Because this number is better than its revenue growth, we can see the company’s average selling price decreased. 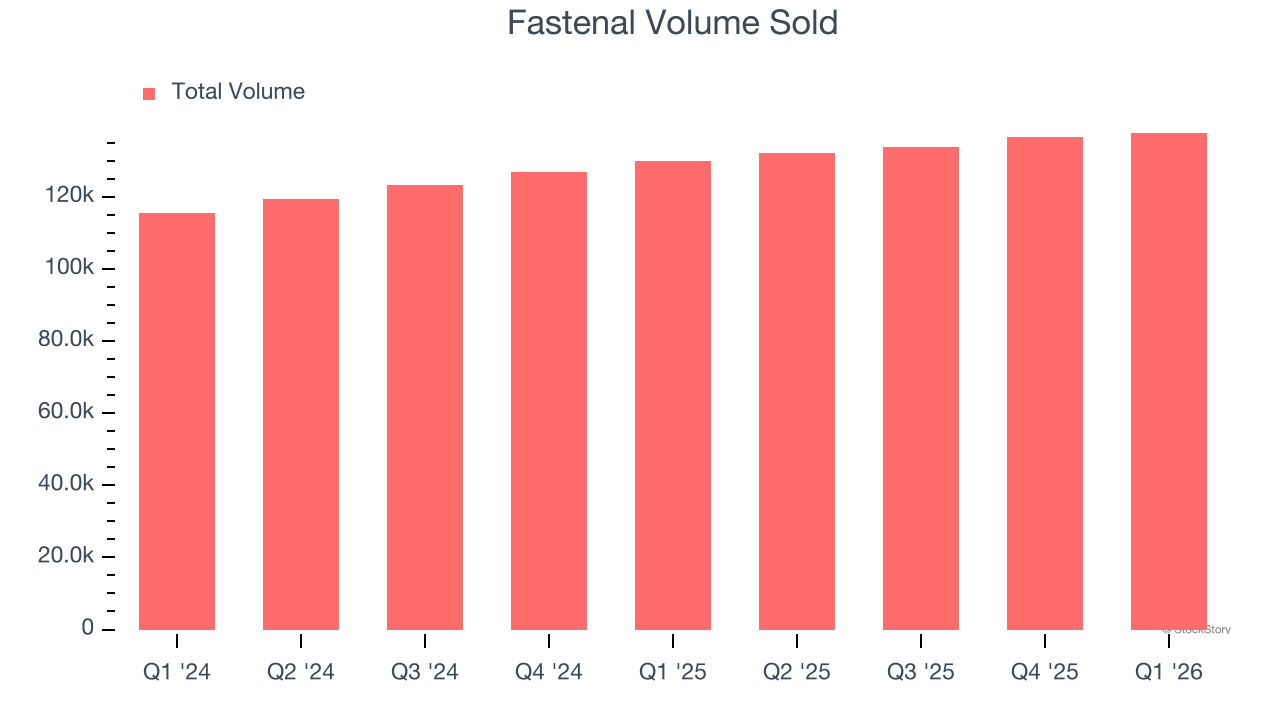
This quarter, Fastenal’s year-on-year revenue growth was 12.4%, and its $2.2 billion of revenue was in line with Wall Street’s estimates.
Looking ahead, sell-side analysts expect revenue to grow 10% over the next 12 months, an improvement versus the last two years. This projection is noteworthy and indicates its newer products and services will spur better top-line performance.
WHILE YOU’RE HERE: The Next Palantir? One satellite company captures images of every point on Earth. Every single day. The Pentagon wants it. Hedge funds are using it to beat earnings. You’ve probably never heard of it.
This is what the early days of Palantir looked like before it became a $437 billion giant. Same playbook. Different technology. If you missed Palantir, you need to see this. Claim The Stock Ticker for Free HERE.
Operating Margin
Operating margin is an important measure of profitability as it shows the portion of revenue left after accounting for all core expenses – everything from the cost of goods sold to advertising and wages. It’s also useful for comparing profitability across companies with different levels of debt and tax rates because it excludes interest and taxes.
Fastenal’s operating margin has more or less stayed the same over the last 12 months , averaging 20.4% over the last five years. This profitability was elite for an industrials business thanks to its efficient cost structure and economies of scale. This result isn’t surprising as its high gross margin gives it a favorable starting point.
Analyzing the trend in its profitability, Fastenal’s operating margin might fluctuated slightly but has generally stayed the same over the last five years. We like to see margin expansion, but Fastenal’s performance still shows it’s one of the better Maintenance and Repair Distributors companies as most peers saw their margins plummet.
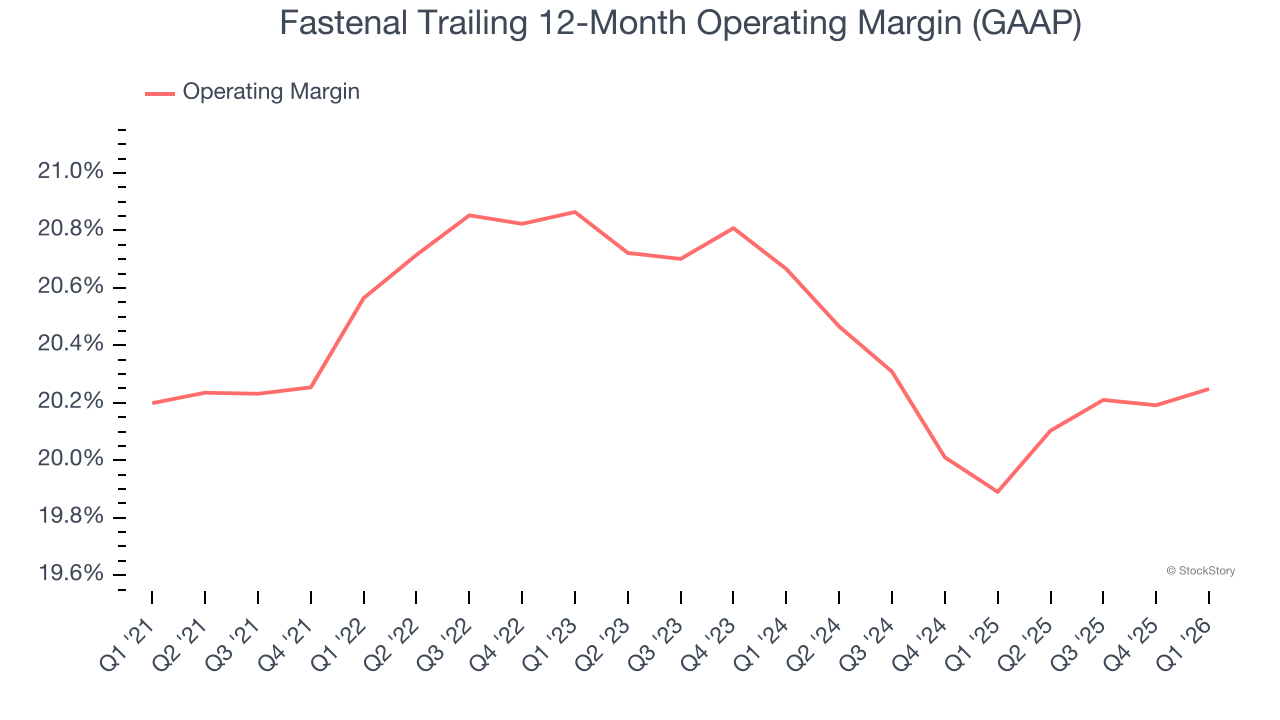
In Q1, Fastenal generated an operating margin profit margin of 20.3%, in line with the same quarter last year. This indicates the company’s cost structure has recently been stable.
Earnings Per Share
We track the long-term change in earnings per share (EPS) for the same reason as long-term revenue growth. Compared to revenue, however, EPS highlights whether a company’s growth is profitable.
Fastenal’s decent 8.5% annual EPS growth over the last five years aligns with its revenue performance. This tells us it maintained its per-share profitability as it expanded.
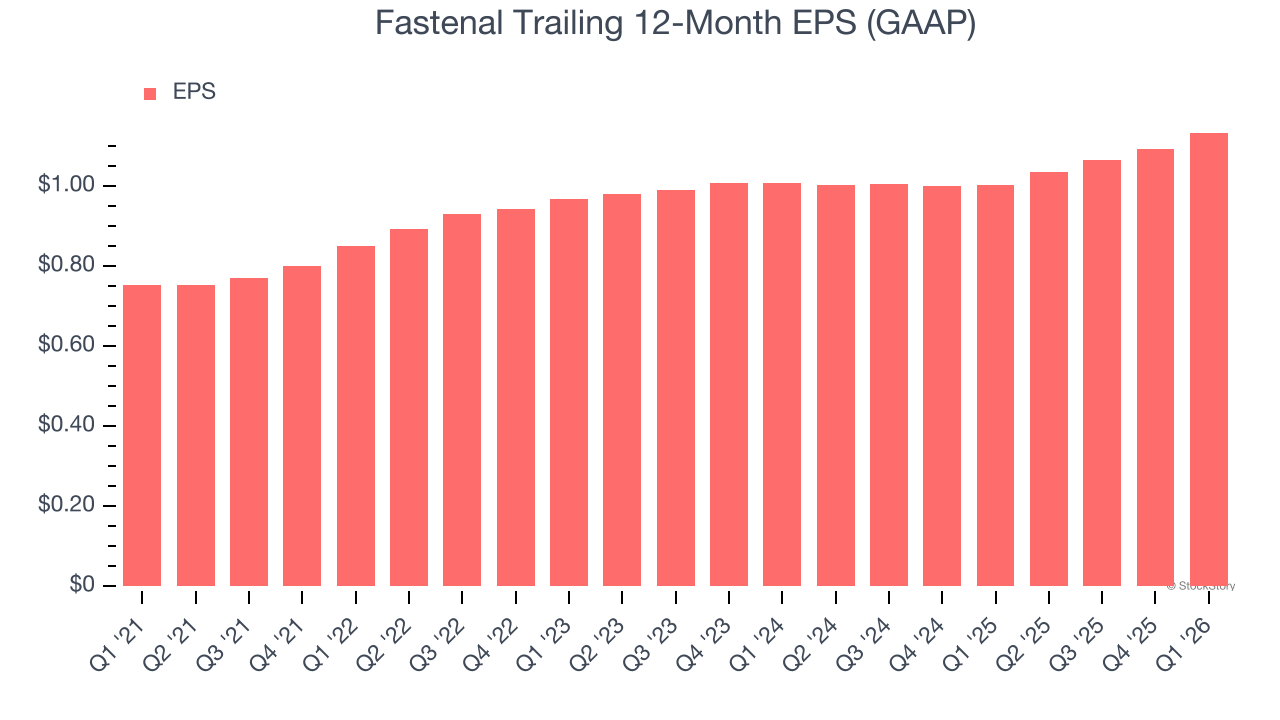
Like with revenue, we analyze EPS over a shorter period to see if we are missing a change in the business.
For Fastenal, its two-year annual EPS growth of 6% was lower than its five-year trend. We hope its growth can accelerate in the future.
In Q1, Fastenal reported EPS of $0.30, up from $0.26 in the same quarter last year. This print was close to analysts’ estimates. Over the next 12 months, Wall Street expects Fastenal’s full-year EPS of $1.13 to grow 11.2%.
Key Takeaways from Fastenal’s Q1 Results
We struggled to find many positives in these results. Revenue and EPS were just in line with expectations. This, combined with the broader market decline on news that the US would partially blockade the Straight of Hormuz, caused the stock to trade down 5.9% to $46.93 immediately after reporting.
Big picture, is Fastenal a buy here and now? We think that the latest quarter is only one piece of the longer-term business quality puzzle. Quality, when combined with valuation, can help determine if the stock is a buy. We cover that in our actionable full research report which you can read here (it’s free).


