Solar tracking systems manufacturer Array (NASDAQ: ARRY) announced better-than-expected revenue in Q1 CY2025, with sales up 97.1% year on year to $302.4 million. The company’s full-year revenue guidance of $1.1 billion at the midpoint came in 0.6% above analysts’ estimates. Its non-GAAP profit of $0.13 per share was 47.4% above analysts’ consensus estimates.
Is now the time to buy Array? Find out by accessing our full research report, it’s free.
Array (ARRY) Q1 CY2025 Highlights:
- Revenue: $302.4 million vs analyst estimates of $264.6 million (97.1% year-on-year growth, 14.3% beat)
- Adjusted EPS: $0.13 vs analyst estimates of $0.09 (47.4% beat)
- Adjusted EBITDA: $40.59 million vs analyst estimates of $32 million (13.4% margin, 26.8% beat)
- The company reconfirmed its revenue guidance for the full year of $1.1 billion at the midpoint
- Management reiterated its full-year Adjusted EPS guidance of $0.65 at the midpoint
- EBITDA guidance for the full year is $190 million at the midpoint, above analyst estimates of $186.1 million
- Operating Margin: 9%, up from 5.5% in the same quarter last year
- Free Cash Flow was -$15.41 million, down from $45.12 million in the same quarter last year
- Market Capitalization: $751.9 million
“ARRAY is off to a great start for 2025 with first quarter high double digits revenue growth compared with the first quarter of 2024, and achieving the second largest quarter of volume shipped since 2023, indicating solid market share recovery and the strength of our execution capabilities. We are now able to provide customers with quotes for our 100% domestic content trackers under Table I of the Inflation Reduction Act (“IRA”), an important milestone for ARRAY, reflecting our continued commitment to supply chain resilience and ability to minimize effects of geopolitical uncertainty, including tariffs."
Company Overview
Going public in October 2020, Array (NASDAQ: ARRY) is a global manufacturer of ground-mounting tracking systems for utility and distributed generation solar energy projects.
Sales Growth
A company’s long-term performance is an indicator of its overall quality. Any business can have short-term success, but a top-tier one grows for years. Regrettably, Array’s sales grew at a weak 1.2% compounded annual growth rate over the last five years. This was below our standards and is a tough starting point for our analysis.
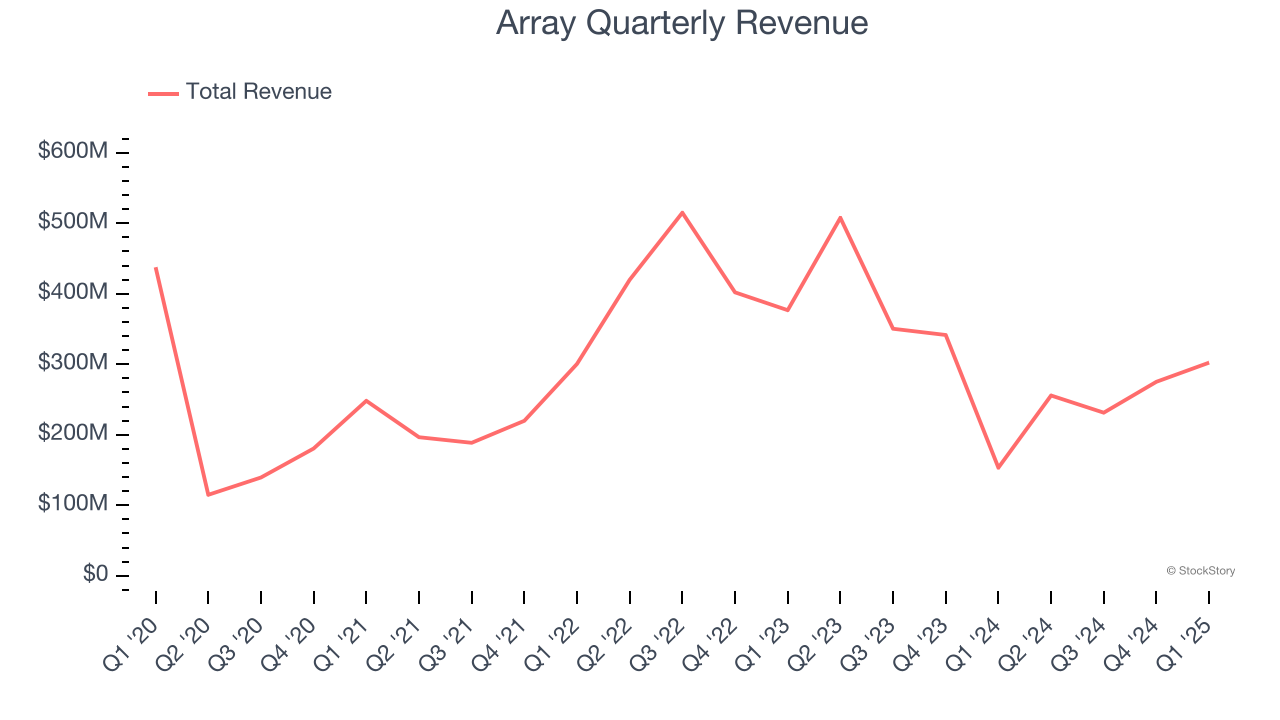
We at StockStory place the most emphasis on long-term growth, but within industrials, a half-decade historical view may miss cycles, industry trends, or a company capitalizing on catalysts such as a new contract win or a successful product line. Array’s performance shows it grew in the past but relinquished its gains over the last two years, as its revenue fell by 21.2% annually. Array isn’t alone in its struggles as the Renewable Energy industry experienced a cyclical downturn, with many similar businesses observing lower sales at this time. 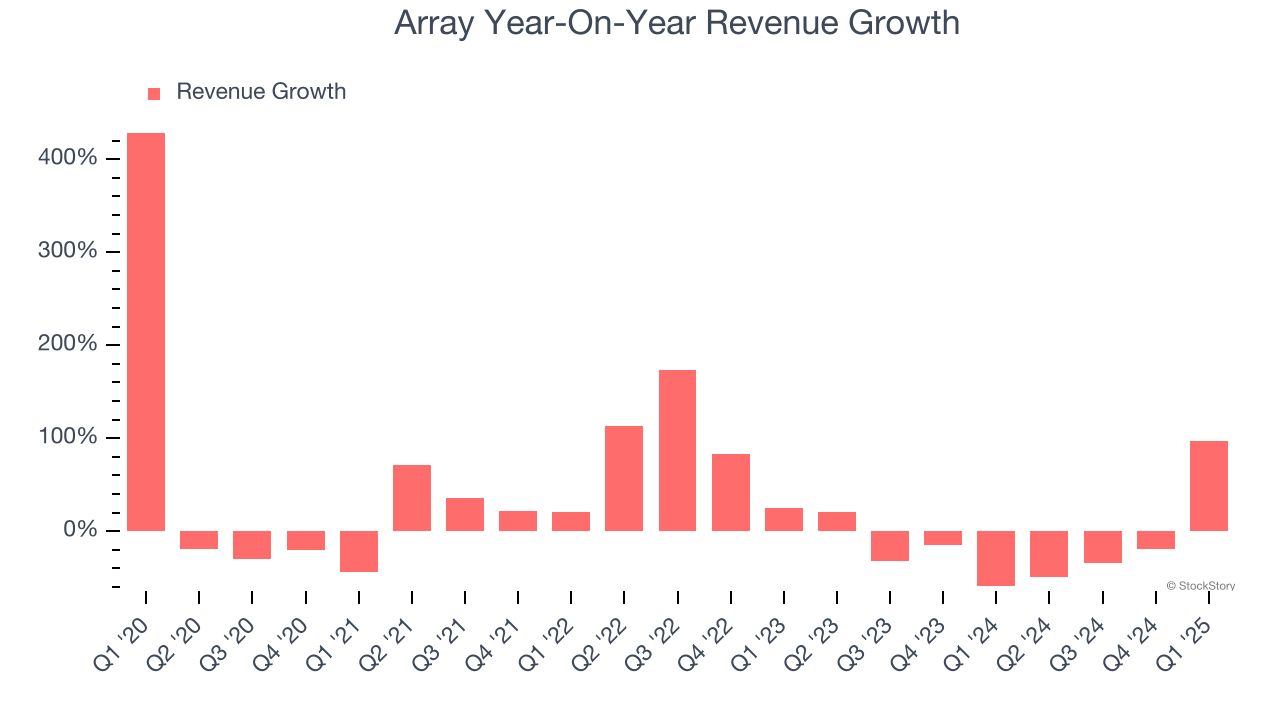
This quarter, Array reported magnificent year-on-year revenue growth of 97.1%, and its $302.4 million of revenue beat Wall Street’s estimates by 14.3%.
Looking ahead, sell-side analysts expect revenue to grow 3.9% over the next 12 months. While this projection implies its newer products and services will spur better top-line performance, it is still below average for the sector.
Today’s young investors won’t have read the timeless lessons in Gorilla Game: Picking Winners In High Technology because it was written more than 20 years ago when Microsoft and Apple were first establishing their supremacy. But if we apply the same principles, then enterprise software stocks leveraging their own generative AI capabilities may well be the Gorillas of the future. So, in that spirit, we are excited to present our Special Free Report on a profitable, fast-growing enterprise software stock that is already riding the automation wave and looking to catch the generative AI next.
Operating Margin
Array was roughly breakeven when averaging the last five years of quarterly operating profits, one of the worst outcomes in the industrials sector. This result isn’t too surprising given its low gross margin as a starting point.
Analyzing the trend in its profitability, Array’s operating margin decreased by 20.9 percentage points over the last five years. This raises questions about the company’s expense base because its revenue growth should have given it leverage on its fixed costs, resulting in better economies of scale and profitability. Array’s performance was poor no matter how you look at it - it shows that costs were rising and it couldn’t pass them onto its customers.
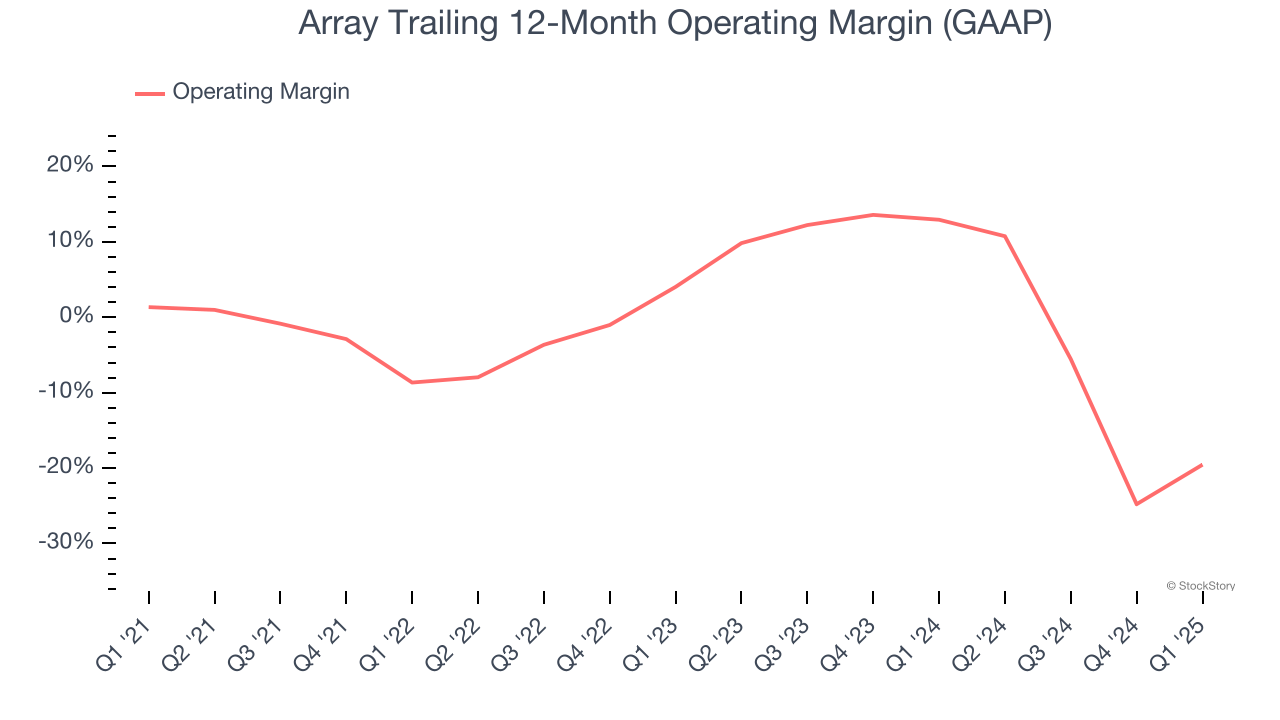
This quarter, Array generated an operating profit margin of 9%, up 3.5 percentage points year on year. The increase was encouraging, and because its gross margin actually decreased, we can assume it was more efficient because its operating expenses like marketing, R&D, and administrative overhead grew slower than its revenue.
Earnings Per Share
Revenue trends explain a company’s historical growth, but the long-term change in earnings per share (EPS) points to the profitability of that growth – for example, a company could inflate its sales through excessive spending on advertising and promotions.
Sadly for Array, its EPS declined by 18% annually over the last five years while its revenue grew by 1.2%. This tells us the company became less profitable on a per-share basis as it expanded.
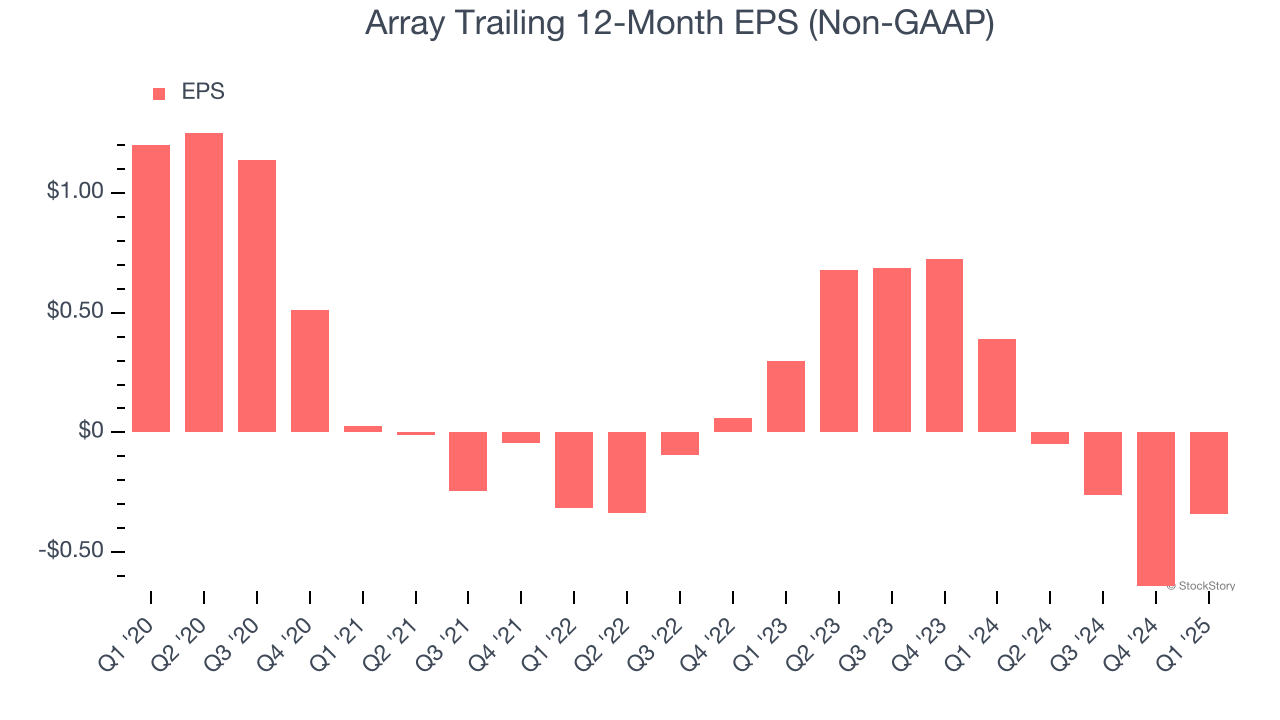
Diving into the nuances of Array’s earnings can give us a better understanding of its performance. As we mentioned earlier, Array’s operating margin improved this quarter but declined by 20.9 percentage points over the last five years. This was the most relevant factor (aside from the revenue impact) behind its lower earnings; taxes and interest expenses can also affect EPS but don’t tell us as much about a company’s fundamentals.
Like with revenue, we analyze EPS over a shorter period to see if we are missing a change in the business.
For Array, its two-year annual EPS declines of 77.3% show it’s continued to underperform. These results were bad no matter how you slice the data.
In Q1, Array reported EPS at $0.13, up from negative $0.17 in the same quarter last year. This print easily cleared analysts’ estimates, and shareholders should be content with the results. Over the next 12 months, Wall Street is optimistic. Analysts forecast Array’s full-year EPS of negative $0.34 will flip to positive $0.65.
Key Takeaways from Array’s Q1 Results
We were impressed by how significantly Array blew past analysts’ revenue, EPS, and EBITDA expectations this quarter. We were also excited its guidance topped Wall Street’s estimates. Zooming out, we think this quarter featured some important positives. The stock traded up 9.8% to $5.40 immediately after reporting.
Sure, Array had a solid quarter, but if we look at the bigger picture, is this stock a buy? What happened in the latest quarter matters, but not as much as longer-term business quality and valuation, when deciding whether to invest in this stock. We cover that in our actionable full research report which you can read here, it’s free.