Gas handling company Chart (NYSE: GTLS) met Wall Street’s revenue expectations in Q1 CY2025, with sales up 5.3% year on year to $1.00 billion. The company’s full-year revenue guidance of $4.75 billion at the midpoint came in 2.5% above analysts’ estimates. Its non-GAAP profit of $1.86 per share was 1.8% above analysts’ consensus estimates.
Is now the time to buy Chart? Find out by accessing our full research report, it’s free.
Chart (GTLS) Q1 CY2025 Highlights:
- Revenue: $1.00 billion vs analyst estimates of $1.00 billion (5.3% year-on-year growth, in line)
- Adjusted EPS: $1.86 vs analyst estimates of $1.83 (1.8% beat)
- Adjusted EBITDA: $231.1 million vs analyst estimates of $229.4 million (23.1% margin, 0.7% beat)
- The company reconfirmed its revenue guidance for the full year of $4.75 billion at the midpoint
- Management reiterated its full-year Adjusted EPS guidance of $12.50 at the midpoint
- EBITDA guidance for the full year is $1.2 billion at the midpoint, above analyst estimates of $1.16 billion
- Operating Margin: 15.2%, up from 11.9% in the same quarter last year
- Free Cash Flow was -$80.1 million compared to -$141.2 million in the same quarter last year
- Backlog: $5.14 billion at quarter end, up 18.8% year on year
- Market Capitalization: $6.07 billion
“We delivered strong order and organic sales growth of 17.3% and 6.6% in the first quarter of 2025. This marks our fourth consecutive quarter of reported gross profit margin above 33%, which contributed to a 190 basis points expansion in adjusted operating income margin,” stated Jill Evanko, Chart Industries’ CEO and President.
Company Overview
Installing the first bulk Co2 tank for McDonalds’s sodas, Chart (NYSE: GTLS) provides equipment to store and transport gasses.
Sales Growth
Examining a company’s long-term performance can provide clues about its quality. Any business can put up a good quarter or two, but many enduring ones grow for years. Over the last five years, Chart grew its sales at an incredible 27.5% compounded annual growth rate. Its growth surpassed the average industrials company and shows its offerings resonate with customers, a great starting point for our analysis.
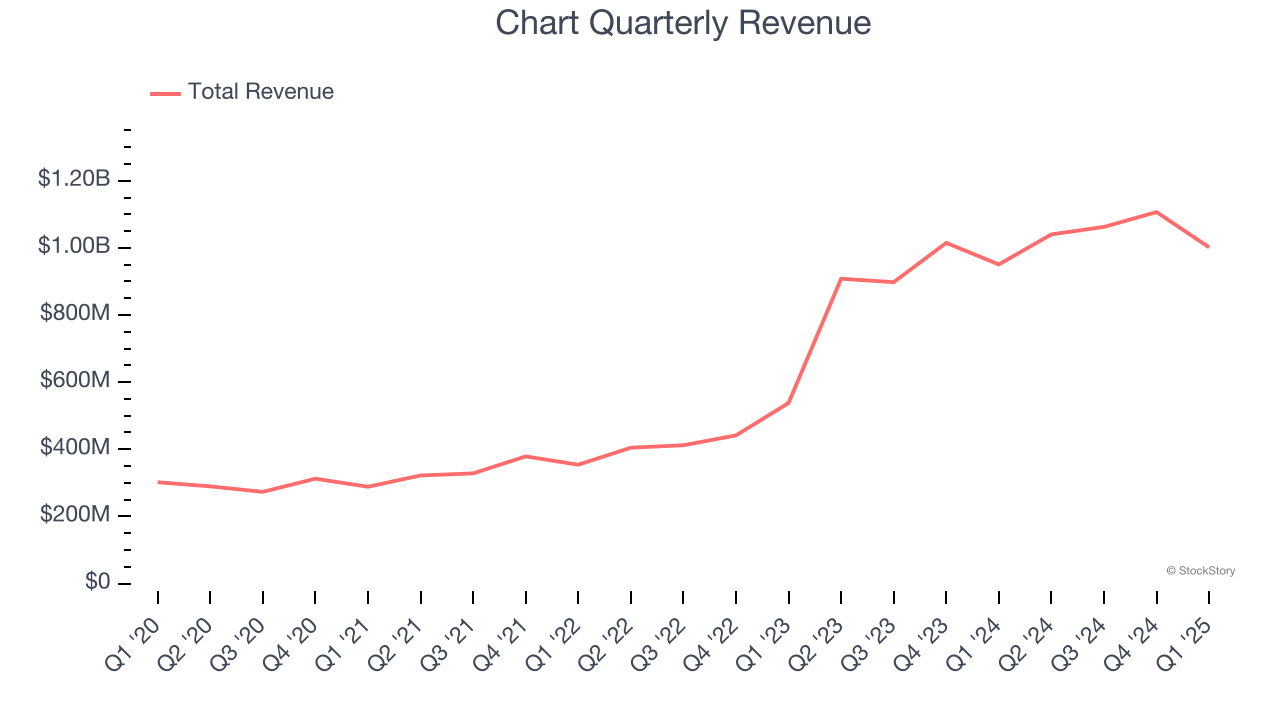
Long-term growth is the most important, but within industrials, a half-decade historical view may miss new industry trends or demand cycles. Chart’s annualized revenue growth of 53.1% over the last two years is above its five-year trend, suggesting its demand was strong and recently accelerated. 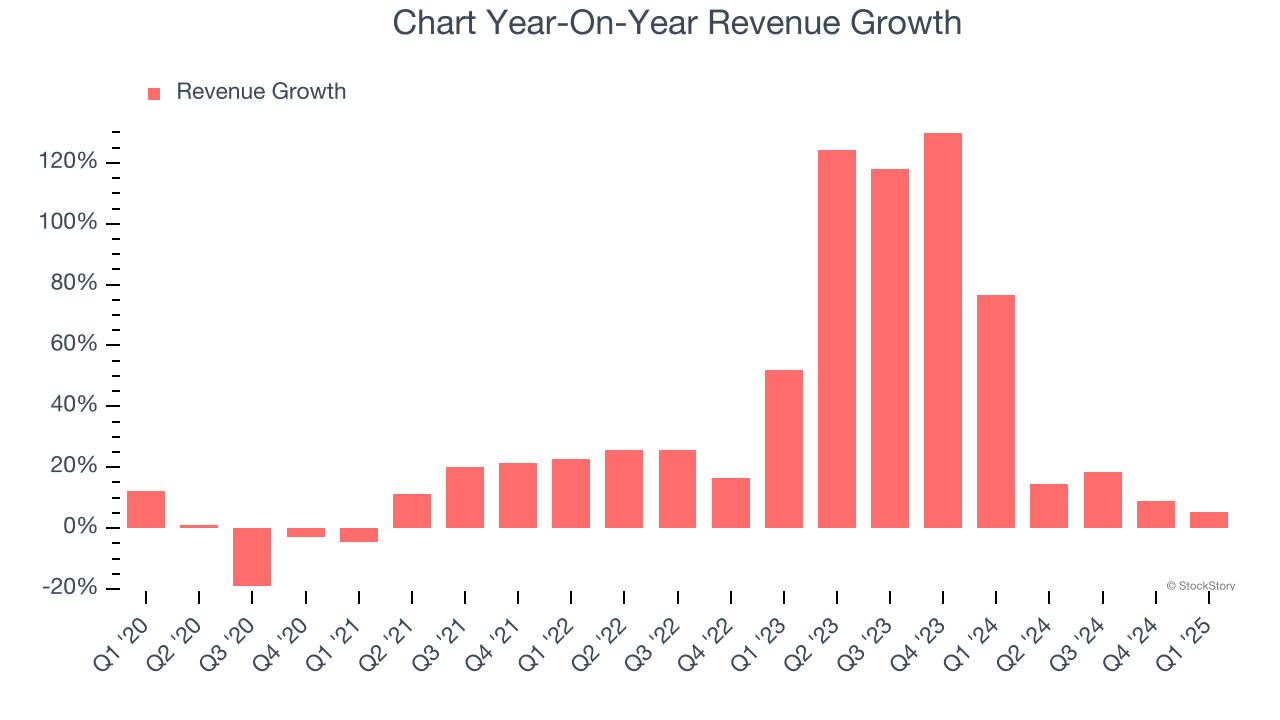
We can better understand the company’s revenue dynamics by analyzing its backlog, or the value of its outstanding orders that have not yet been executed or delivered. Chart’s backlog reached $5.14 billion in the latest quarter and averaged 41.6% year-on-year growth over the last two years. Because this number is lower than its revenue growth, we can see the company fulfilled orders at a faster rate than it added new orders to the backlog. This implies Chart was operating efficiently but raises questions about the health of its sales pipeline. 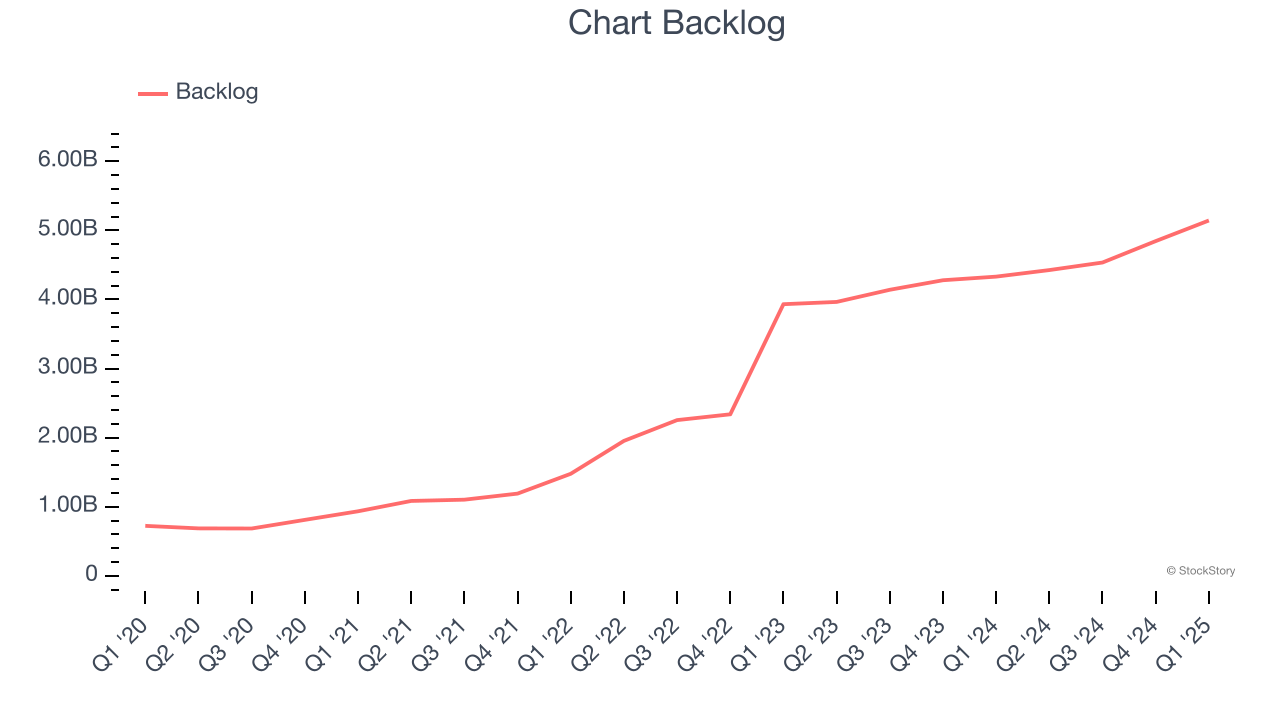
This quarter, Chart grew its revenue by 5.3% year on year, and its $1.00 billion of revenue was in line with Wall Street’s estimates.
Looking ahead, sell-side analysts expect revenue to grow 13% over the next 12 months, a deceleration versus the last two years. Still, this projection is noteworthy and implies the market is baking in success for its products and services.
Here at StockStory, we certainly understand the potential of thematic investing. Diverse winners from Microsoft (MSFT) to Alphabet (GOOG), Coca-Cola (KO) to Monster Beverage (MNST) could all have been identified as promising growth stories with a megatrend driving the growth. So, in that spirit, we’ve identified a relatively under-the-radar profitable growth stock benefiting from the rise of AI, available to you FREE via this link.
Operating Margin
Operating margin is one of the best measures of profitability because it tells us how much money a company takes home after procuring and manufacturing its products, marketing and selling those products, and most importantly, keeping them relevant through research and development.
Chart has been an efficient company over the last five years. It was one of the more profitable businesses in the industrials sector, boasting an average operating margin of 12.2%.
Looking at the trend in its profitability, Chart’s operating margin rose by 7.3 percentage points over the last five years, as its sales growth gave it immense operating leverage.
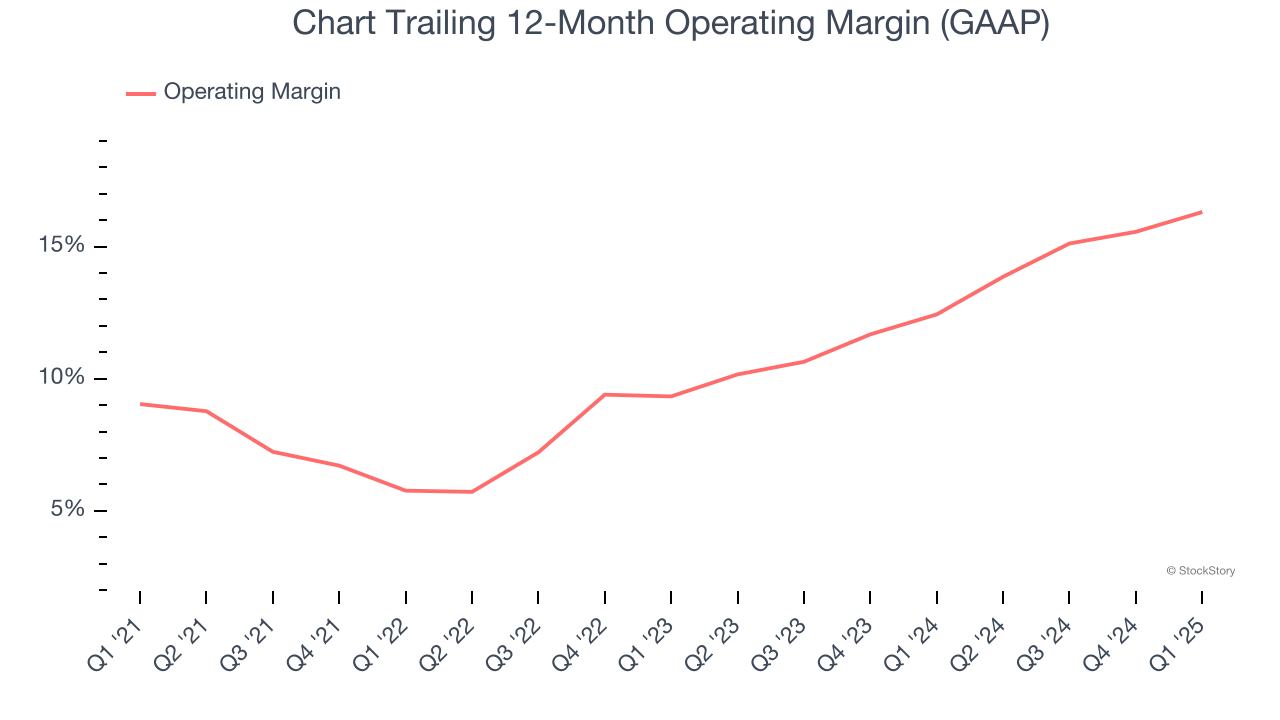
This quarter, Chart generated an operating profit margin of 15.2%, up 3.3 percentage points year on year. The increase was encouraging, and because its operating margin rose more than its gross margin, we can infer it was more efficient with expenses such as marketing, R&D, and administrative overhead.
Earnings Per Share
Revenue trends explain a company’s historical growth, but the long-term change in earnings per share (EPS) points to the profitability of that growth – for example, a company could inflate its sales through excessive spending on advertising and promotions.
Chart’s EPS grew at an astounding 28.9% compounded annual growth rate over the last five years, higher than its 27.5% annualized revenue growth. This tells us the company became more profitable on a per-share basis as it expanded.
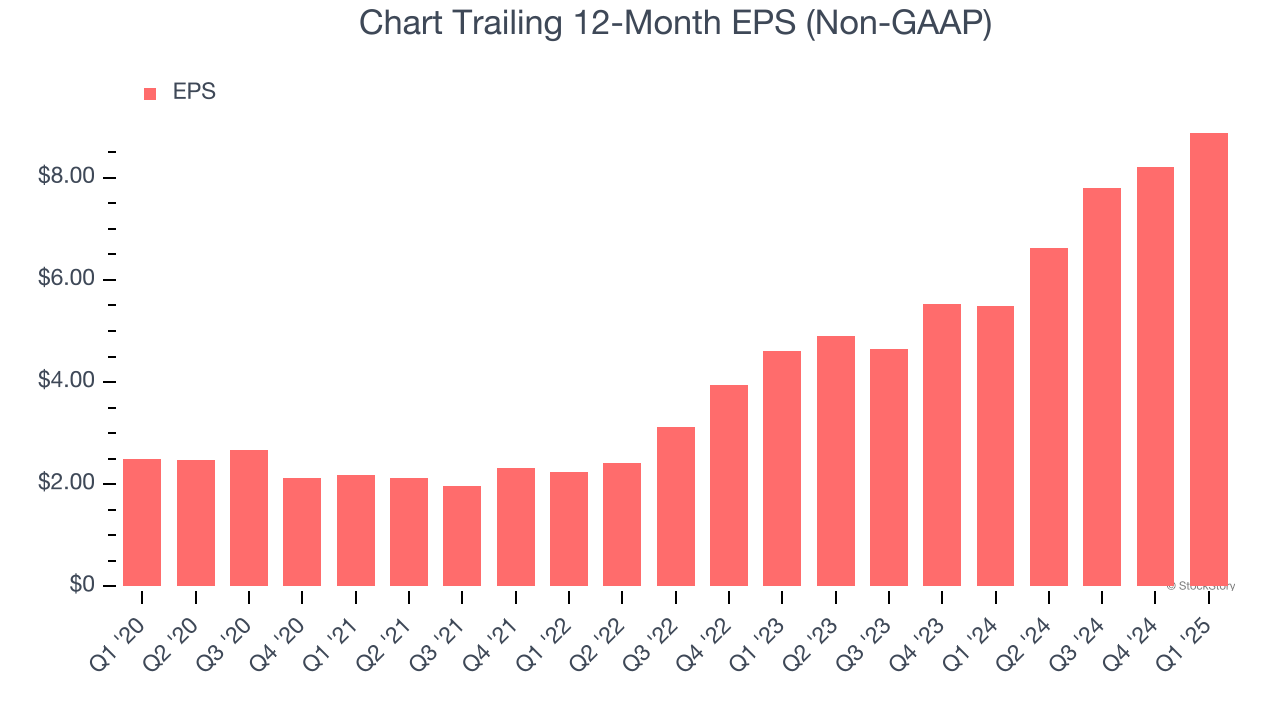
Diving into the nuances of Chart’s earnings can give us a better understanding of its performance. As we mentioned earlier, Chart’s operating margin expanded by 7.3 percentage points over the last five years. This was the most relevant factor (aside from the revenue impact) behind its higher earnings; taxes and interest expenses can also affect EPS but don’t tell us as much about a company’s fundamentals.
Like with revenue, we analyze EPS over a shorter period to see if we are missing a change in the business.
For Chart, its two-year annual EPS growth of 38.9% was higher than its five-year trend. We love it when earnings growth accelerates, especially when it accelerates off an already high base.
In Q1, Chart reported EPS at $1.86, up from $1.19 in the same quarter last year. This print beat analysts’ estimates by 1.8%. Over the next 12 months, Wall Street expects Chart’s full-year EPS of $8.88 to grow 45.5%.
Key Takeaways from Chart’s Q1 Results
We were impressed by Chart’s optimistic full-year EBITDA guidance, which blew past analysts’ expectations. We were also glad its backlog outperformed Wall Street’s estimates. On the other hand, its revenue was in line. Zooming out, we think this was a solid quarter. The stock traded up 2.2% to $137.75 immediately following the results.
Chart put up rock-solid earnings, but one quarter doesn’t necessarily make the stock a buy. Let’s see if this is a good investment. The latest quarter does matter, but not nearly as much as longer-term fundamentals and valuation, when deciding if the stock is a buy. We cover that in our actionable full research report which you can read here, it’s free.