


The biotech sector, iShares Biotechnology ETF (NASDAQ: IBB), has enjoyed steady buying lately, closing in the green for seven consecutive days. The recent rally comes after the sector ETF broke out of a tight consolidation after sharply bouncing from its 52-week low.
Buyers have stepped in since the ETF made a new 52-week low in late October. Since then, it has rallied almost 10%. Notably, the IBB has a 52-week range of $111.83 to $138.26. In just over four weeks, the sector ETF has traded from the low end of that range to the mid-point.
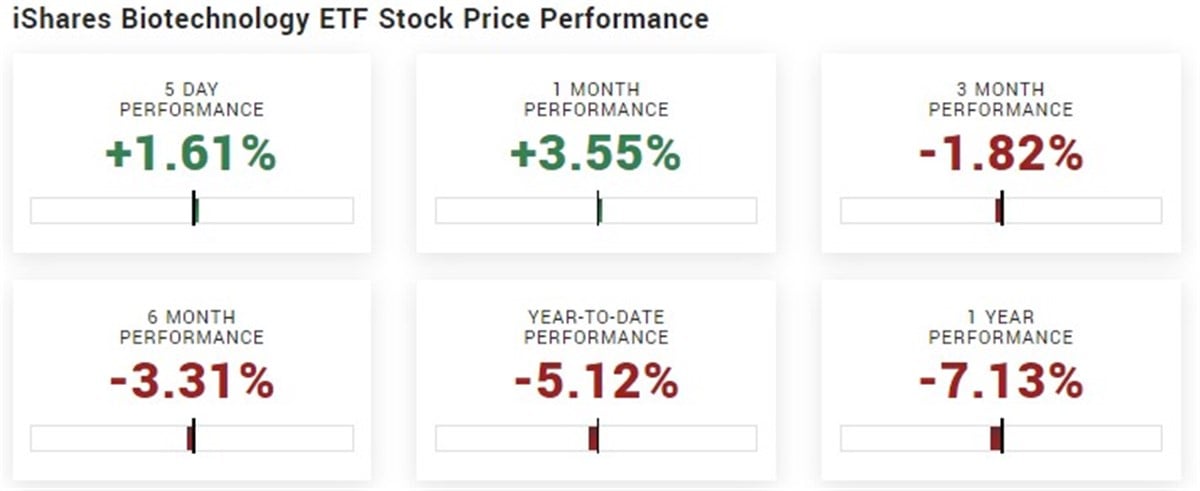
However, despite its recent impressive display, the ETF is slightly negative year-to-date, down 5.12%. Interestingly, after the ETF broke lower in September from its significant consolidation on the daily, it made a new 52-week low, but the ETF is now back above that critical level.
So, will the short-lived move lower in the ETF result in a fast move higher?
Technical overview of the IBB
The iShares Biotechnology ETF is an exchange-traded fund that aims to match the performance of the NASDAQ Biotechnology Index. This index includes biotechnology and pharmaceutical companies listed on NASDAQ that meet specific industry and eligibility criteria set by NASDAQ. The ETF seeks to replicate the price and yield outcomes of this index.
The ETF has $6.67 billion in assets under management, offering a dividend yield of just 0.26% and a net expense ratio of 0.44%. Therefore, one might safely assume it’s an ETF most suitable for a growth-minded investor instead of a value- and dividend-focused investor.
Its holdings' geographic exposure is predominantly in the United States, with a 97.1% exposure to the region. Regarding sector exposure, the ETF is mainly exposed to the healthcare sector, with an 85% exposure.
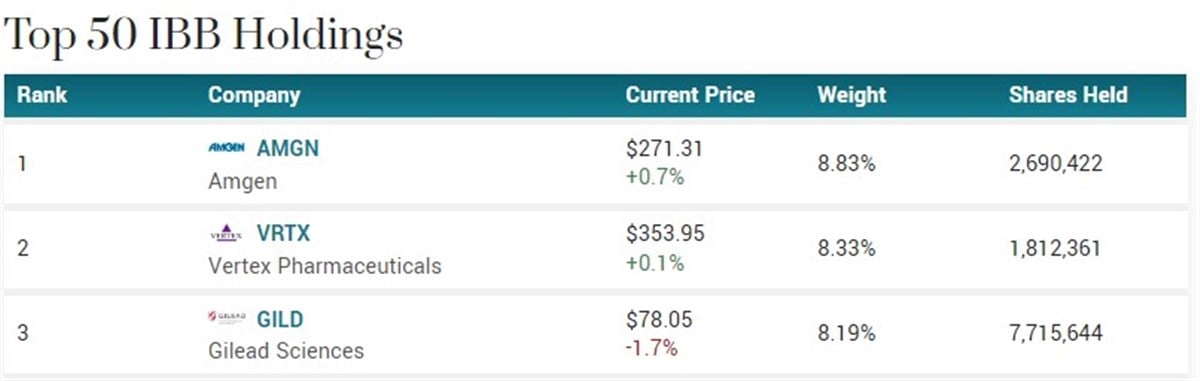
Keeping an eye on the major holdings of the IBB is essential as they have significant influence over the ETF's price and momentum, thereby impacting the sector. Powerful movements or volatility within these holdings can also influence the overall sentiment of the sector. So, not only is it crucial to gauge the relative strength and weakness of the biotech sector compared to others, but it’s also vital to pinpoint relative strength and weakness within the sector's top holdings.
Failed move lower might result in a significant move higher
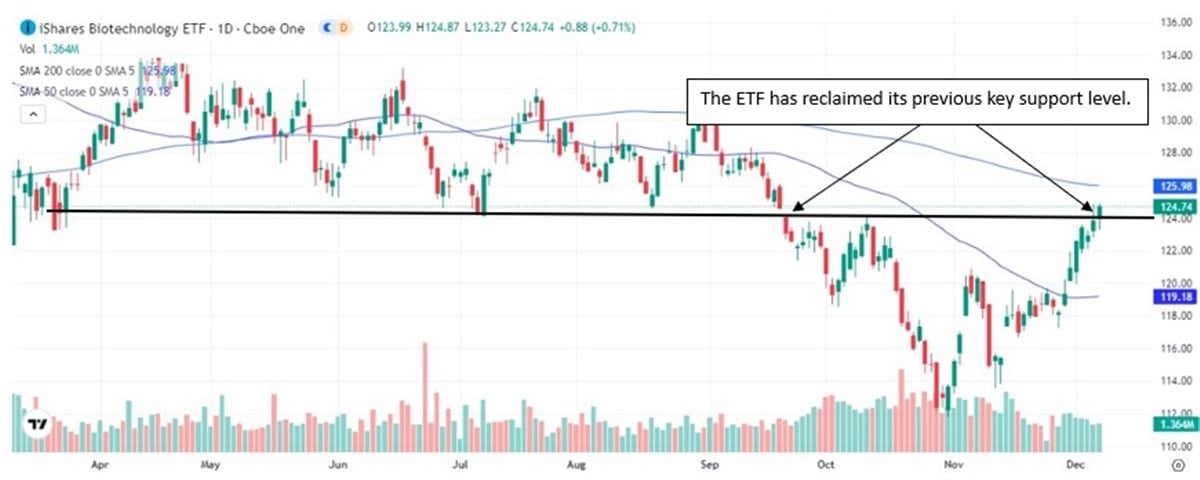
Although the ETF is still negative year-to-date, an interesting development has recently occurred. In September, the stock broke below a key support level at $124 and traded significantly lower, making a new 52-week low.
However, since making that new 52-week low, the stock has reversed sharply and reclaimed previous support. From a technical analysis perspective, the reversal is bullish and if the ETF can hold firm above $124, momentum might be shifting on a higher time frame.
The short-term trend of the sector is firm to the upside, with the IBB trading above its 20 and 50-day Simple Moving Average. However, for a higher time frame trend shift to be confirmed and gain some legs, the ETF must reclaim its 200-day Simple Moving Average, which is near $126.


