

For more than a decade, one trendline on the chart has quietly shaped global markets. That line sits near 98 on the chart for the U.S. Dollar Index (DXY) — and right now, the dollar is testing this critical line in the sand again.
During a recent Market on Close livestream, Senior Market Strategist John Rowland, CMT, flagged this technical test as a potential inflection point. Not because the dollar has broken yet — but because what happens next could ripple across markets, from precious metals and equities, to commodities and even crypto.
Why the 98 Level on the Dollar Index Matters So Much
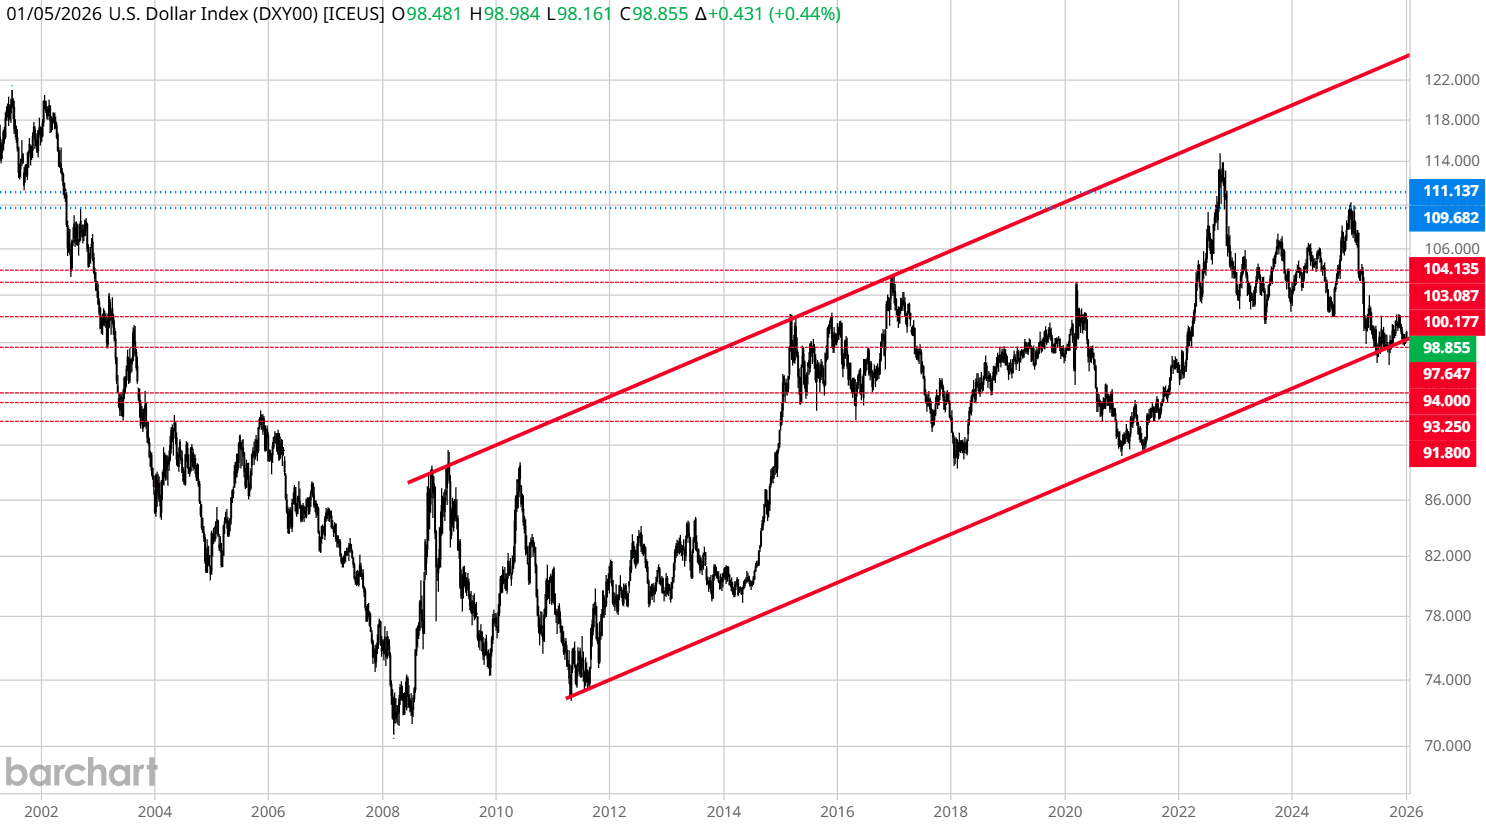
The dollar index has been riding a long-term support trendline dating back to 2011–2012. That’s roughly 14 years of buyers stepping in at the same structural zone. The chart below clearly highlights this trendline channel.
Each test of this support has historically coincided with either:
- Stabilization in the dollar; or
- A sharp macro shift when the level failed
As of early January 2026, DXY has moved back into that danger zone, hovering just above 98 after months of downside pressure.
John’s point on the livestream was clear: If the dollar fails to hold 98 on a multi-week closing basis, the next technical range doesn’t show meaningful support until roughly 94–92.
That’s not a small move. That’s a regime-level shift.
Why the Dollar Weakness is Showing Up in Metals First
Markets tend to move ahead of narratives. Right now, precious metals appear to be sniffing something out.
Gold entered 2026 near all-time highs, while silver has dramatically outperformed — behavior that historically aligns with currency stress and declining confidence in fiat purchasing power.
There’s also a notable divergence at play. Despite elevated geopolitical risk that mirrors prior episodes where the dollar would normally catch a safe-haven bid, the currency has failed to mount a sustained rally.
That divergence matters. When the dollar struggles to rise during uncertainty, it often signals that capital is rotating away from currency exposure and toward real assets.
Macro Forces Pressuring the Dollar
Beyond the chart itself, several macro undercurrents help explain why this support test is happening now – including competition from other currencies, like the Japanese yen.
Interest-rate expectations have also shifted meaningfully. Futures markets are increasingly pricing in a pause or easing bias from the Federal Reserve in early 2026, reducing the yield advantage that previously supported the dollar.
At the same time, central bank diversification trends remain intact. Data from late 2025 showed continued accumulation of gold reserves by global central banks, while exposure to U.S. Treasuries declined relative to historical norms. That doesn’t collapse the dollar overnight, but it does erode long-term demand at the margins.
Markets don’t break because of one reason. They break when technical pressure and fundamental drift line up.
If the Dollar Breaks, What Typically Benefits?
A sustained move below long-term dollar support has historically favored assets priced against the dollar.
That includes:
- Precious metals – Gold and silver tend to respond first
- Commodity producers – Pricing power improves as the dollar weakens
- Multinational equities – Foreign revenues translate more favorably
- Risk assets broadly – Liquidity conditions often loosen
This is why John framed the setup as bullish for metals and supportive for assets overall, even though it would clearly be bearish for the dollar itself.
Key Symbols Traders Are Watching Right Now
If you’re tracking this theme on Barchart, these are some of the most commonly watched assets and investments tied to dollar weakness:
Dollar / FX
Precious Metals
Miners
- GDX / GDXJ – Gold miners / junior miners
- SIL / SILJ – Silver miners / junior silver miners
- XME – Metals & mining ETF
You don’t need to trade all of these assets, but watching how they react relative to DXY gives you early clues about whether the dollar break is gaining traction.
The Dollar’s Line in the Sand
Right now, nothing has “broken.” But markets rarely ring an alarm when they’re about to change character.
The dollar is sitting on a 14-year line of defense. If it holds, metals may consolidate. If it fails, the next few months could look very different from the last few years.
That’s why this clip matters — not as a prediction, but as a roadmap. Because when a level this well-established finally gives way, the move that follows is rarely quiet.
Watch this quick clip on the dollar index:
👉 Stream the full episode of Market on Close
👉 Monitor metals and miners for confirmation with tools on Barchart
On the date of publication, Barchart Insights did not have (either directly or indirectly) positions in any of the securities mentioned in this article. All information and data in this article is solely for informational purposes. For more information please view the Barchart Disclosure Policy here.
More news from Barchart


