

Streaming giant Netflix, Inc. (NFLX) is set to post its fourth-quarter results tomorrow on January 23, 2024. In the last reported quarter, the company’s profit topped expectations, with an EPS of $3.73 versus $3.49 per share expected, while its top line of $8.54 billion aligned with analyst expectations.
The company is still exhibiting pricing power in the streaming market, seeking higher profitability amid high operating costs. NFLX raised its basic plan price by $2 and premium plan price by $3 while keeping its ad-tier pricing the same.
Furthermore, Variety magazine reported that NFLX’s ad tier had reached 23 million active users per month globally. Its advertising chief Amy Reinhard said, “Of Netflix's customers on ad-supported plans, 85% of are streaming on the platform for more than two hours per day.”
Given this backdrop, let’s look at the trends of NFLX’s key financial trends to understand why it could be wise to invest in the stock now.
Analyzing Netflix, Inc.'s Financial Performance and Trends from 2021 to 2023
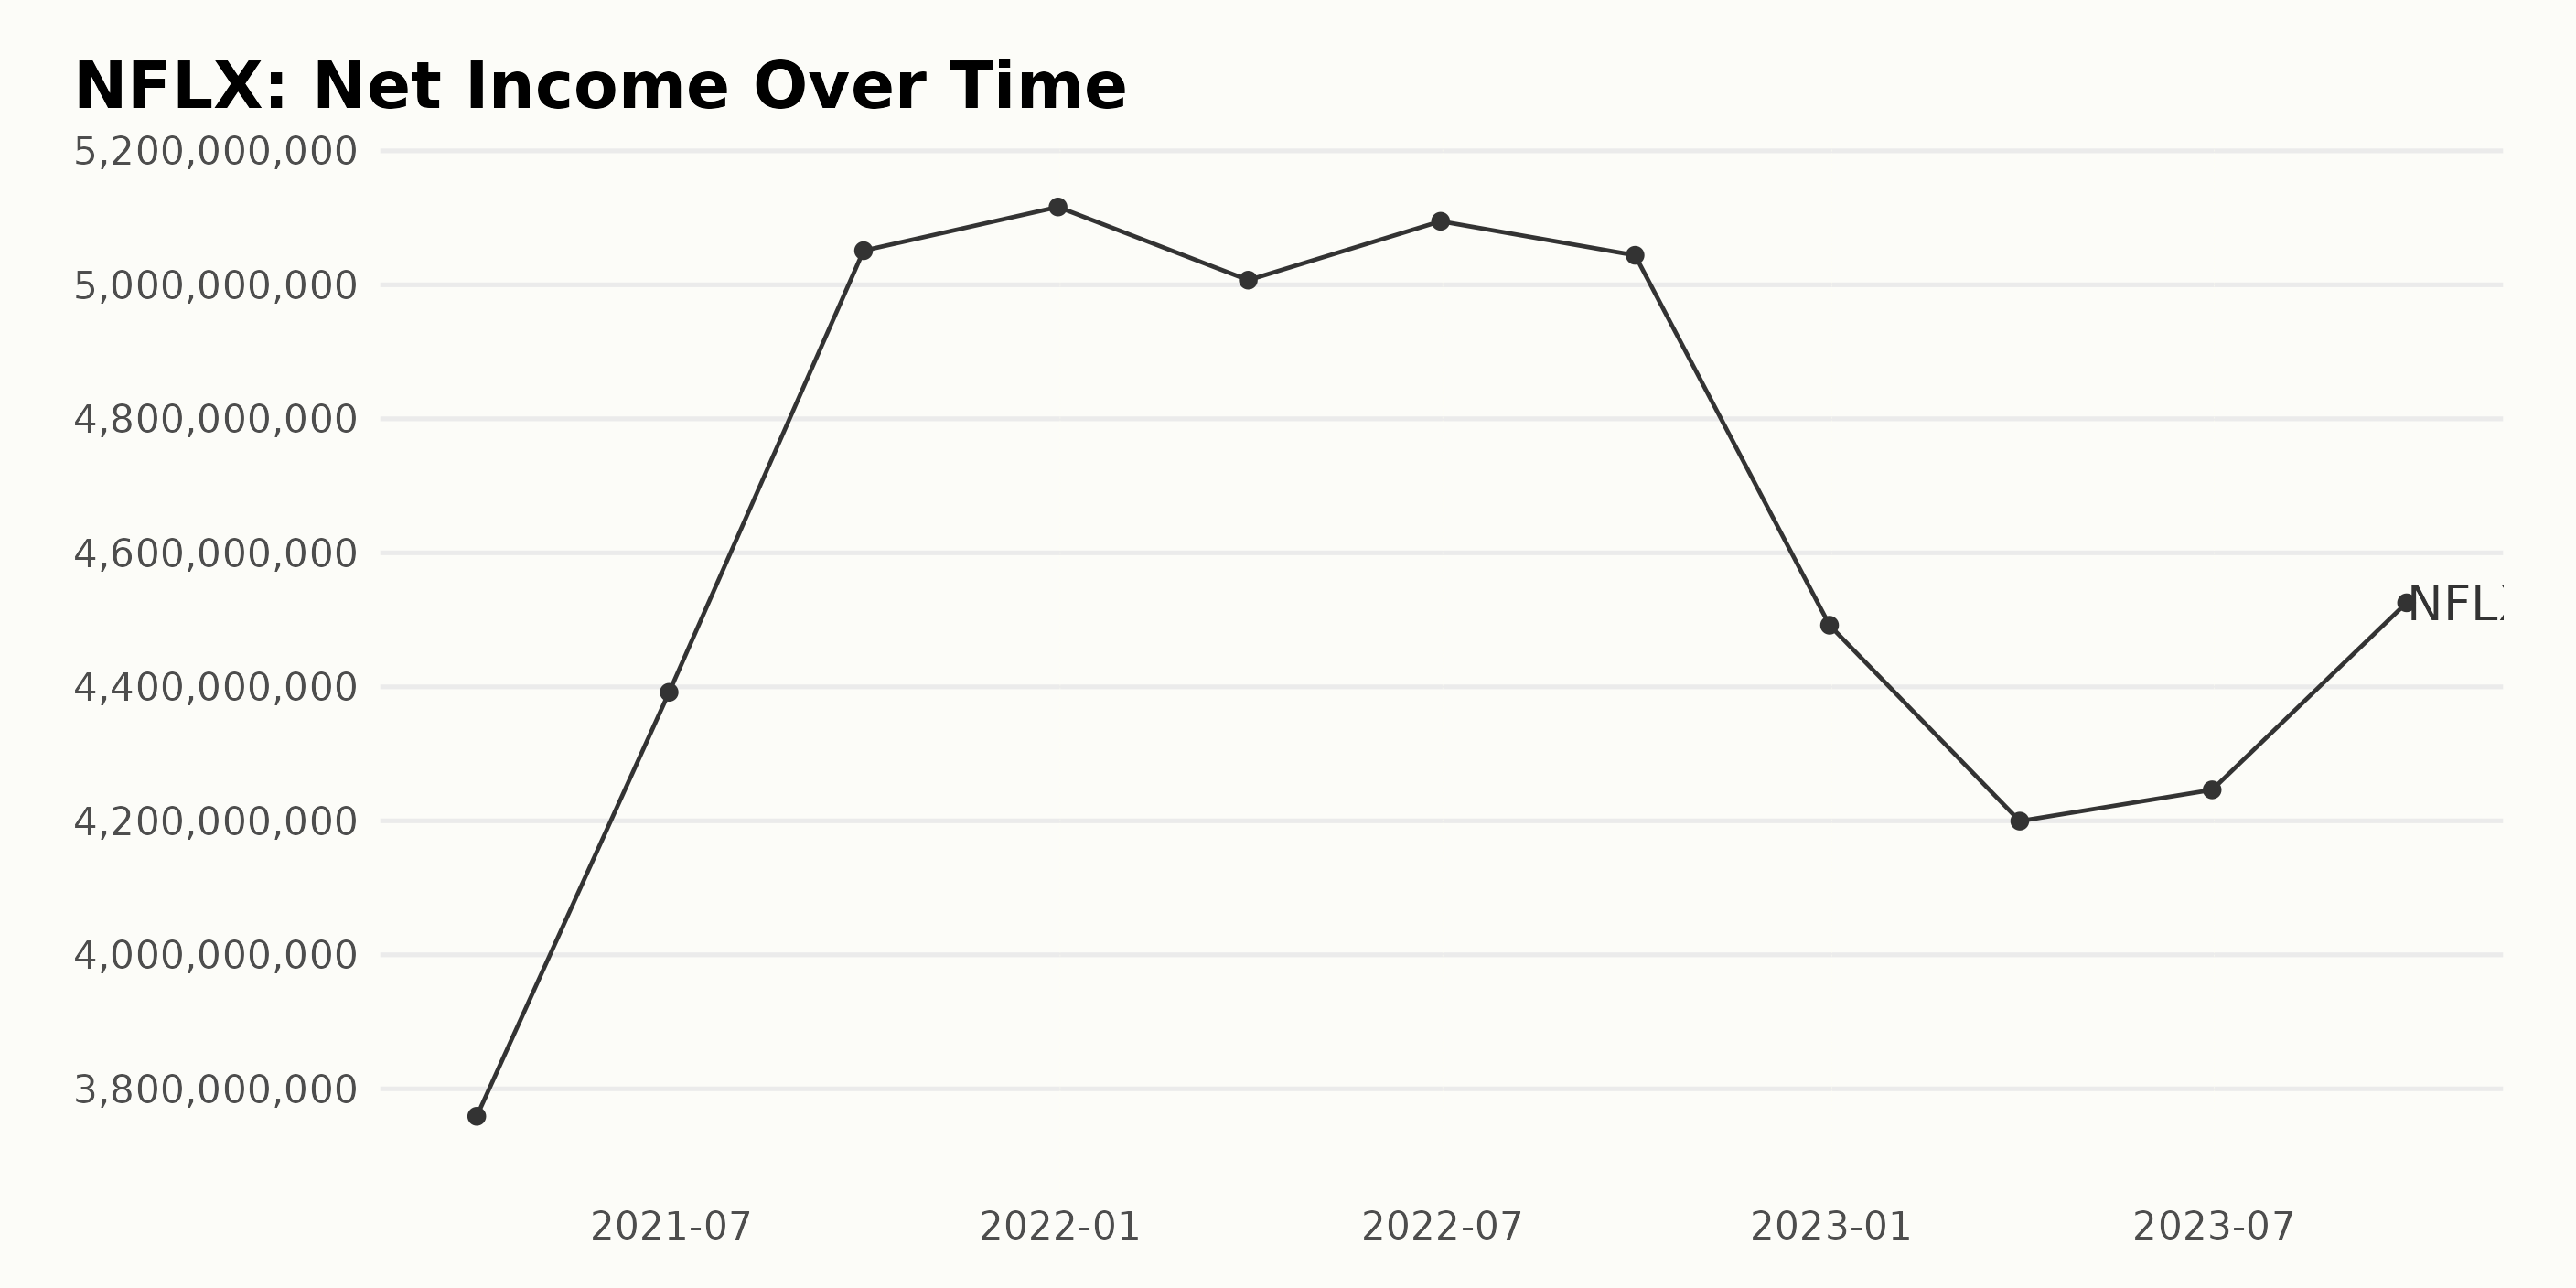
The trailing-12-month net income of NFLX showed distinct trends and fluctuations for the period from March 2021 to September 2023. Trends and Fluctuations:
- Starting at $3.76 billion in March 2021, the net income rose consistently till December 2021, when it peaked at $5.12 billion.
- In the first quarter of 2022, there was a slight drop to $5 billion. It further hovered around $5 - $5.1 billion till the third quarter of 2022.
- There was a significant drop at the end of 2022, with the net income falling to $4.49 billion.
- The downward trend continued in the first half of 2023, with the net income reaching as low as $4.2 billion in March 2023.
- A reversal was observed from June 2023, climbing back up to $4.53 billion in September 2023, close to its December 2022 figure.
Growth Rate: From the perspective of growth rate, the company's net income over the period, calculated from the first value to the last, has seen an upward revision of approximately 20%.
In conclusion, despite spots of volatility, particularly toward the end of 2022 and early 2023, the overall trend for net income remains positive. The more recent data since mid-2023 shows a promising uptick despite previous downswings.
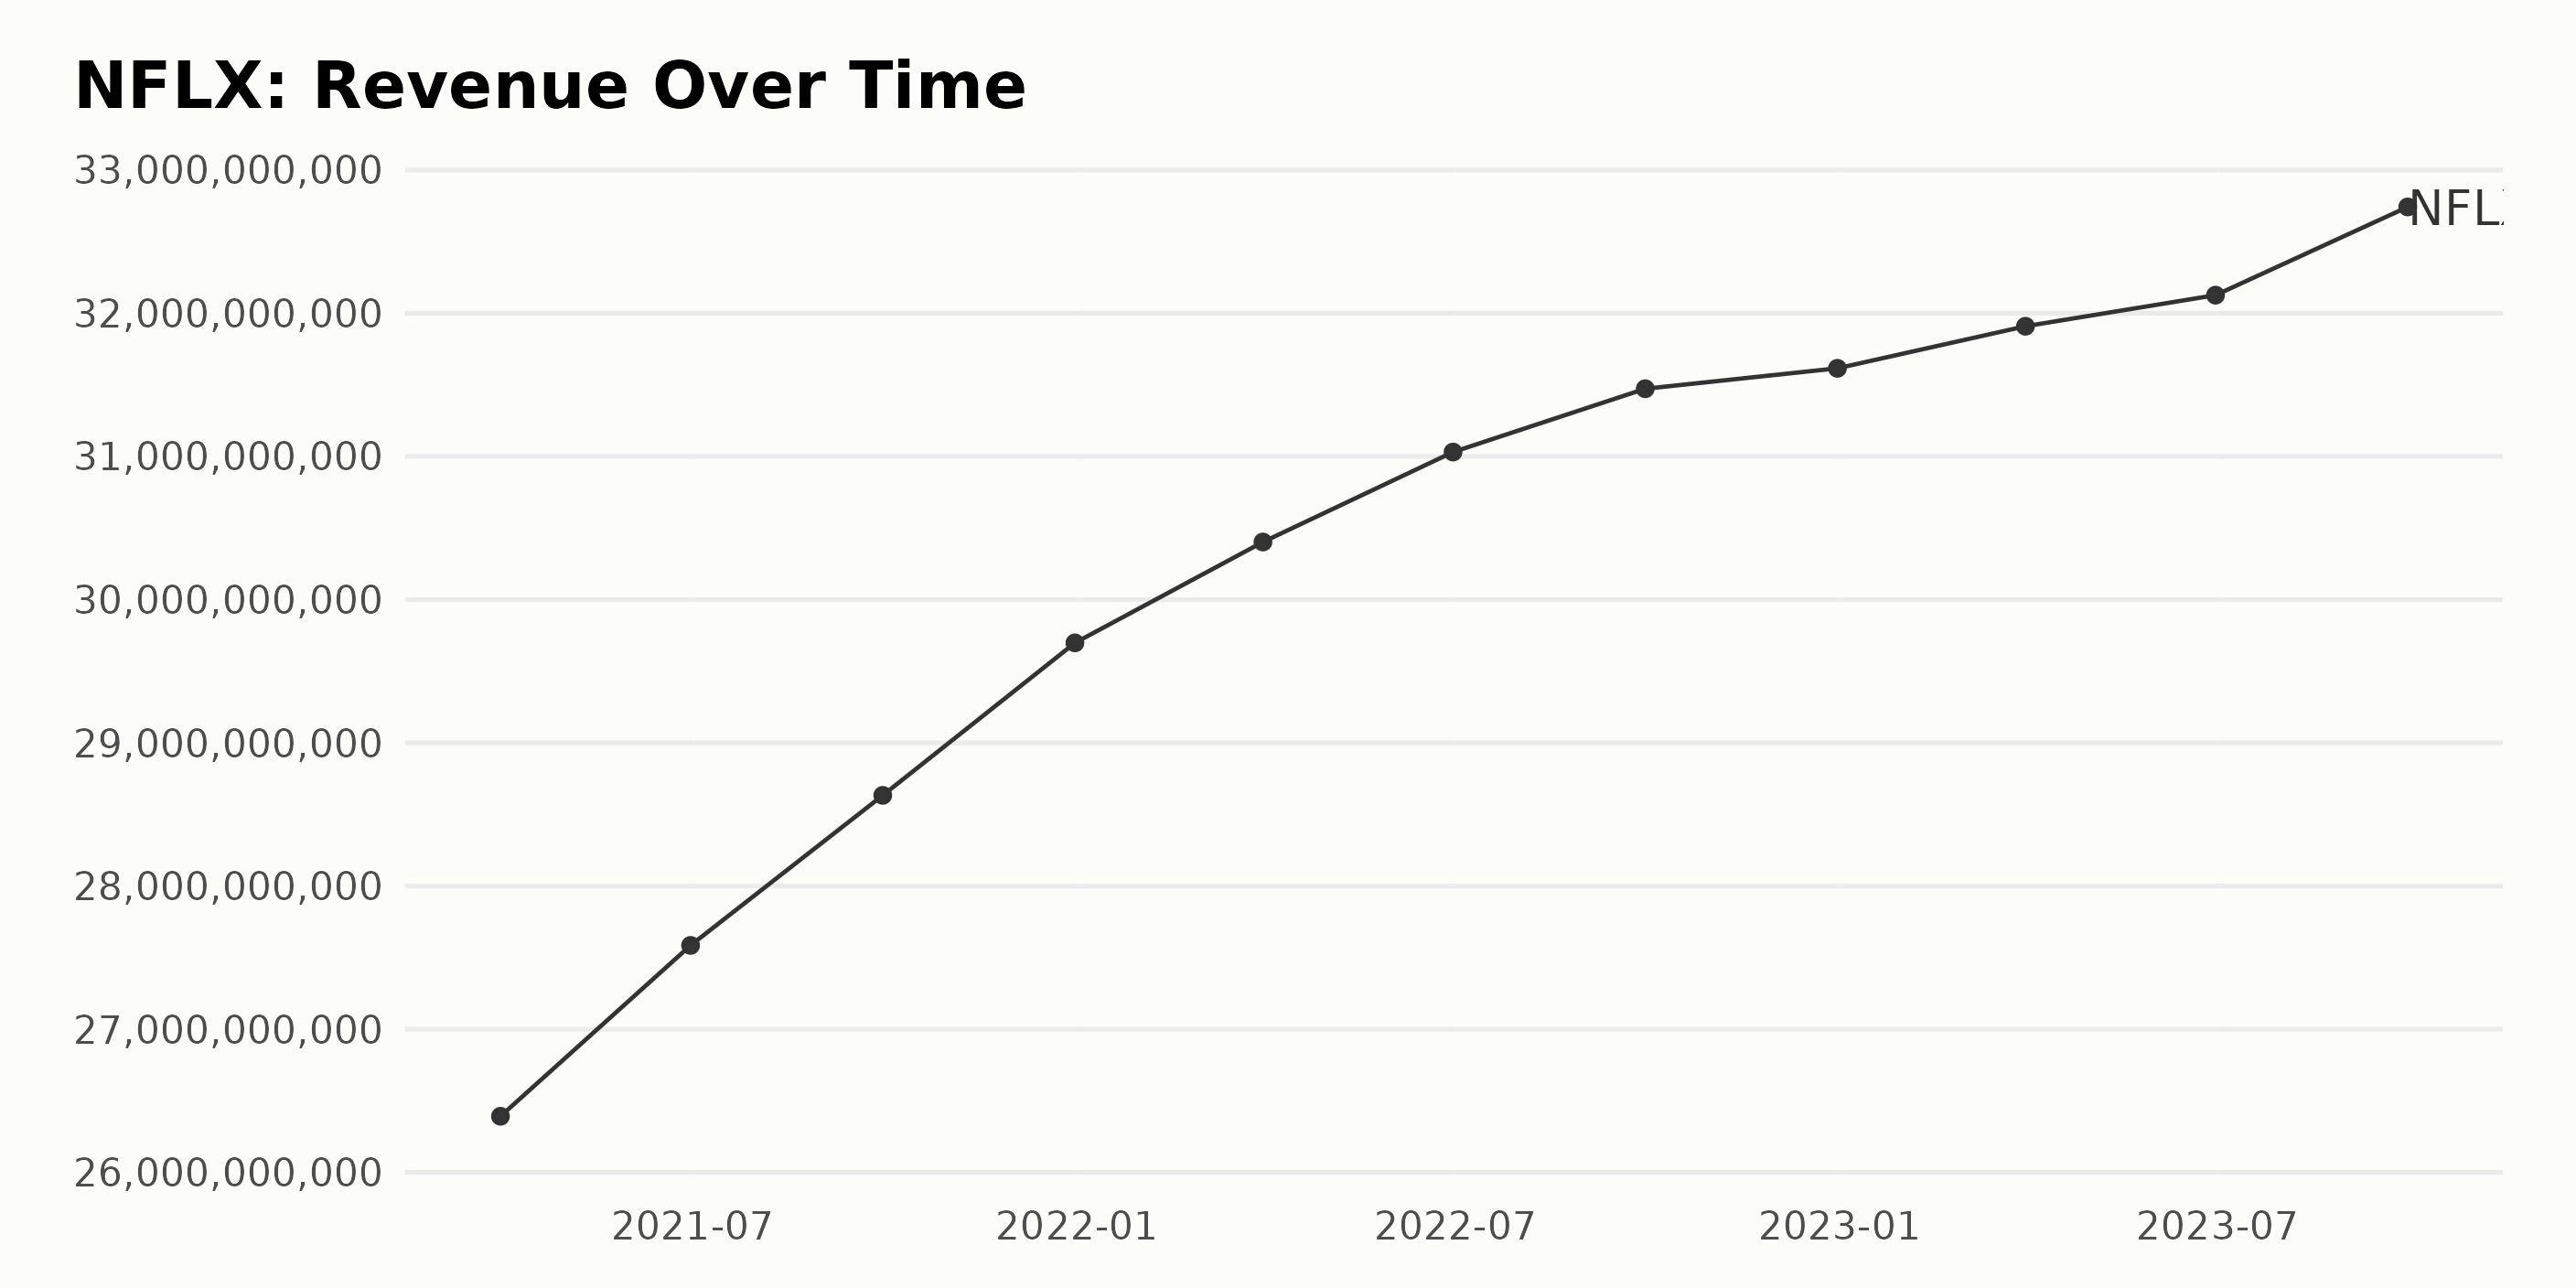
After analyzing the reported trailing-12-month revenue data for NFLX, several patterns and fluctuations are discernible:
- Beginning in March 2021, with revenue recorded at $26.39 billion, there was a steady increase over the period ending in September 2023, when the revenue reached $32.74 billion.
- More recently, between December 2022 ($31.62 billion) and September 2023 ($32.74 billion), revenue grew by approximately $1.12 billion, reflecting a stronger upward trend in recent quarters.
- Notably, there were periods of slight fluctuation in the rate of growth. The most significant of these occurred between September 2022 ($31.47 billion) and December 2022 ($31.62 billion), where growth slowed considerably.
- However, growth picked up again in the first quarter of 2023, with revenue rising to $31.91 billion in March 2023 and continuing on an upward trend till September 2023 ($32.74 billion).
In terms of growth rate, measured from March 2021 to September 2023, NFLX saw an approximately 24% increase in revenue. This analysis clearly signals a positive trend in NFLX's revenue figures, with some evidence of fluctuation in the rate of growth. Overall, however, the company appears to be making consistent progress in terms of growing its revenue.
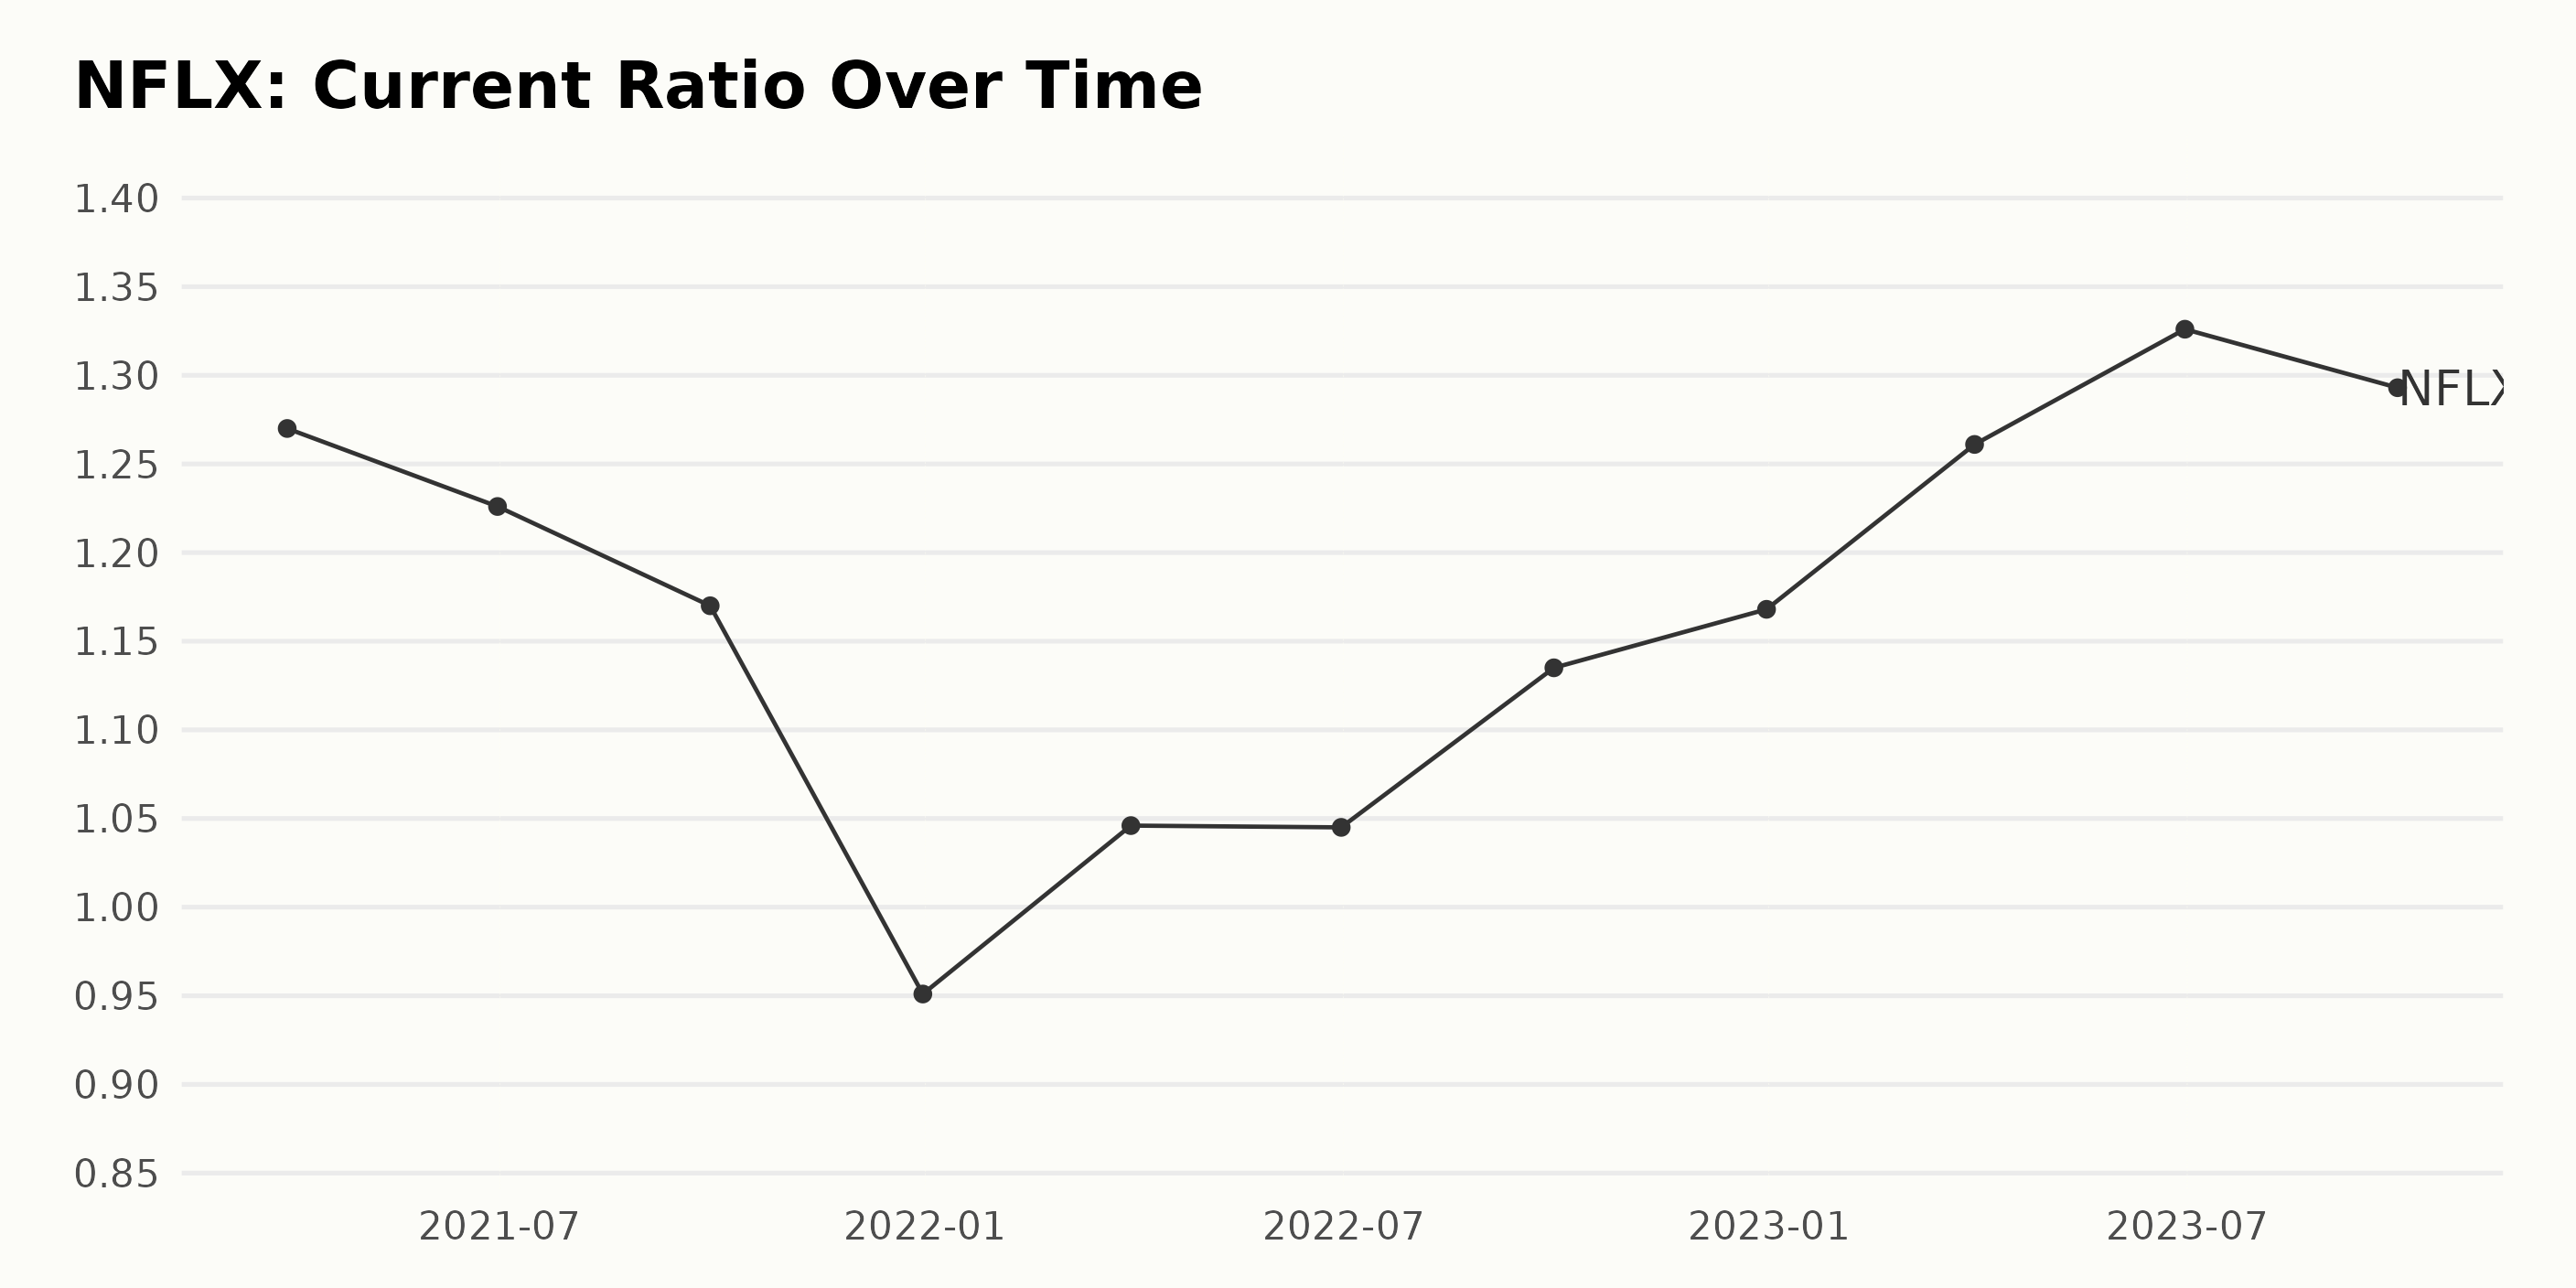
The current ratio of NFLX has seen both upswings and dips over the given timeframe, stretching from March 2021 to September 2023. Here, I outline critical observations:
- In March 2021, NFLX's current ratio stood at 1.27. Following an initial downturn until December 2021, when it reached its lowest value at 0.951, we saw a general upward trend.
- From January 2022 to the end of the provided data in September 2023, the current ratio increased gradually. The latter half of this period (from June 2023) saw minor fluctuations within the range of 1.326 and 1.293.
- As per the most recent data point, September 2023, NFLX's current ratio is currently 1.293, a notch lower than its maximum value within this period, which was in June 2023 at 1.326.
- Over the whole series, the current ratio has increased by approximately 2%. This is a fairly moderate growth rate from the initial ratio in March 2021.
As such, despite fluctuations in the interim, the broad trend for NFLX's current ratio from March 2021 through to September 2023 shows an overall increase, with more emphasis on the uptick experienced after December 2021.
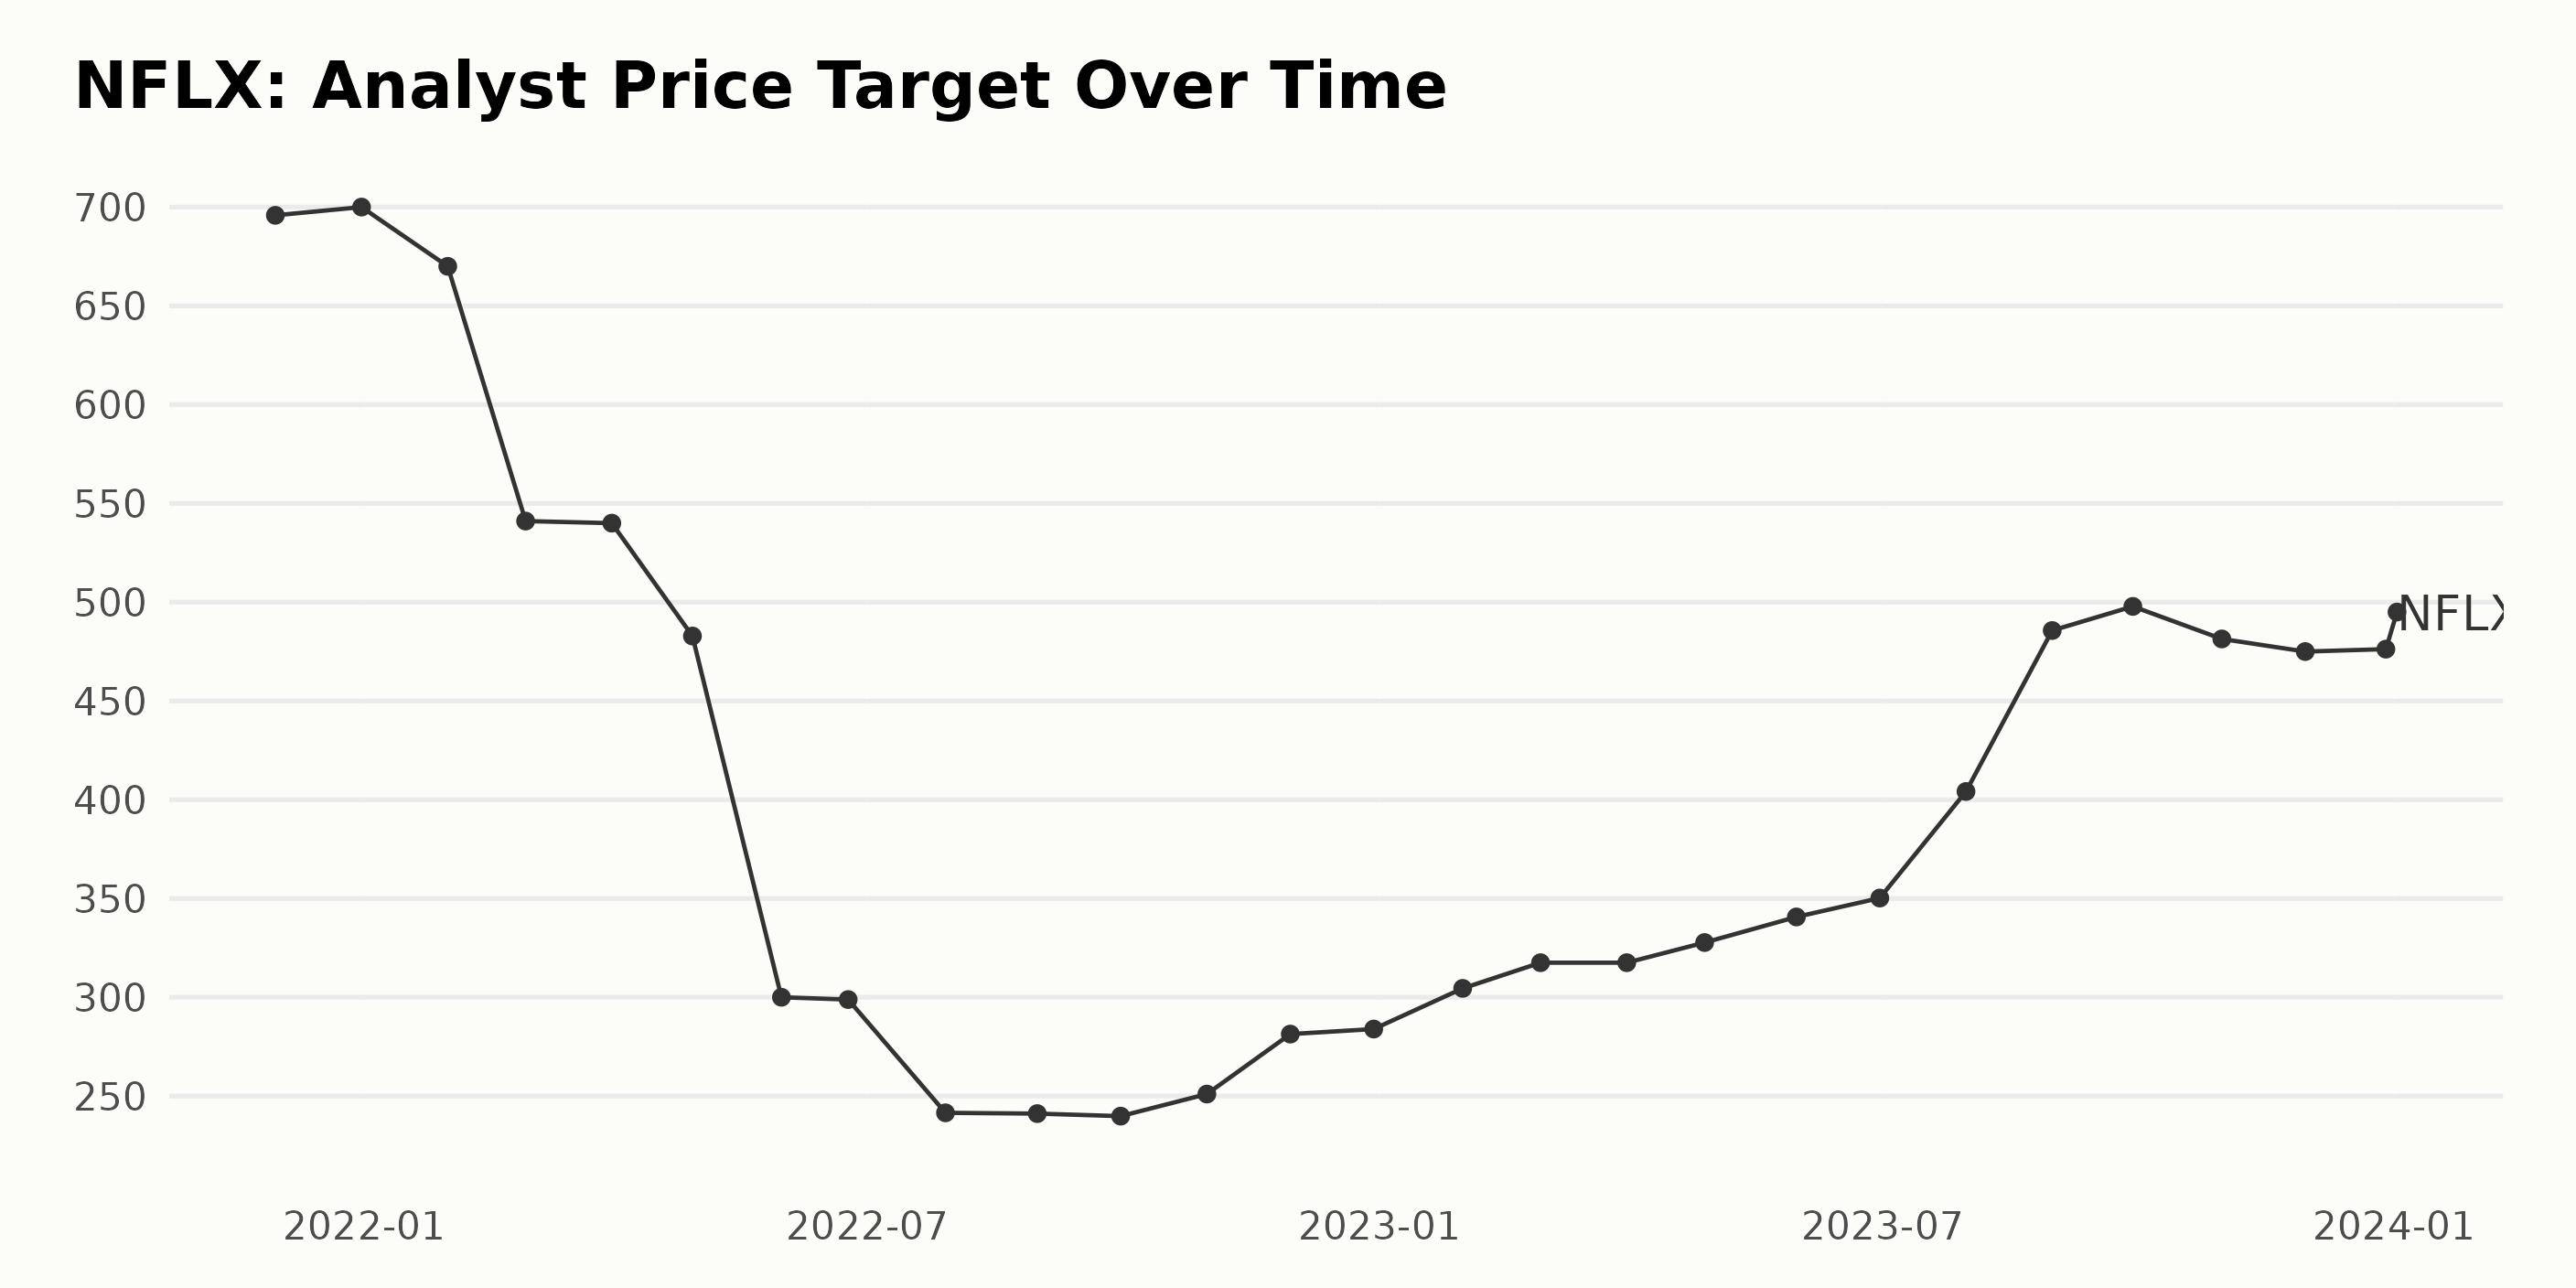
The analyst price target for NFLX has experienced significant fluctuations over time.
- The value started at $695.83 in November 2021 before seeing a slight increase to $700 in December of the same year.
- However, in 2022, the price target experienced a downward trend, dropping to $670 in January and continuing to decrease sharply to a low of $239.82 by September.
- Despite the steep fall, the price target began to recover towards the end of 2022, with the value rising to $251 in October and then to $283.91 by December.
- In 2023, this upward trend was maintained, with the price progressively increasing from $304.5 in January to $497.86 in September.
- There was a temporary dip to $481.39 in October 2023, but it resurged slightly to $476.23 in December.
- The most recent data point in January 2024 shows the price target at a significantly improved $495.
Assessing only the first and last values, the price target still shows a decrease from $695.83 to $495. Given the fluctuation over the years, it's noteworthy that the lowest point was overshot during the recovery phase in 2023. It implies an upward trend in more recent periods.
A Comprehensive Review of NFLX Share Price Trends: July 2023-January 2024
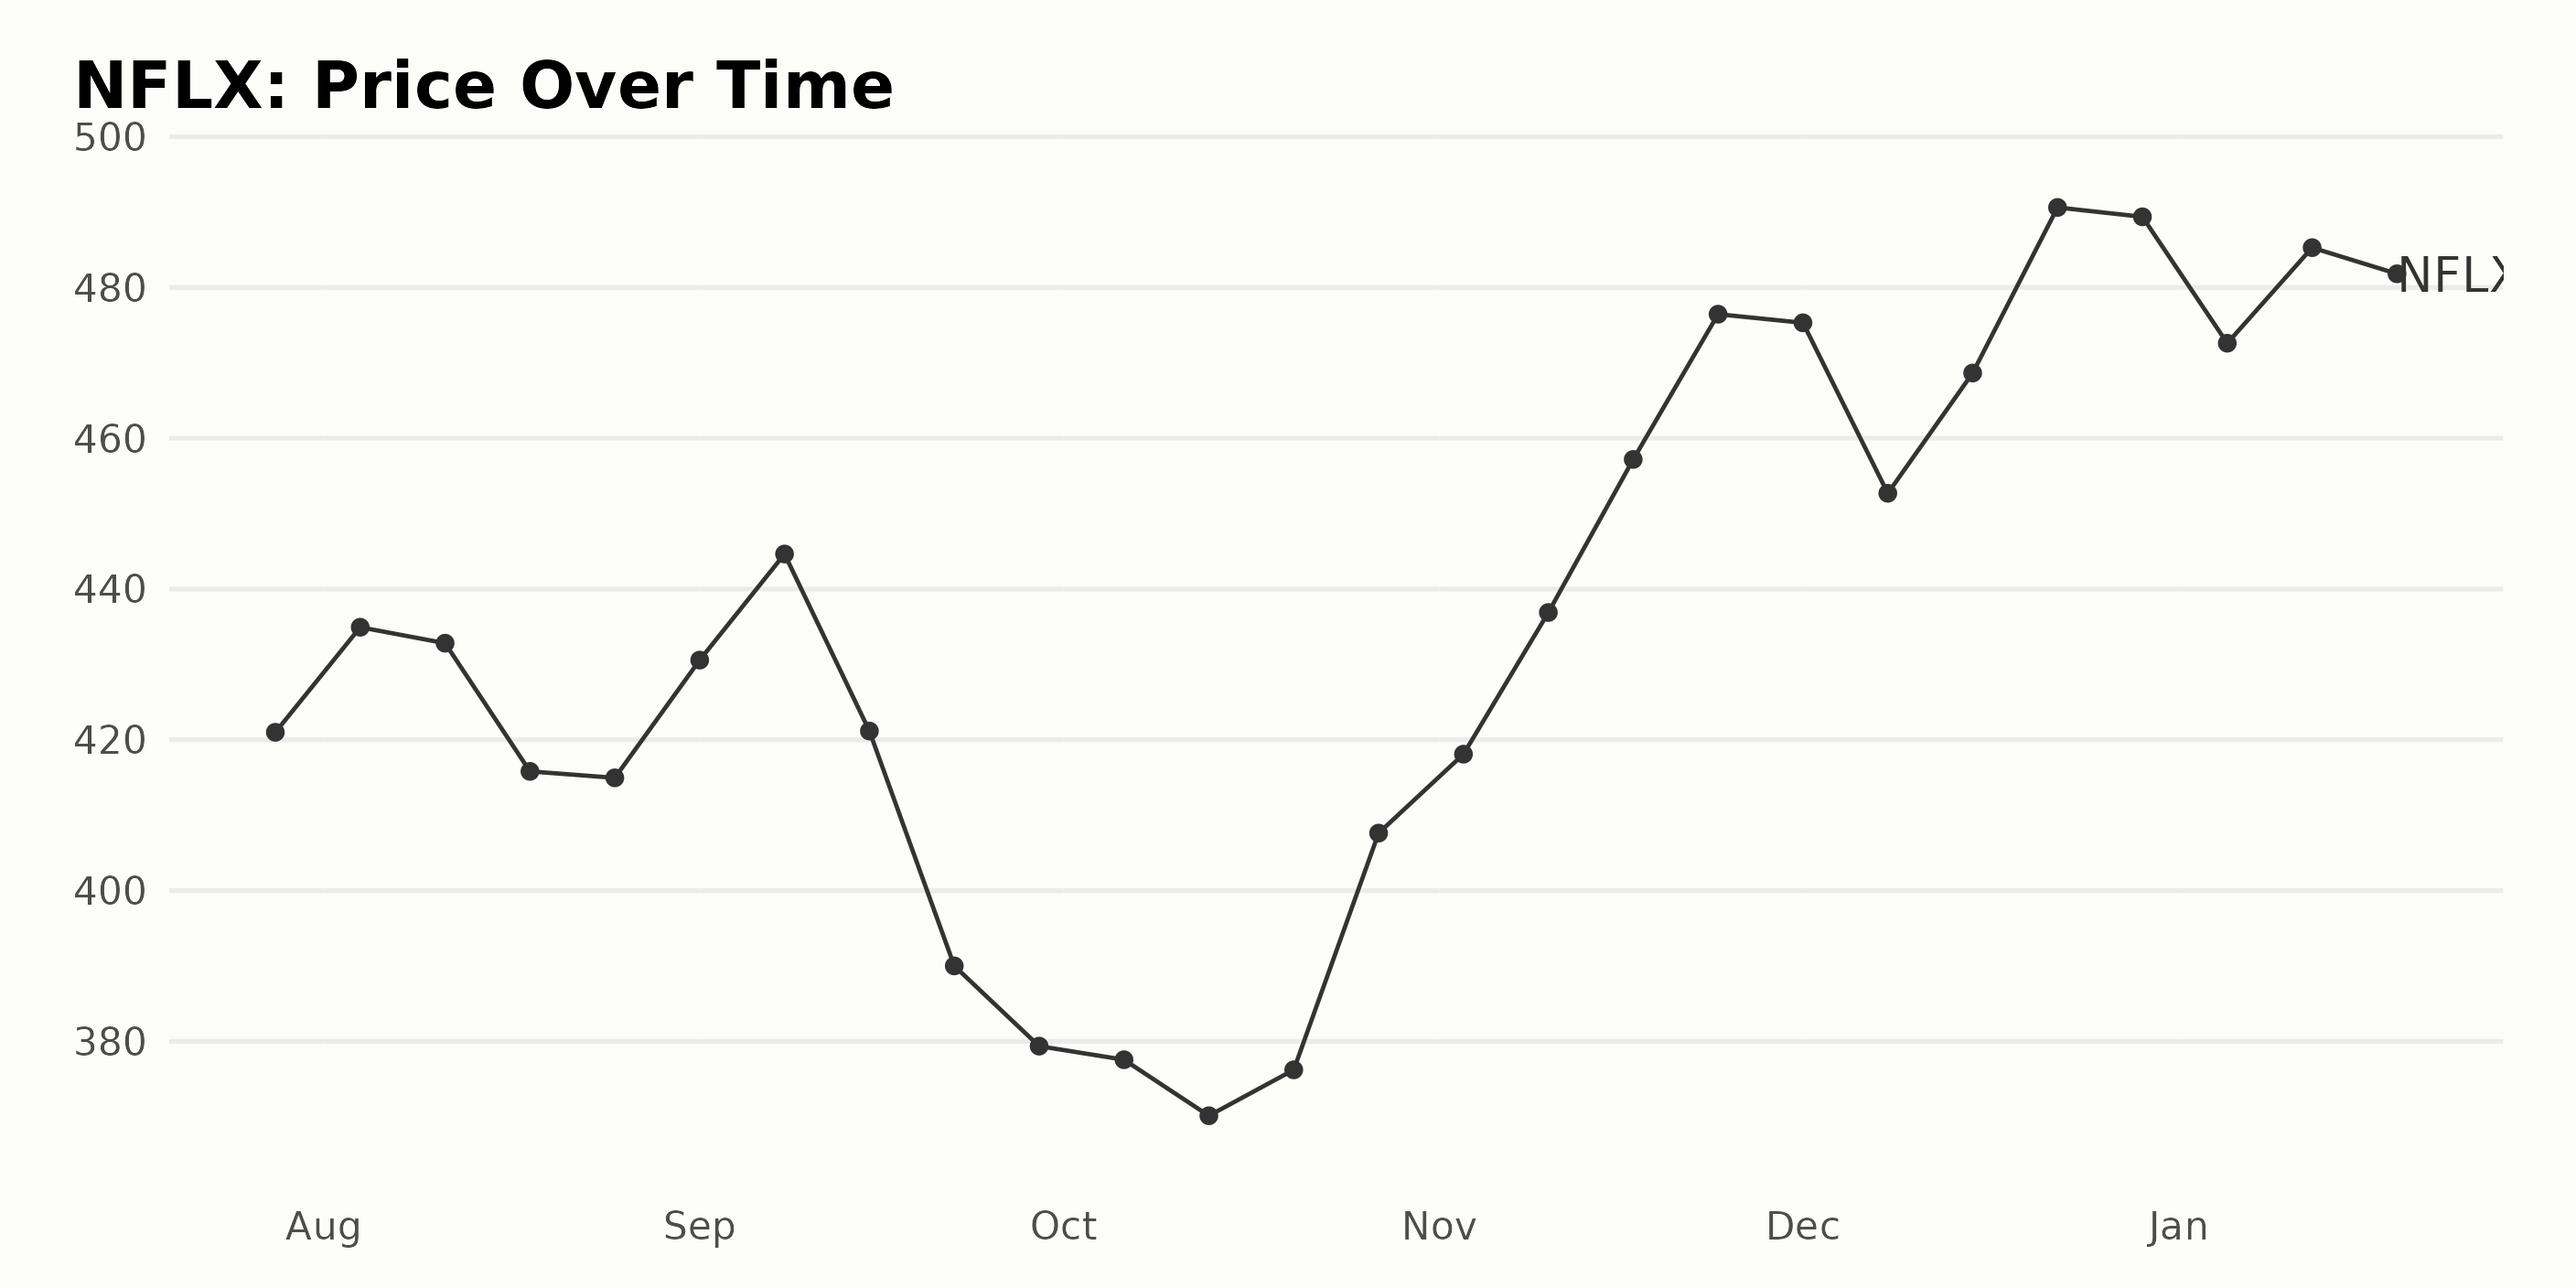
Looking at the provided data, we can observe the following trend and growth rate for NFLX share price from July 2023 to January 2024.
- On July 28, 2023, the share price of NFLX was at $421.00.
- There is a slight increase in August 2023, where it peaked at $434.93 on August 4, 2023, before gradually declining to $414.96 on August 25, 2023.
- The first week of September 2023 saw a rebound where the stock price rose to $430.57. This was followed by a sharp rise to $444.65 on September 8, 2023.
- A post-peak decline occurred from mid-September to early October 2023, with the price dipping to its lowest of $370.14 on October 13, 2023.
- From mid-October to late November 2023, there's a strong upward trend, where the share price surged from $376.23 on October 20, 2023, to reach a new high of $476.45 on November 24, 2023, indicating an accelerating trend during this period.
- Heading into December 2023, the trend continues upward, reaching the high for the year at $490.61 on December 22, 2023.
- The first weeks of January 2024 show a decelerating trend, with a decline from the December 2023 high. The share price decreased to $472.60 on January 5, 2024, stabilizing slightly higher at $485.28 on January 12, 2024, before slipping slightly to $482.95 on January 19, 2024.
In summary, despite fluctuations during the months studied, the general trend of NFLX share price shows growth from July 2023 to January 2024. The period from mid-October to December 2023 had shown a particularly strong and accelerating upward trend. The beginning of the new year in 2024 marked a deceleration with a slight decrease in share prices. Here is a chart of NFLX's price over the past 180 days.
Dissecting Netflix Inc.'s POWR Ratings: Quality, Growth, and Momentum Trends Analysis
Based on the provided data, the POWR Ratings grade of NFLX has shown a trend of improvement over time. Detailed observations from the data are as follows:
- NFLX held a POWR Grade of C (Neutral) for the majority of the third quarter in 2023. During this period, its rank within the Internet category fluctuated slightly but remained relatively steady, ranging between 16 and 23 out of a total of 54 stocks.
- A significant jump in performance can be observed in late October 2023 as the POWR Grade improved to B (Buy). This improvement was also reflected in the stock's rank within its category, which notably dropped to single digits for the first time.
- The stock maintained the B (Buy) grade till the latest available data in January 2024, demonstrating a sustained performance over time. During this phase, the rank within its category fluctuated between 6 and 10, exhibiting a strong position within the top 20% of Internet category stocks.
- The latest value of the POWR Grade for NFLX, as of January 22, 2024, is B (Buy). It ranks seventh within its category, indicating a robust performance among Internet stocks.
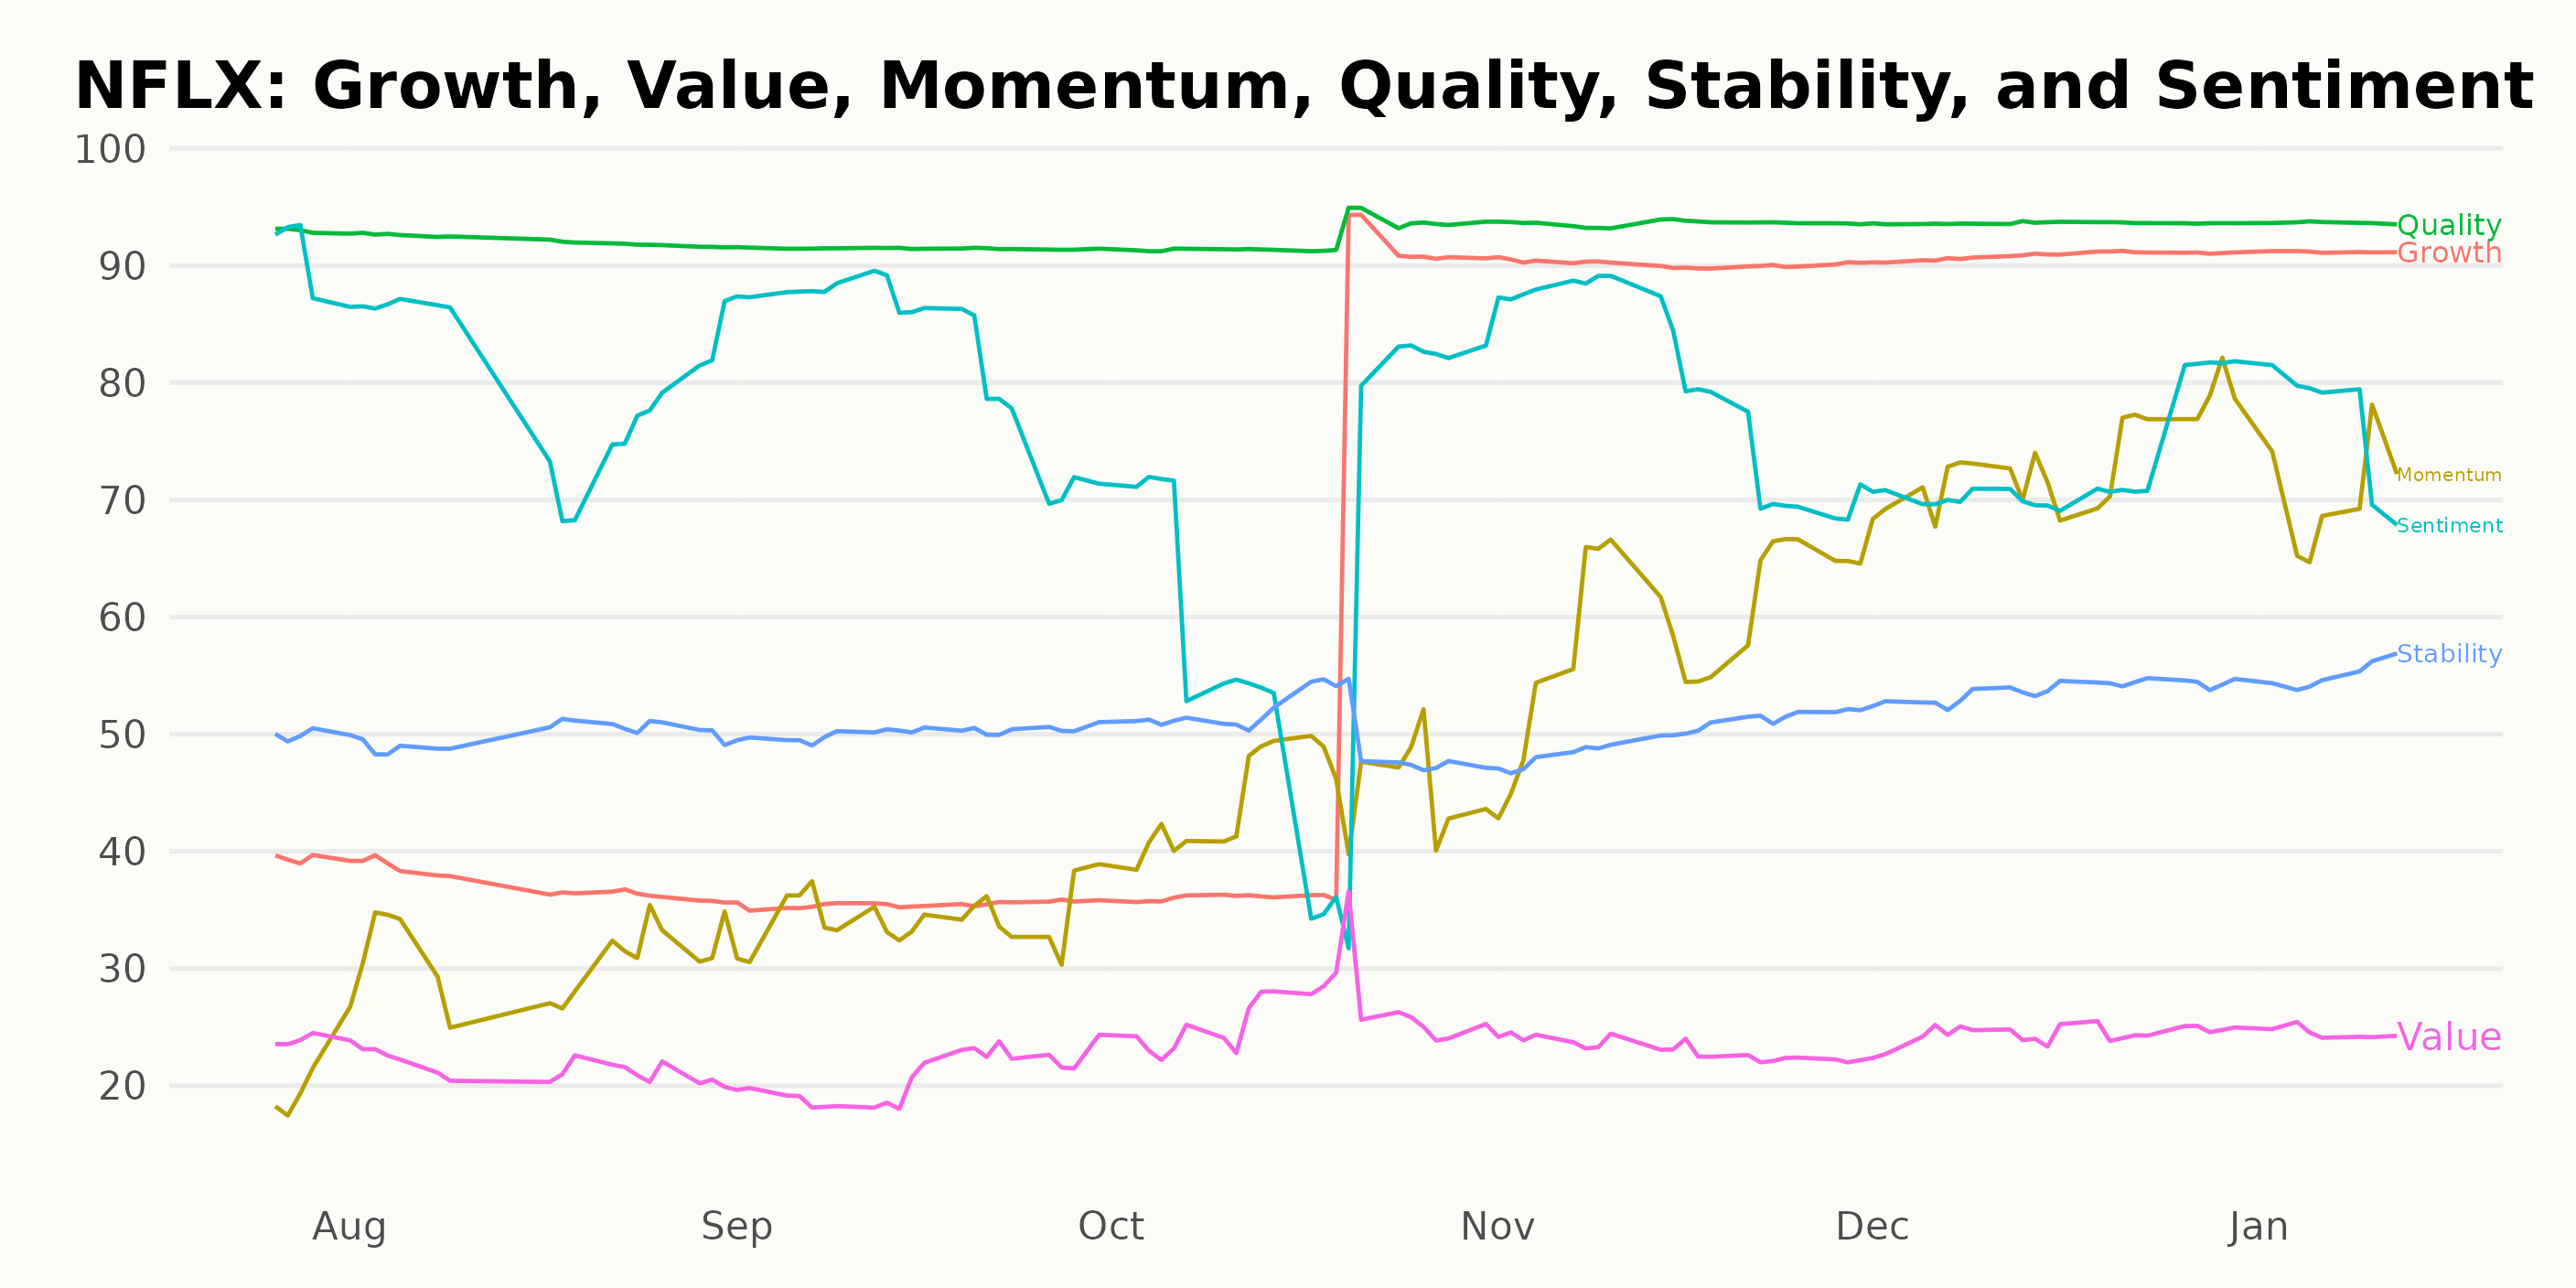
The POWR Ratings for NFLX highlight three standout dimensions: Quality, Growth, and Momentum.
- Quality: This dimension consistently produced the highest ratings for NFLX. It started at 93 in July 2023, dipped slightly to 91 in September 2023, but then increased again, maintaining a strong trend with scores of 92 in October, 94 in November, and remaining at 94 in December 2023 and January 2024. This demonstrates NFLX's high-quality performance over time.
- Growth: NFLX has shown a robust growth trend. Its Growth rating started at 39 in July 2023, reducing in magnitude moderately until September 2023 to a rating of 35. The rating then made a significant jump to 57 in October 2023, followed by a steep increase to 90 in November and 91 in December 2023. It continued this high level into 2024, with a rating of 91 in January.
- Momentum: This dimension shows clear progressive growth, starting with a value of 19 in July 2023. It progressively increased each month, reaching 45 in October 2023, making a significant leap to 59 in November, up to 73 in December 2023, and then rocking a little back to 70 in January 2024.
Overall, these trends highlight NFLX's consistent quality, strong overall growth, and rising momentum during this period.
How does Netflix, Inc. (NFLX) Stack Up Against its Peers?
While NFLX has an overall B (Buy) rating, other stocks in the Internet sector that may be worth considering are Yelp Inc. (YELP), Meta Platforms, Inc. (META), and Travelzoo (TZOO) - they have an overall rating of A (Strong Buy) or B (Buy). Click here to explore more Internet stocks.
What To Do Next?
Discover 10 widely held stocks that our proprietary model shows have tremendous downside potential. Please make sure none of these “death trap” stocks are lurking in your portfolio:
NFLX shares were trading at $486.60 per share on Monday afternoon, up $3.65 (+0.76%). Year-to-date, NFLX has declined -0.06%, versus a 1.81% rise in the benchmark S&P 500 index during the same period.
About the Author: Anushka Dutta

Anushka is an analyst whose interest in understanding the impact of broader economic changes on financial markets motivated her to pursue a career in investment research.
The post Netflix, Inc. (NFLX) Investors Eyeing Strategies Pre-Earnings Release appeared first on StockNews.com