

Electronic brokerage firm Interactive Brokers Group, Inc. (IBKR) is set to report its fourth-quarter earnings tomorrow (January 16). Prior to its earnings report, the company reported its December performance metrics.
IBKR’s Daily Average Revenue Trades (DARTs), which refers to customer orders divided by the number of trading days in the period, came in at 1.972 million, indicating a 13% increase than the prior year and 4% higher than the preceding month. The company also reported 2.56 million client accounts, which is 23% higher than the preceding year and 2% higher than the prior month.
Brokerages conventionally experience higher net interest incomes under high interest rates. After a lengthy rate-hiking regime, the Federal Reserve signaled at least three rate cuts this year. It remains to be seen whether IBKR can tactfully navigate a low interest-rate environment.
Under such circumstances, let’s look at the trends of IBKR’s key financial metrics to understand why it could be wise to wait for a more opportune entry point in the stock.
Interactive Brokers: Comprehensive Review of Financial Metrics from 2021 to 2023
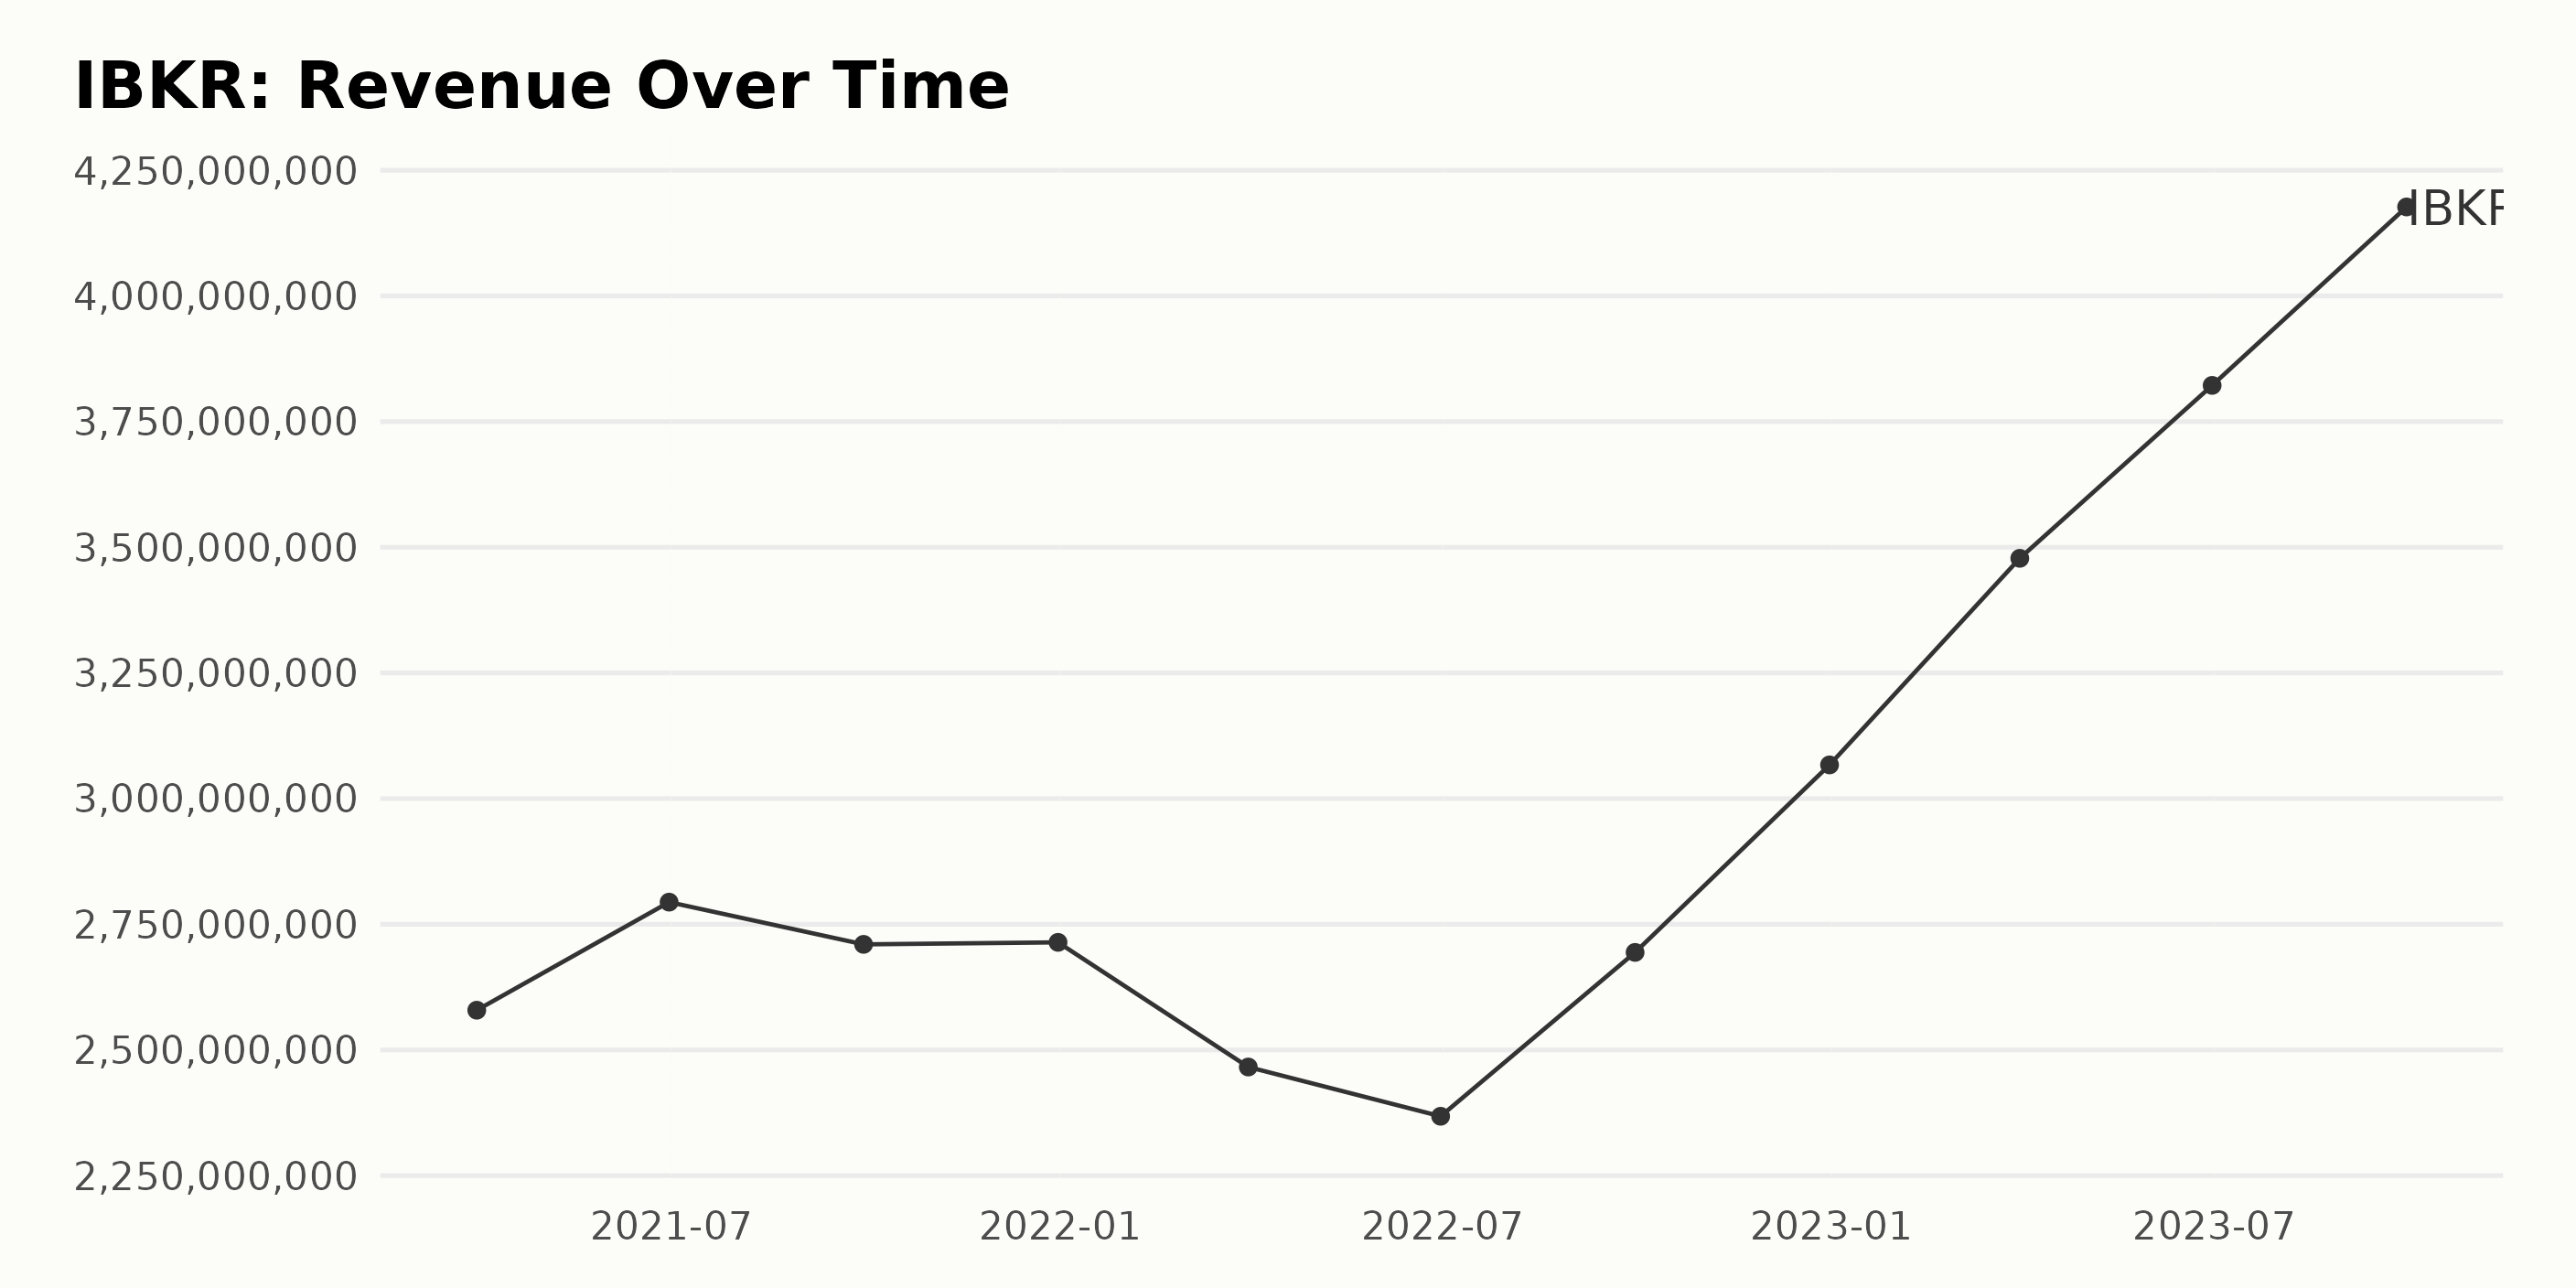
The trailing-12-month revenue for IBKR has generally shown a progressive upward trend from March 2021 to September 2023. Here is a summary of the revenue trend and fluctuations for IBKR:
- As of March 31, 2021, the revenue stood at $2.58 billion. However, by September 30, 2023, this had significantly escalated to $4.18 billion. This represents a remarkable increase in revenue over this timeframe.
- Despite the overall upward trajectory, there were decreases noted in certain periods. For instance, a decline from $2.79 billion in June 2021 to $2.71 billion by September 2021. Another noticeable drop occurred from $2.71 billion in December 2021 to $2.47 billion by March 2022, which dwindled further to $2.37 billion by June 2022.
- The period post-June 2022 marked a return of consistent growth, with values climbing from $2.37 billion to a peak of $4.18 billion in September 2023. This period saw revenues surpassing previous records consistently.
- The most recent quarter, ending on September 30, 2023, saw an impressive revenue of $4.18 billion. This was the highest in the series and showed stronger fiscal performance.
The calculation of the growth rate from the first value to the last indicates a substantial increase of nearly 62%. This percentage demonstrates a strong growth trajectory for IBKR over the surveyed period.
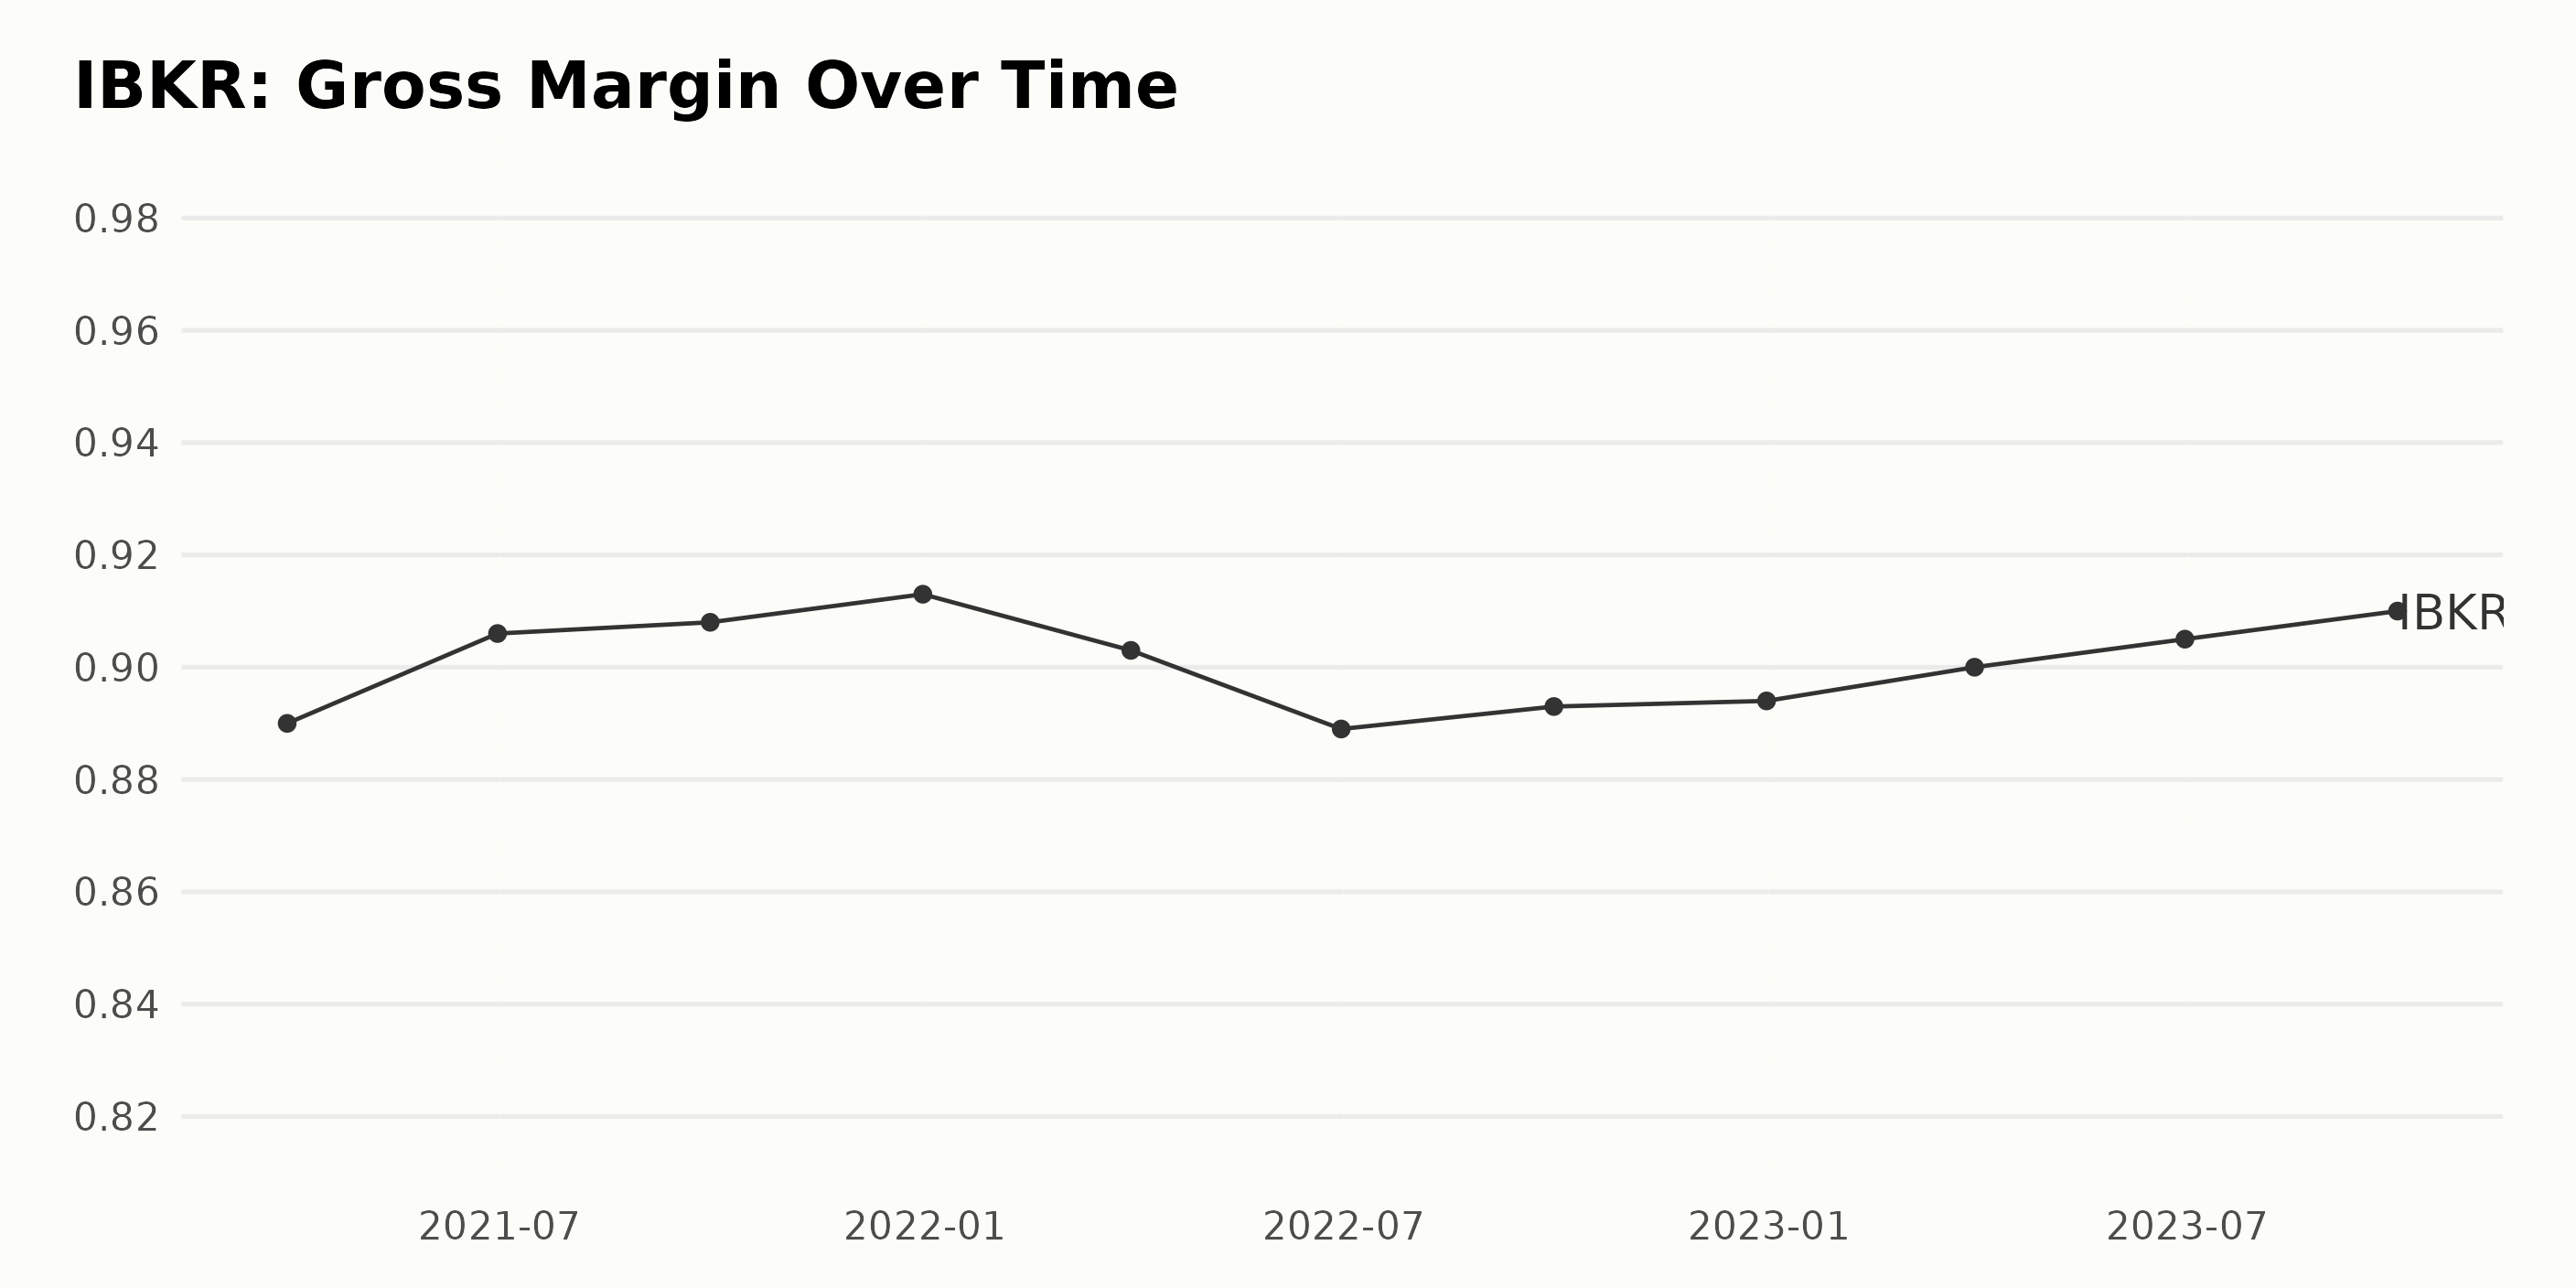
The gross margin of IBKR has shown a fluctuating trend across the specified dates. For ease of understanding, the gross margin has been expressed as a percentage and rounded off to two significant digits. A greater emphasis has been placed on the recent data, along with a calculation of growth rate.
- On March 31, 2021, IBKR's gross margin was 89%
- It then increased to 90.6% by June 30, 2021, marking a positive fluctuation.
- The margin experienced negligible growth, reaching 90.8% by September 30, 2021.
- By the end of 2021 (December 31), it further increased to 91.3%.
- However, there was a decrease in the first quarter of 2022 as the gross margin dropped to 90.3% on March 31.
- A continuous decreasing trend is observed as the margin decreased to 88.9% by June 30, 2022.
- There was a minor increase to 89.3% by September 30, 2022, but still less than the value at the start of the year.
- The margin experienced a minute rise to 89.4% by the end of 2022 (December 31).
- In the first quarter of 2023, there is an increase again as the value reaches 90% on March 31.
- Continuous growth is seen as the gross margin reaches 90.5% by June 30, 2023.
- At the most recent measurement, on September 30, 2023, the margin has reached 91%, depicting a positive fluctuation from the start of the year.
In terms of growth rate, there is an overall increase of 2% from the initial value on March 31, 2021, to the final one on September 30, 2023. The fluctuations indicate a shifting and volatile trend for IBKR’s gross margin over this period. It seems the company experienced both high and low phases in this time frame, with minor improvements being more frequent in recent data.
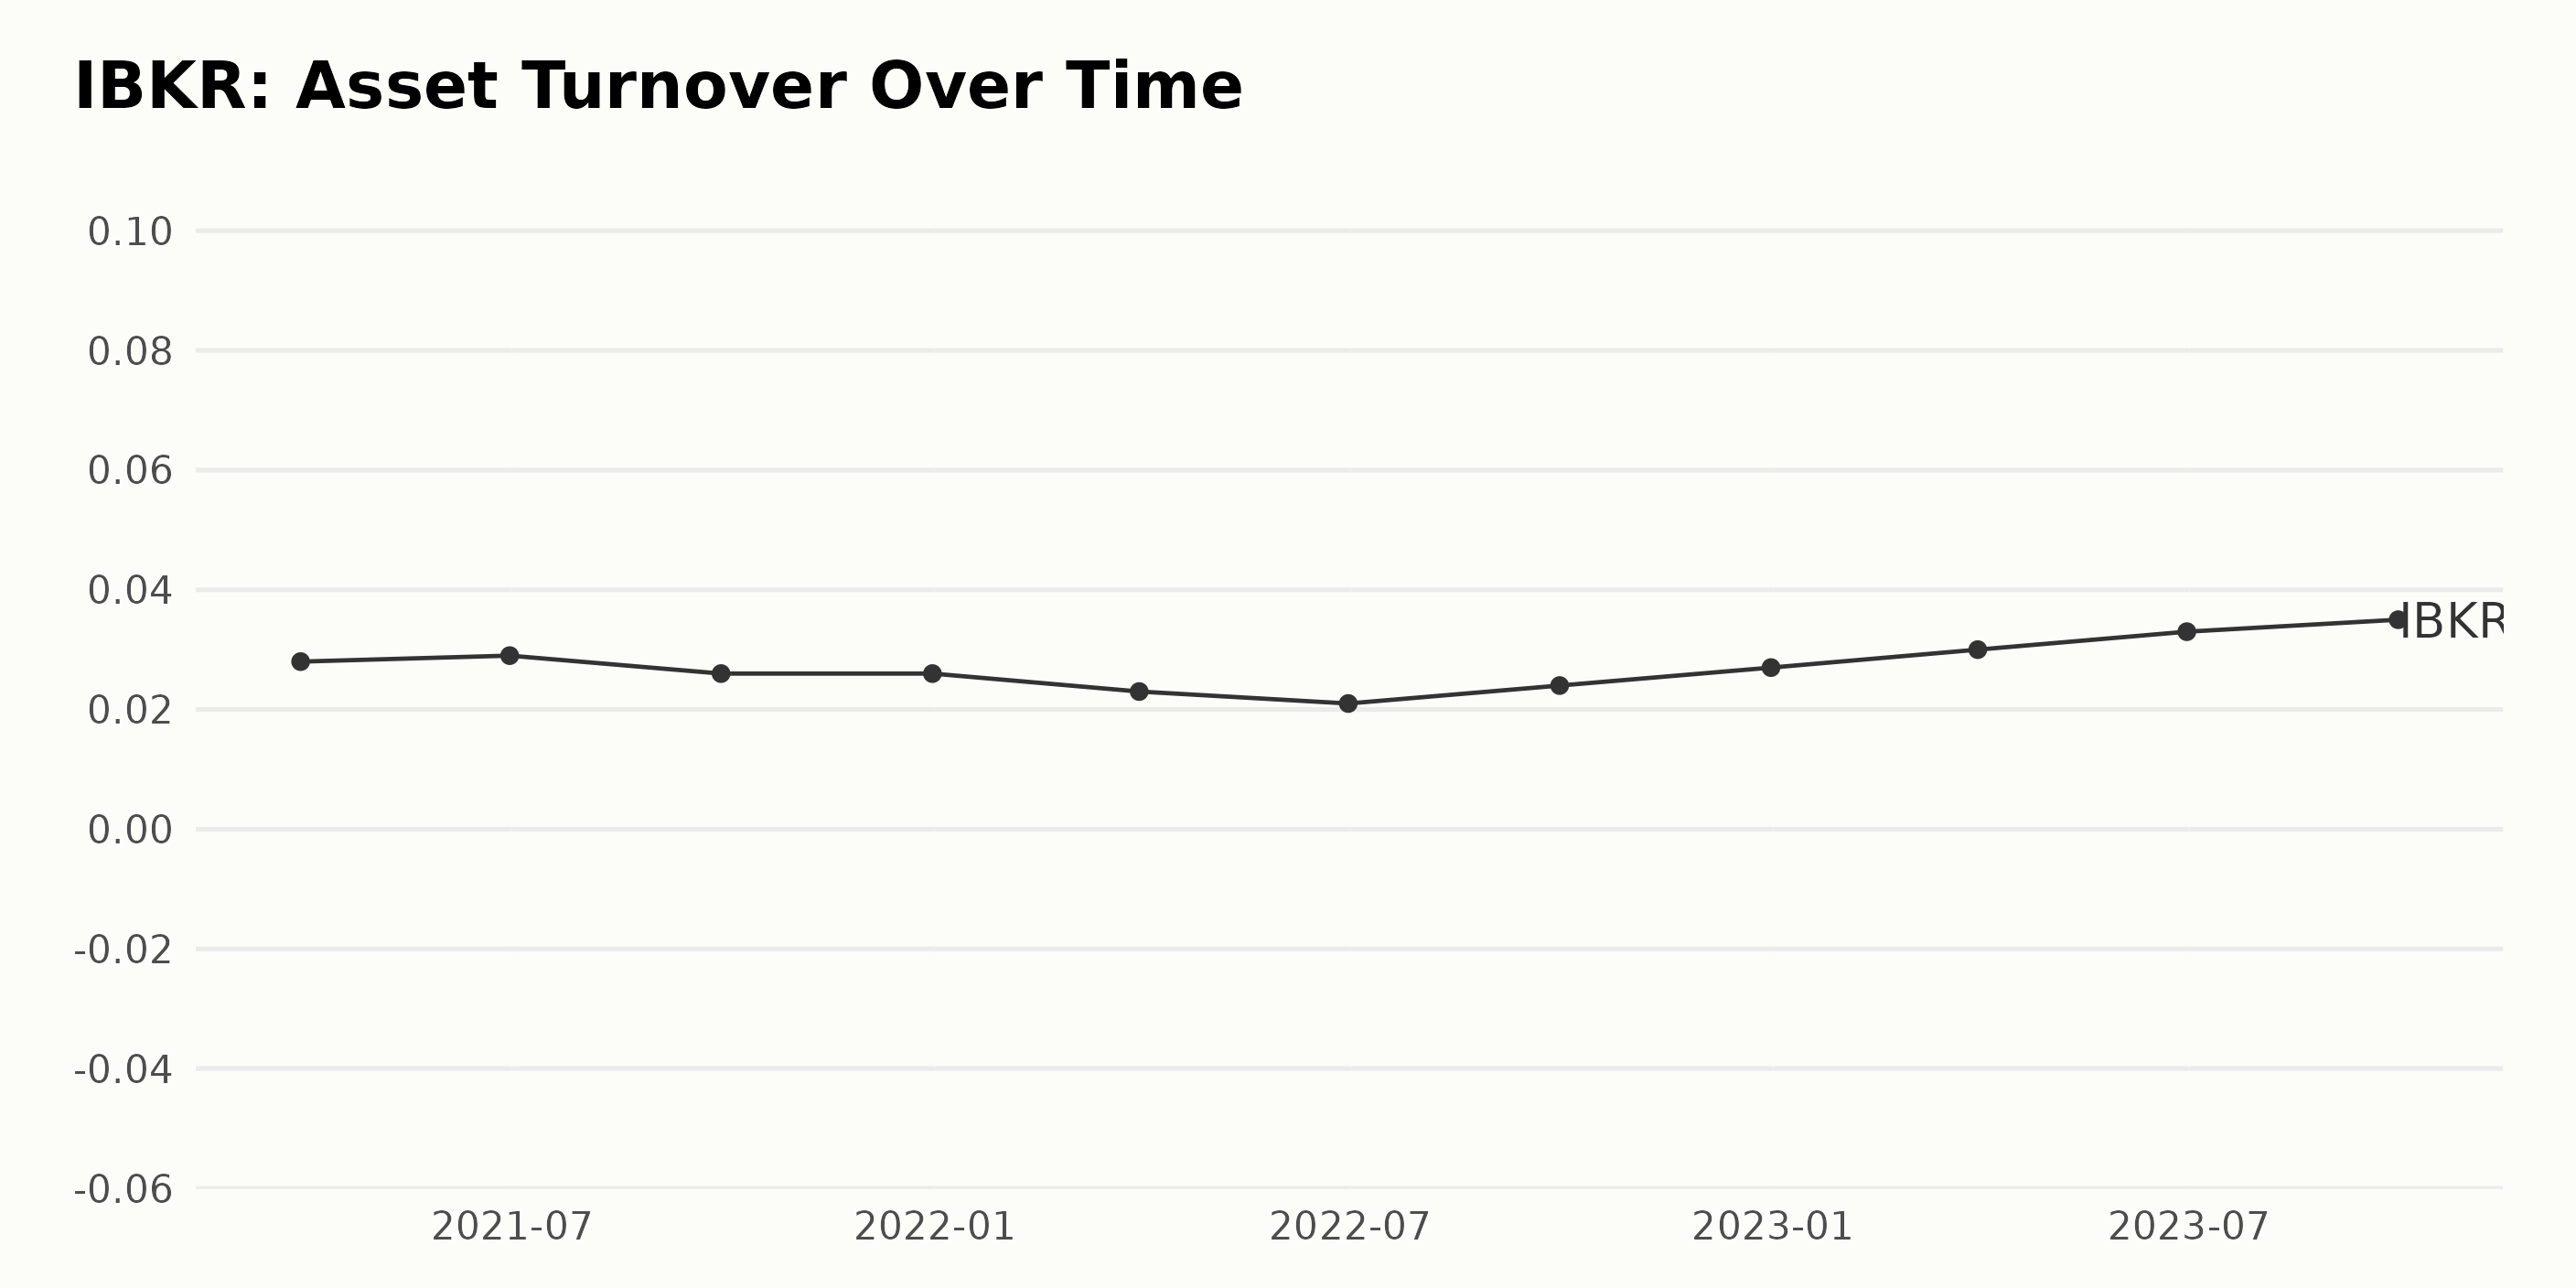
The asset turnover of IBKR has seen a fluctuating, moderately increasing trend during the period from March 2021 to September 2023, based on the data series. Here's a breakdown:
- Starting at 0.028 in March 2021, the asset turnover slightly increased to 0.029 by June 2021.
- There was a slight dip to 0.026 by September 2021, and has remained stable until December 2021.
- However, asset turnover gradually fell to its lowest point of 0.021 by June 2022.
- From then on, there has been a steady increase with a few fluctuations. The value rose to 0.024 in September 2022, then further to 0.027 by December 2022.
- The upward trend continued into 2023. By March, it reached 0.03, climbing further to 0.033 in June and lastly reaching its peak at 0.035 in September 2023.
The overall growth rate, measuring the last value from the first, is approximately 25%. This indicates a positive trend for IBKR’s asset turnover over the evaluated period despite periodic dips.
The recent data, especially from 2022 onwards, shows this upward trajectory, indicating an improving efficiency of IBKR in using its assets to generate sales. The last recorded figure, 0.035 in September 2023, is the highest in the recorded series and suggests the potential for further growth.
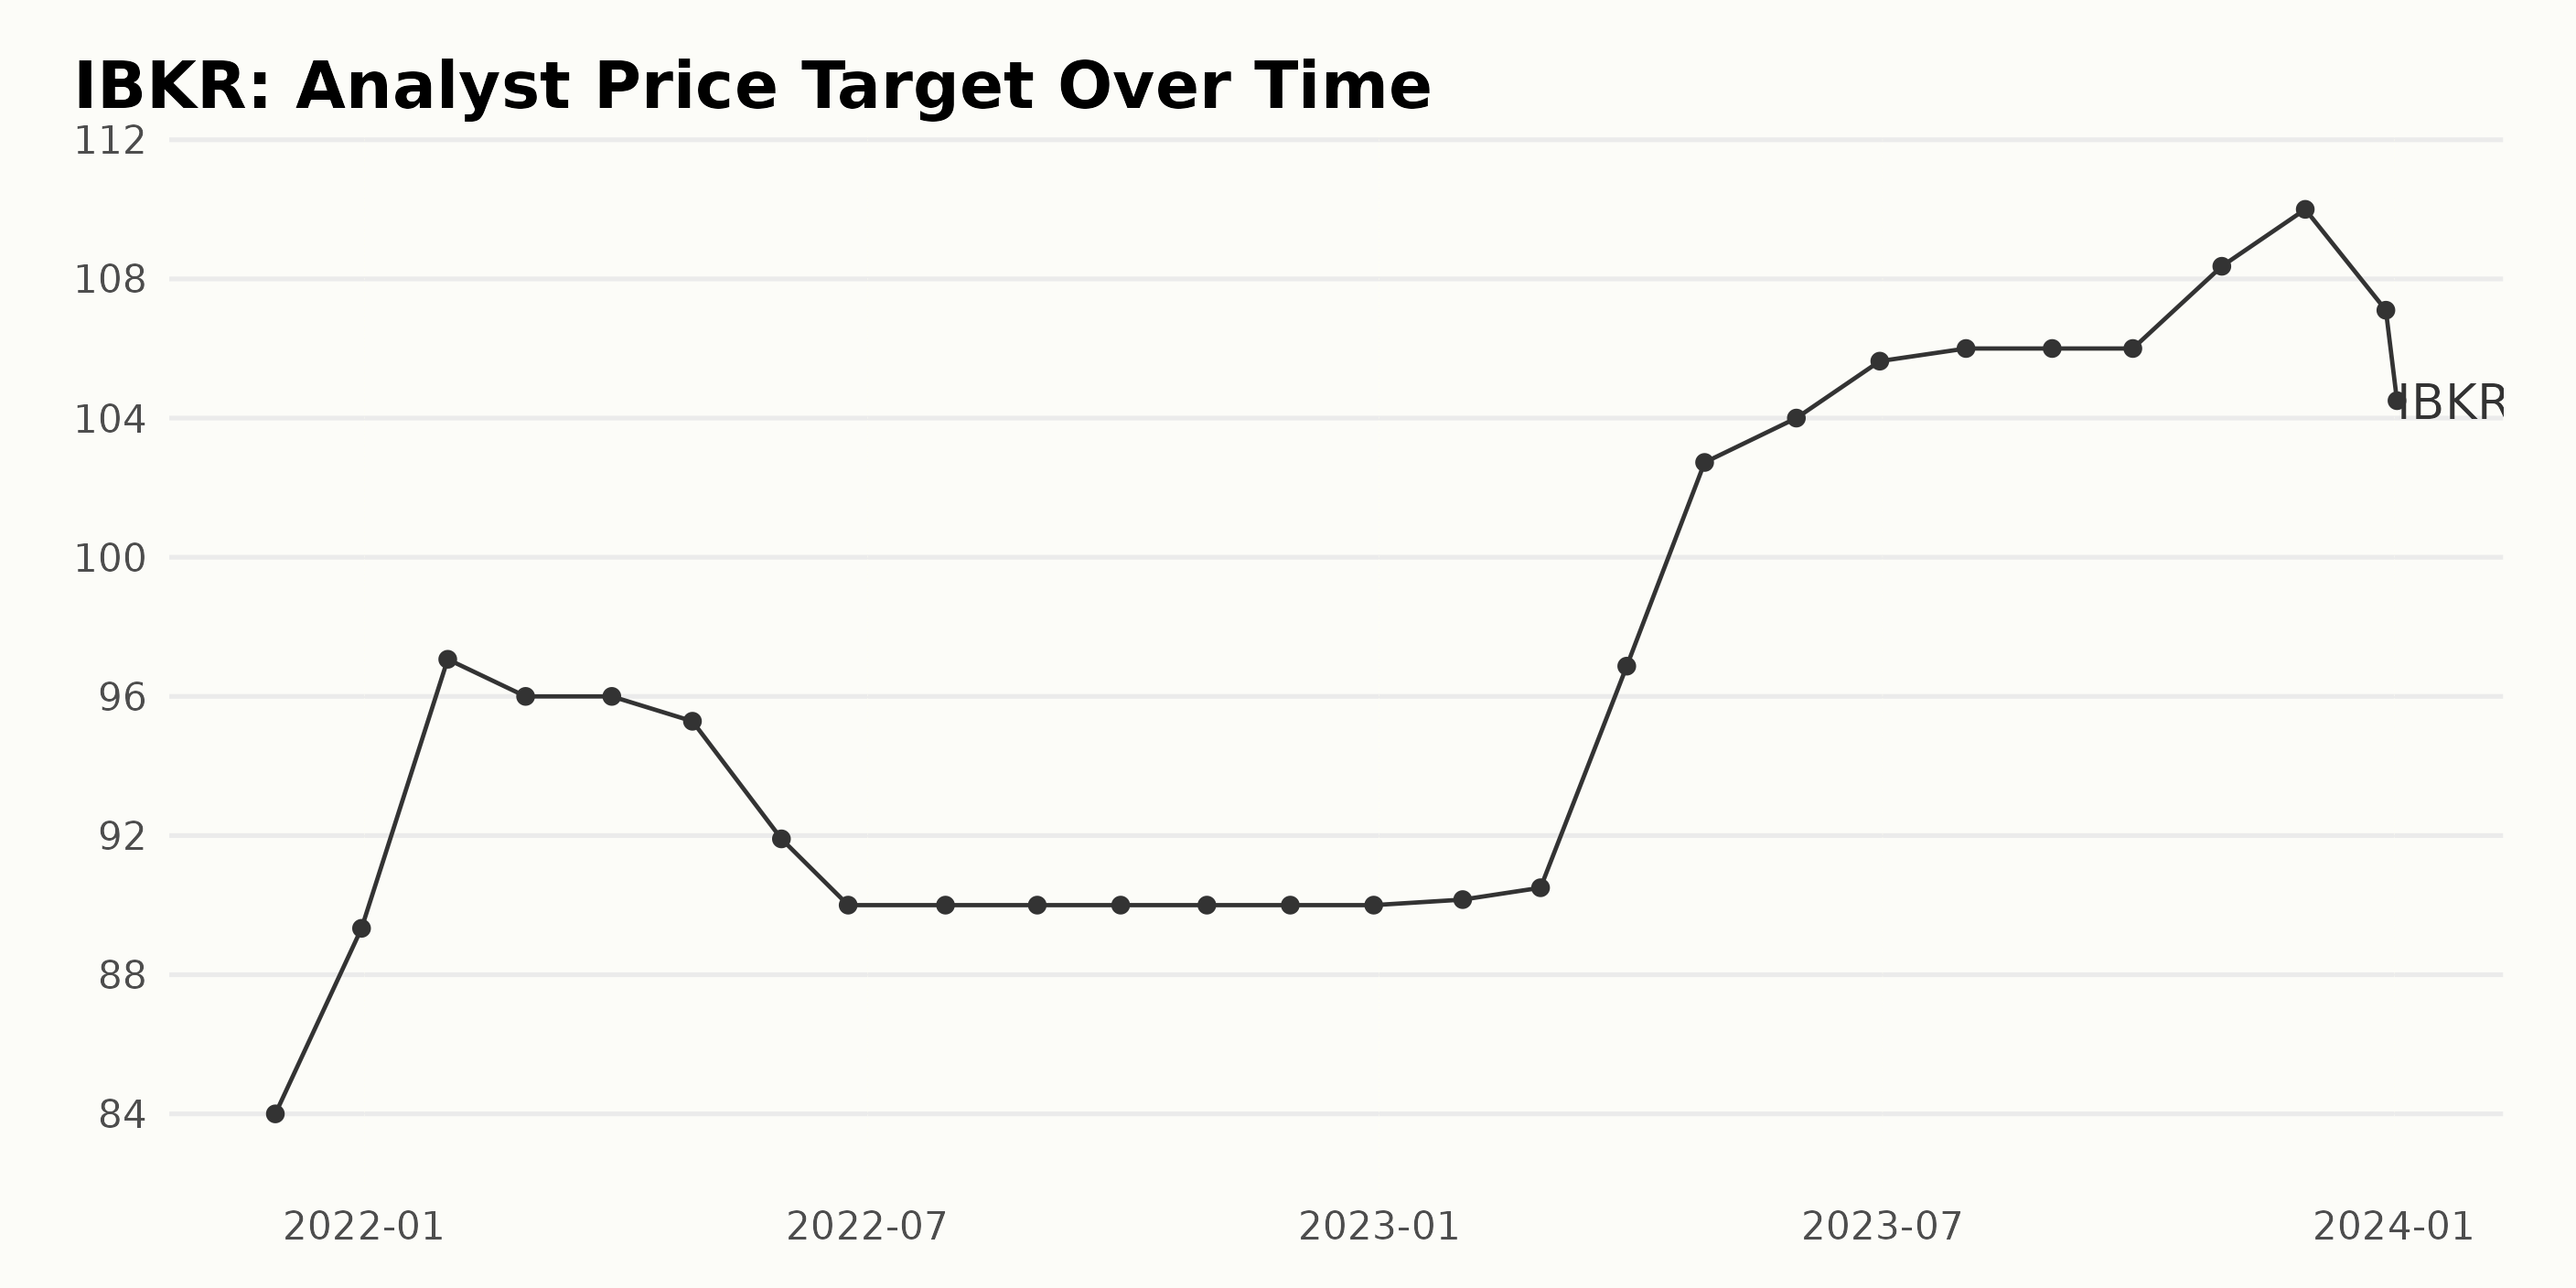
The series of data presented details the trend and fluctuations in the analyst price target for IBKR from November 2021 to January 2024.
- In the first phase, running from November 2021 to February 2022, there was a general pattern of growth. The analyst price target started at $84 in November 2021 and peaked at $97.07 in January 2022 before slightly sliding to $96 in February 2022.
- The second phase, between March 2022 and June 2023, saw a period of relative stability with minor fluctuations. During this stretch, the price target fell to its lowest at $90 from June 2022 till February 2023, after which it began a steady rise again, culminating in a notable increase in March 2023 to $96.87.
- The third phase, from March 2023 to January 2024, experienced a substantial upward trend. By October 2023, the analyst price target had increased to $108.36. It reached its highest point of $110 in November 2023 before a slight dip to $107.1 in December 2023. The series ended on a lower note, with the analyst price target of $104.5 in January 2024.
Over the entire series, the analyst price target for IBKR saw a growth rate of approximately 24.4%, incrementing from $84 in November 2021 to $104.5 by January 2024. Please note that recent data, particularly of the last value, indicates a slight downward correction after reaching the peak in late 2023.
Interactive Brokers Group, Inc. Share Price: A Study of Volatility and Resilience in 2023-2024
Based on the data provided, the following trend and growth rate can be observed for the share price of IBKR:
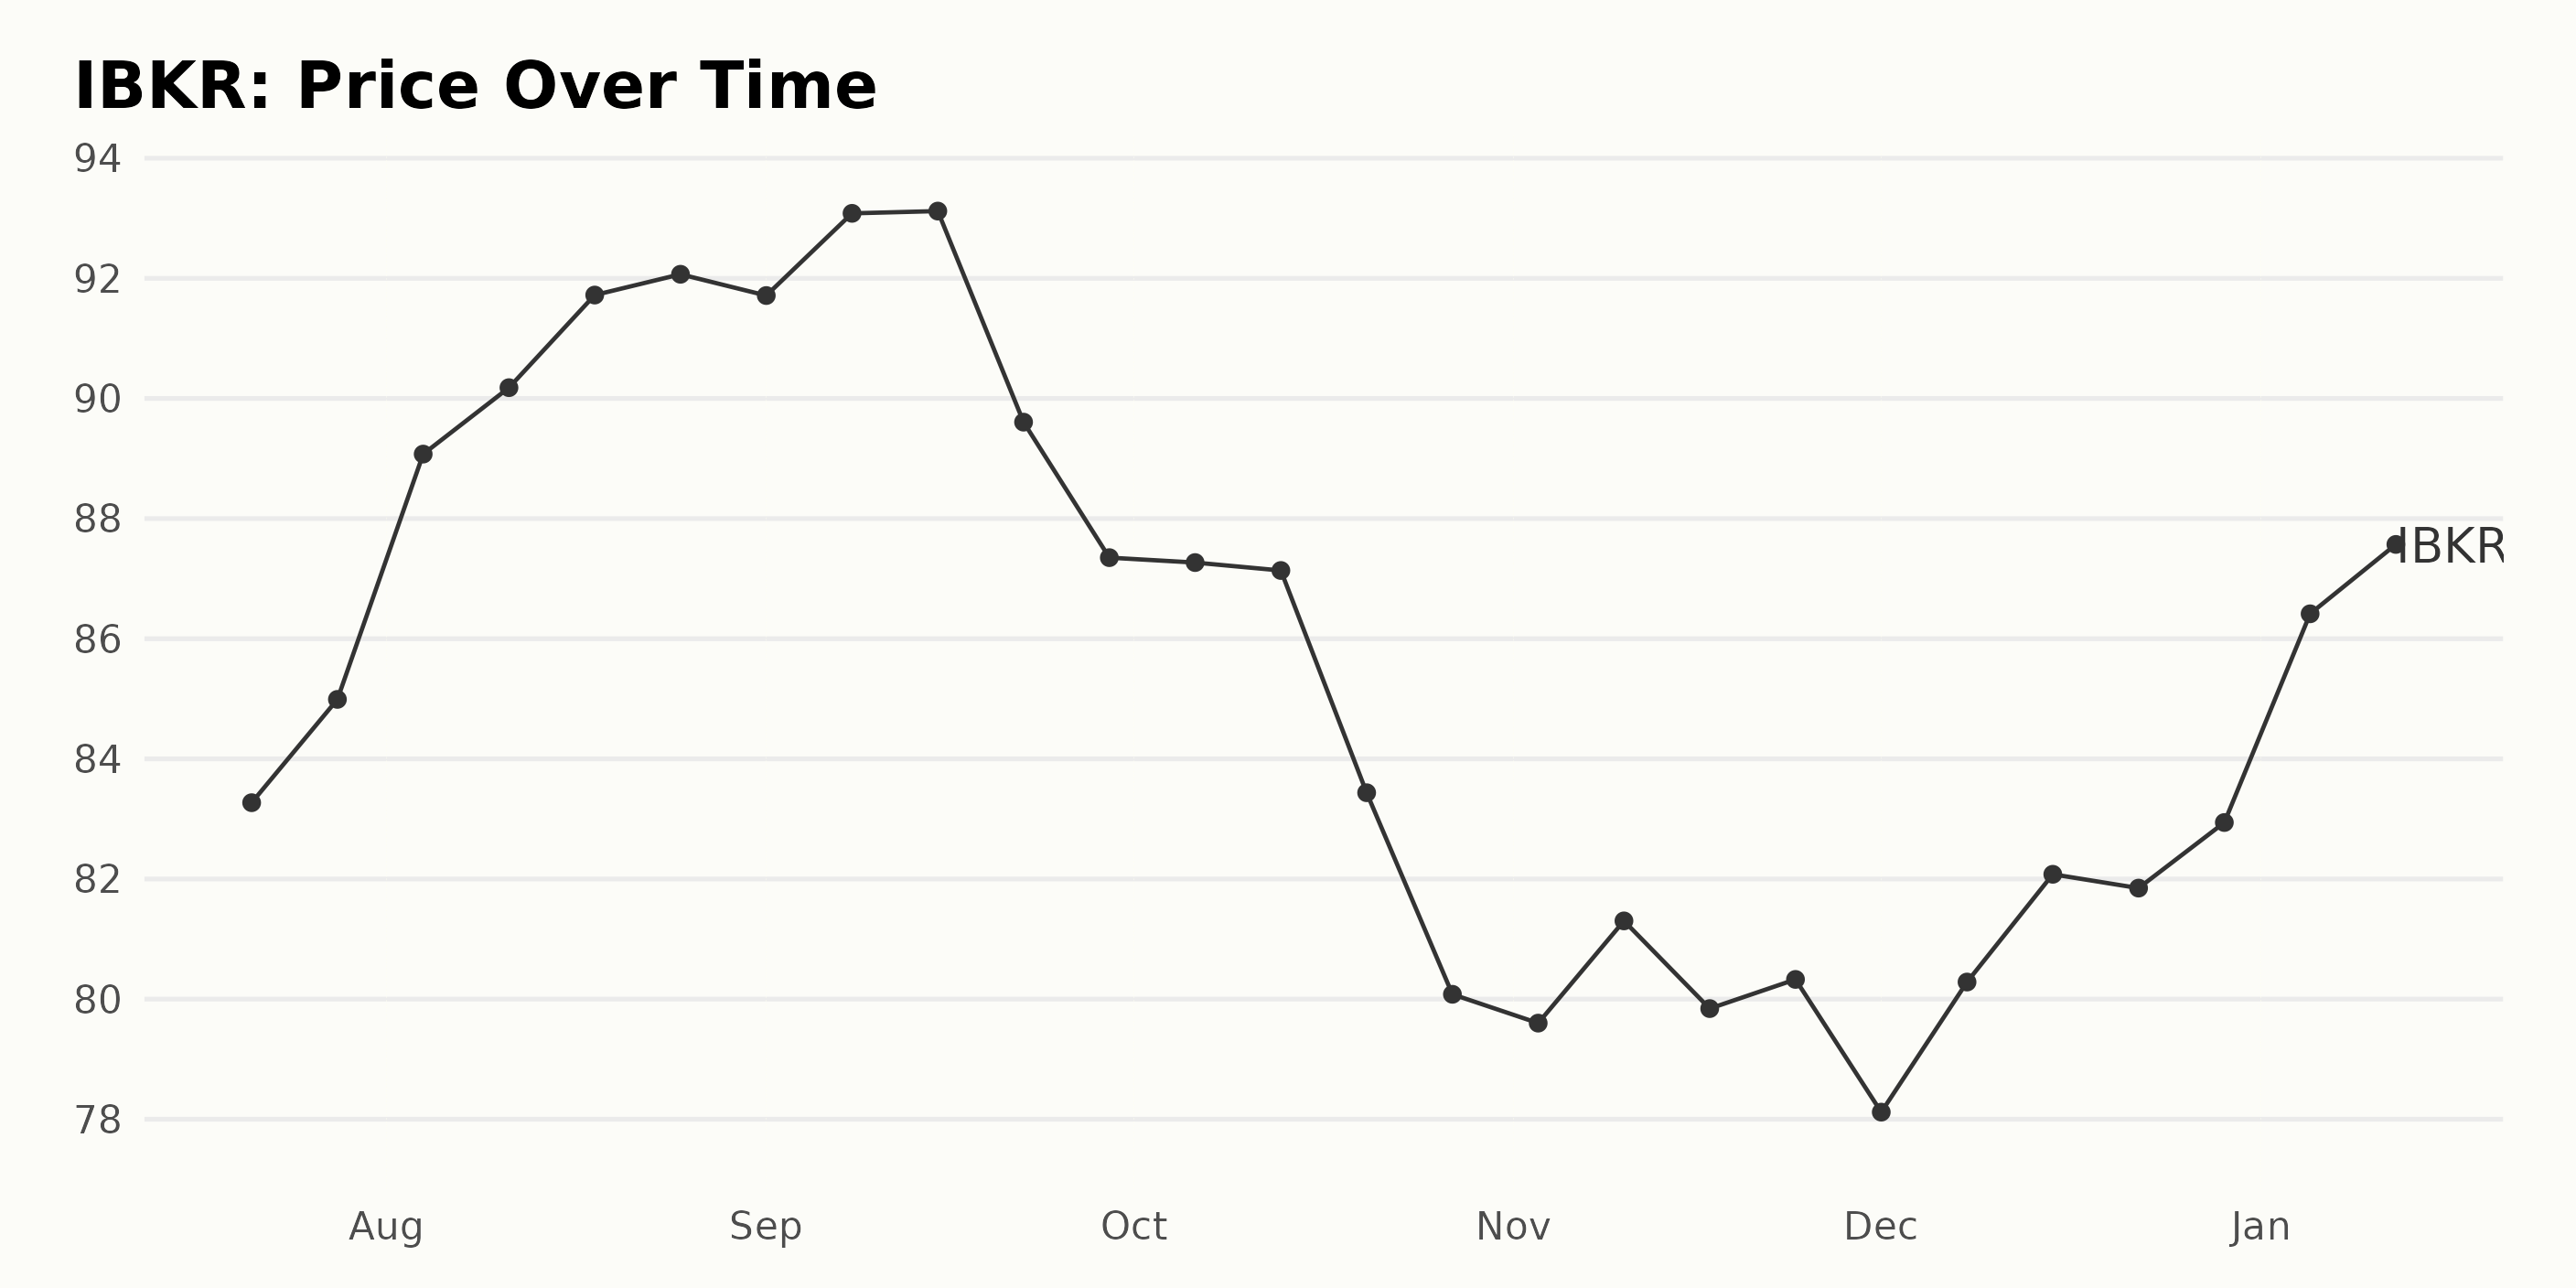
- July 2023: The share price showed a slight increase from $83.27 on July 21, 2023, to $84.99 on July 28, 2023.
- August 2023: This month experienced a steady increase in the share price, starting at $89.07 on August 4 and peaking at $92.07 on August 25. The overall growth rate for this month appears to be slightly accelerating.
- September 2023: There was a marginal increase until September 15, when it reached a peak value of $93.12. From there, the share price started to decline to $87.35 on September 29. This indicates a decelerating growth rate during the latter half of this month.
- October 2023: The share price continued its descent, reaching $80.08 by October 27. However, this downward trend showed signs of deceleration as the reduction per week narrowed down.
- November 2023: A fluctuation was observed this month, with the share price lessening initially and then rising to $81.30 on November 10 before reducing again by November 24. The final price was $80.33, showing a roughly stable but uncertain progression for this month.
- December 2023: The share price seesawed with a decline and rise but ended the year on a positive note by increasing to $82.94 on December 29, 2023.
- January 2024: The share price began increasing again, reaching $88.36 by January 12, 2024, which exhibits a growth acceleration in 2024.
Overall, while there’s been volatility, the share price of IBKR has shown an ability to rebound and realize increases after periods of decline in the period analyzed. Here is a chart of IBKR's price over the past 180 days.
Analyzing Interactive Brokers Group's Growth, Momentum, and Sentiment Ratings Trends
IBKR, a stock in the 20-stock Investment Brokerage category, has exhibited changes in the POWR Ratings grade and its rank within the category over several weeks. Here are some key details regarding the data:
- To begin from July 2023, IBKR held a steady POWR grade of C (Neutral) and ranked 10th in the category for two consecutive weeks.
- In the first week of August 2023, it fell to the 12th position in the category and further dropped to 14th in the middle of the same month.
- By August 19, 2023, it was positioned 16th within the Investment Brokerage category, where it remained steady until the end of the month.
- In September 2023, there was a slight improvement in its performance, moving up one position to 15th for the first half of the month and then a better hike to 14th for the second half.
- However, in October 2023, there was notable progress. IBKR elevated its rank to 12th in the middle of the month and, by the end of the month, had risen to the 11th position.
- For the entirety of November 2023, it secured a solid 10th placement in the category.
- Unfortunately, starting from December 2023, its rank started falling again, landing it at 14th position at the end of the year.
- As of the latest data available on January 15, 2024, the stock holds a C (Neutral) POWR grade and ranks 14th in the category.
Throughout this period, although there were visible fluctuations in the ranking, the POWR grade for IBKR remained consistent at C (Neutral). These statistics show a stable yet average performance for IBKR in comparison to other stocks in the Investment Brokerage category.
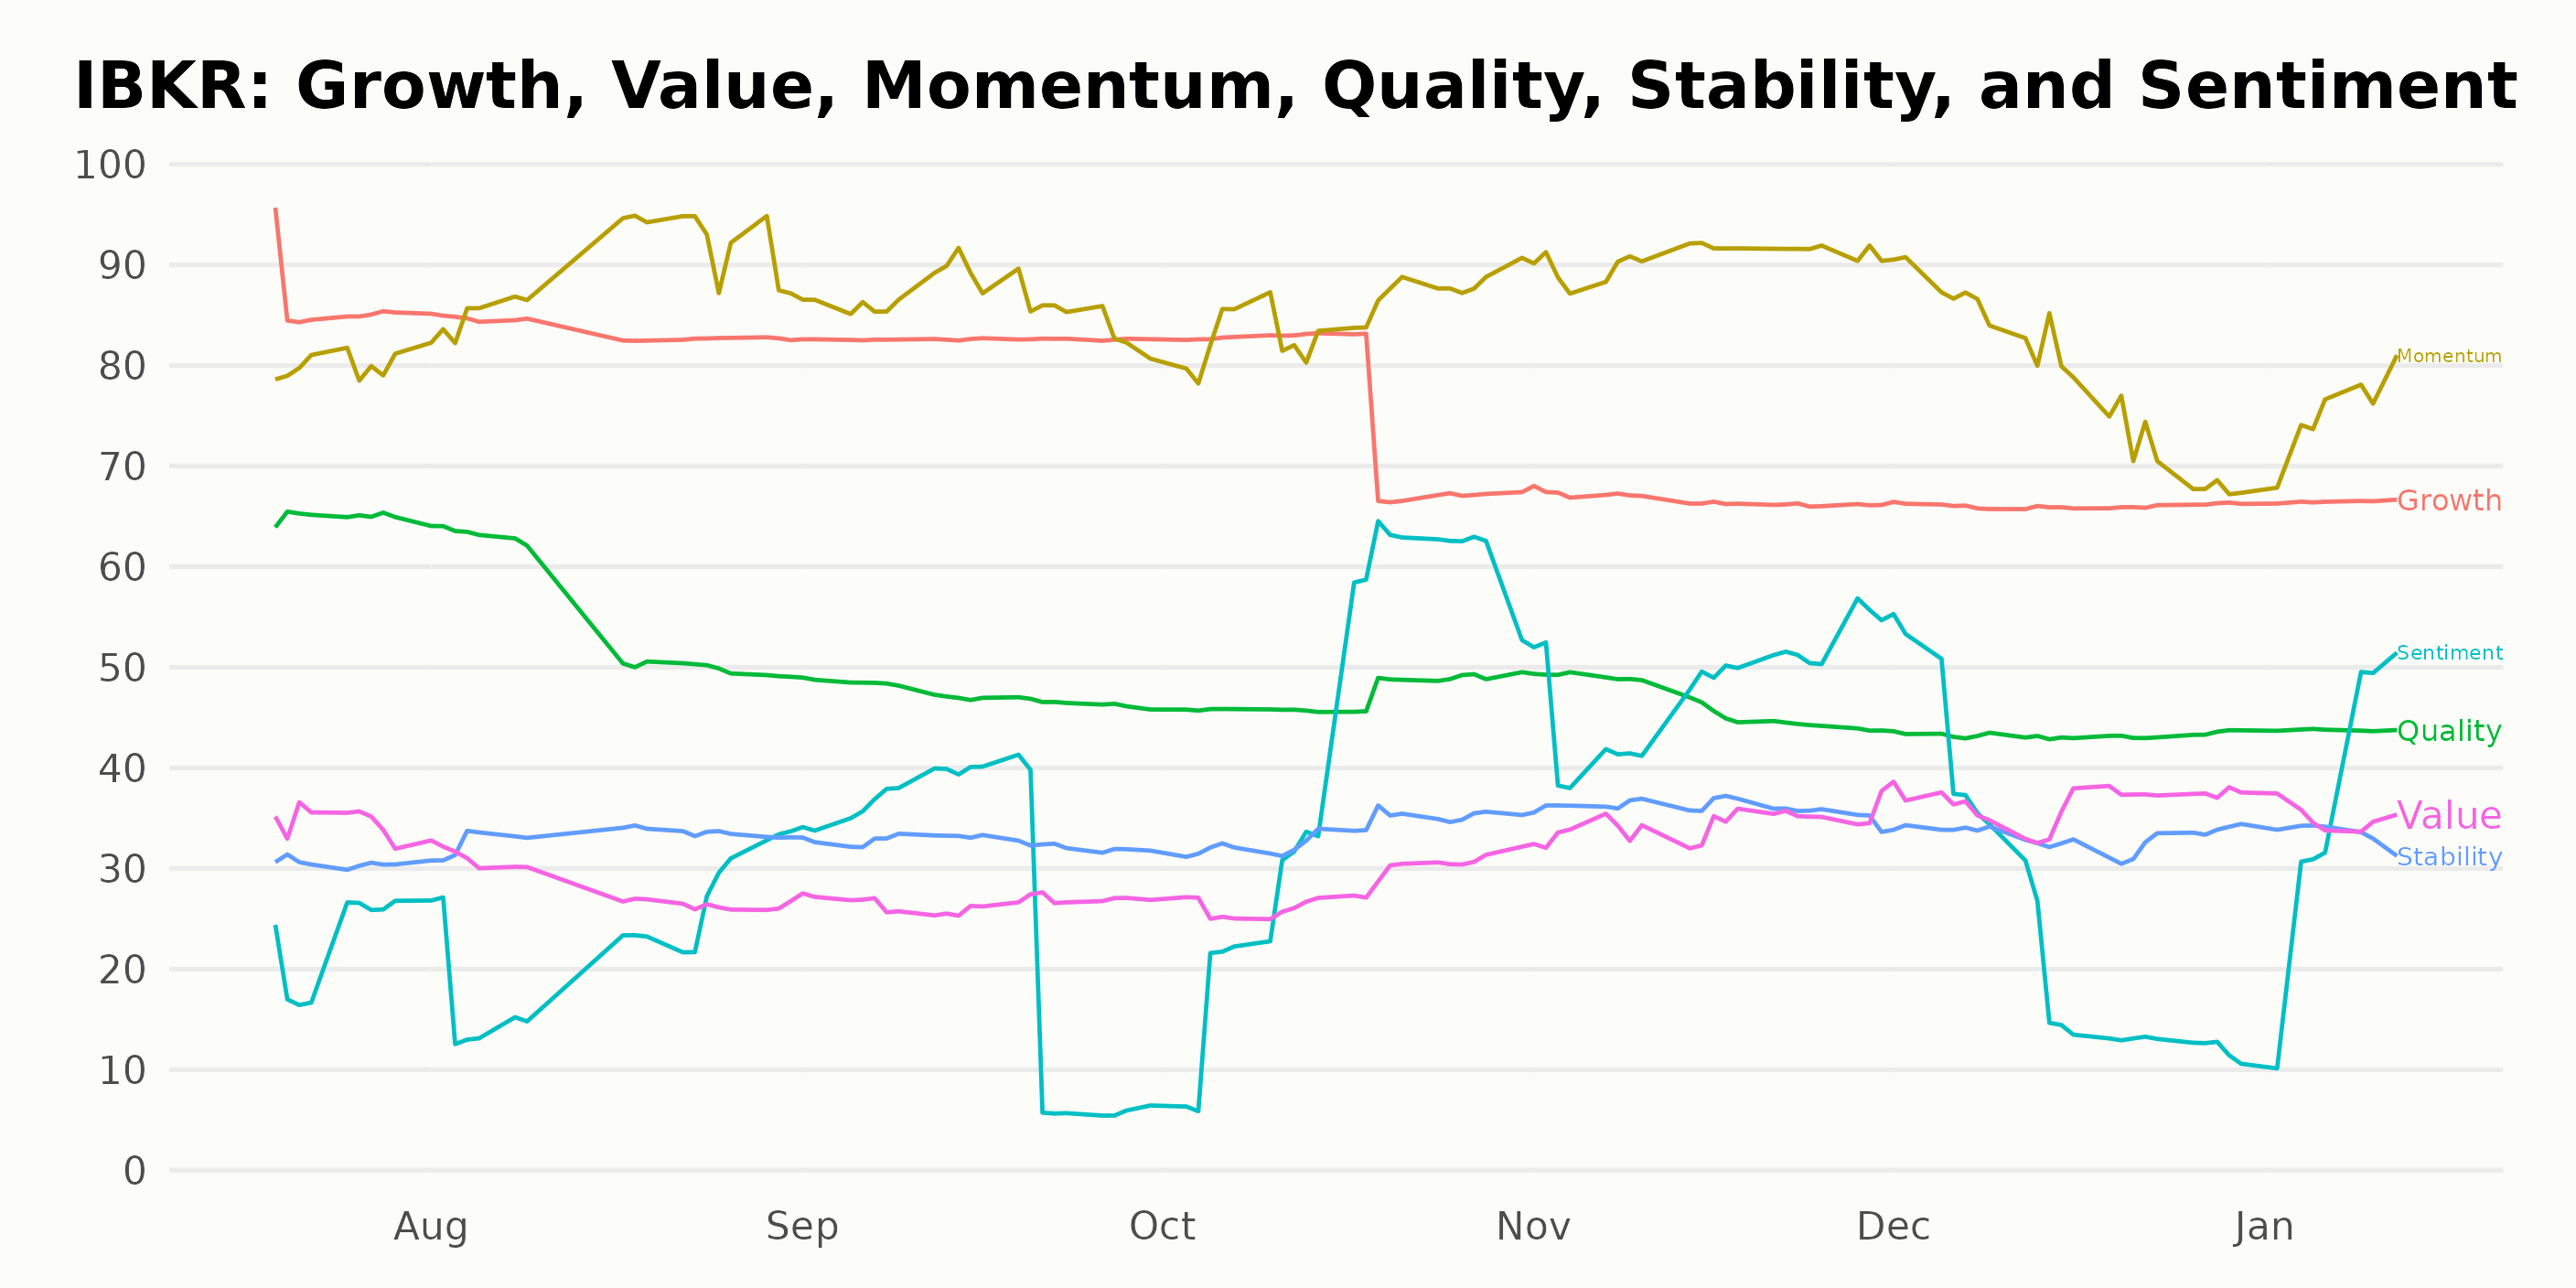
The three most noteworthy dimensions of the POWR Ratings for IBKR are the Growth, Momentum, and Sentiment dimensions.
Growth: The Growth rating showed a downward trend from July 2023 to January 2024. It was at its highest value of 86 in July 2023 and fell to its lowest value of 66 in December 2023, maintaining the same value into January 2024.
Momentum: The Momentum rating exhibited an overall increasing trend throughout the same period. The rating started at a value of 80 in July 2023, peaked at 91 in November 2023, and declined slightly to 75 by January 2024.
Sentiment: There has been a notable upward trend in the Sentiment rating over the observed months. Despite starting low at a value of 23 in July 2023, the sentiment rating rose significantly to reach its highest value of 48 in November 2023 before decreasing slightly to a value of 36 in January 2024.
How does Interactive Brokers Group, Inc. (IBKR) Stack Up Against its Peers?
While IBKR has an overall C (Neutral) rating, other stocks in the Asset Management sector that may be worth considering are Silvercrest Asset Management Group Inc. (SAMG), Westwood Holdings Group, Inc. (WHG), and Victory Capital Holdings, Inc. (VCTR) - they have better POWR Ratings. Click here to explore more Asset Management stocks.
What To Do Next?
Get your hands on this special report with 3 low priced companies with tremendous upside potential even in today’s volatile markets:
3 Stocks to DOUBLE This Year >
IBKR shares were trading at $88.36 per share on Monday morning, up $0.52 (+0.59%). Year-to-date, IBKR has gained 6.59%, versus a 0.29% rise in the benchmark S&P 500 index during the same period.
About the Author: Anushka Dutta

Anushka is an analyst whose interest in understanding the impact of broader economic changes on financial markets motivated her to pursue a career in investment research.
The post Interactive Brokers (IBKR) Investors Evaluate Buy Opportunities Ahead of Earnings appeared first on StockNews.com