

Social media giant Snap Inc. (SNAP) announced that its subscription service Snapchat+ has crossed 5 million subscribers. The demand for this paid service has been growing due to added features, although it is only generating a fraction of the company’s revenue.
Contrarily, last month, Snapchat users faced some issues with the platform’s Artificial Intelligence (AI) chatbot when it posted a live update and stopped responding to messages. SNAP’s generative AI technology has received mixed reactions and concerns in products like Snapchat with young users.
Moreover, the company’s weak third-quarter outlook is concerning. SNAP expects its third-quarter revenue to be between $1.07 billion and $1.13 billion, while analysts were expecting revenue at the top of this guidance range. Furthermore, SNAP expects 405 million to 406 million daily active users, while analysts forecasted 406.2 million.
Given this weak outlook, let’s look at the trends of SNAP’s key financial metrics to understand why it could be wise to avoid the stock now.
Analyzing Snap Inc.'s Financial Performance Over a Three-Year Span: Key Insights and Trends
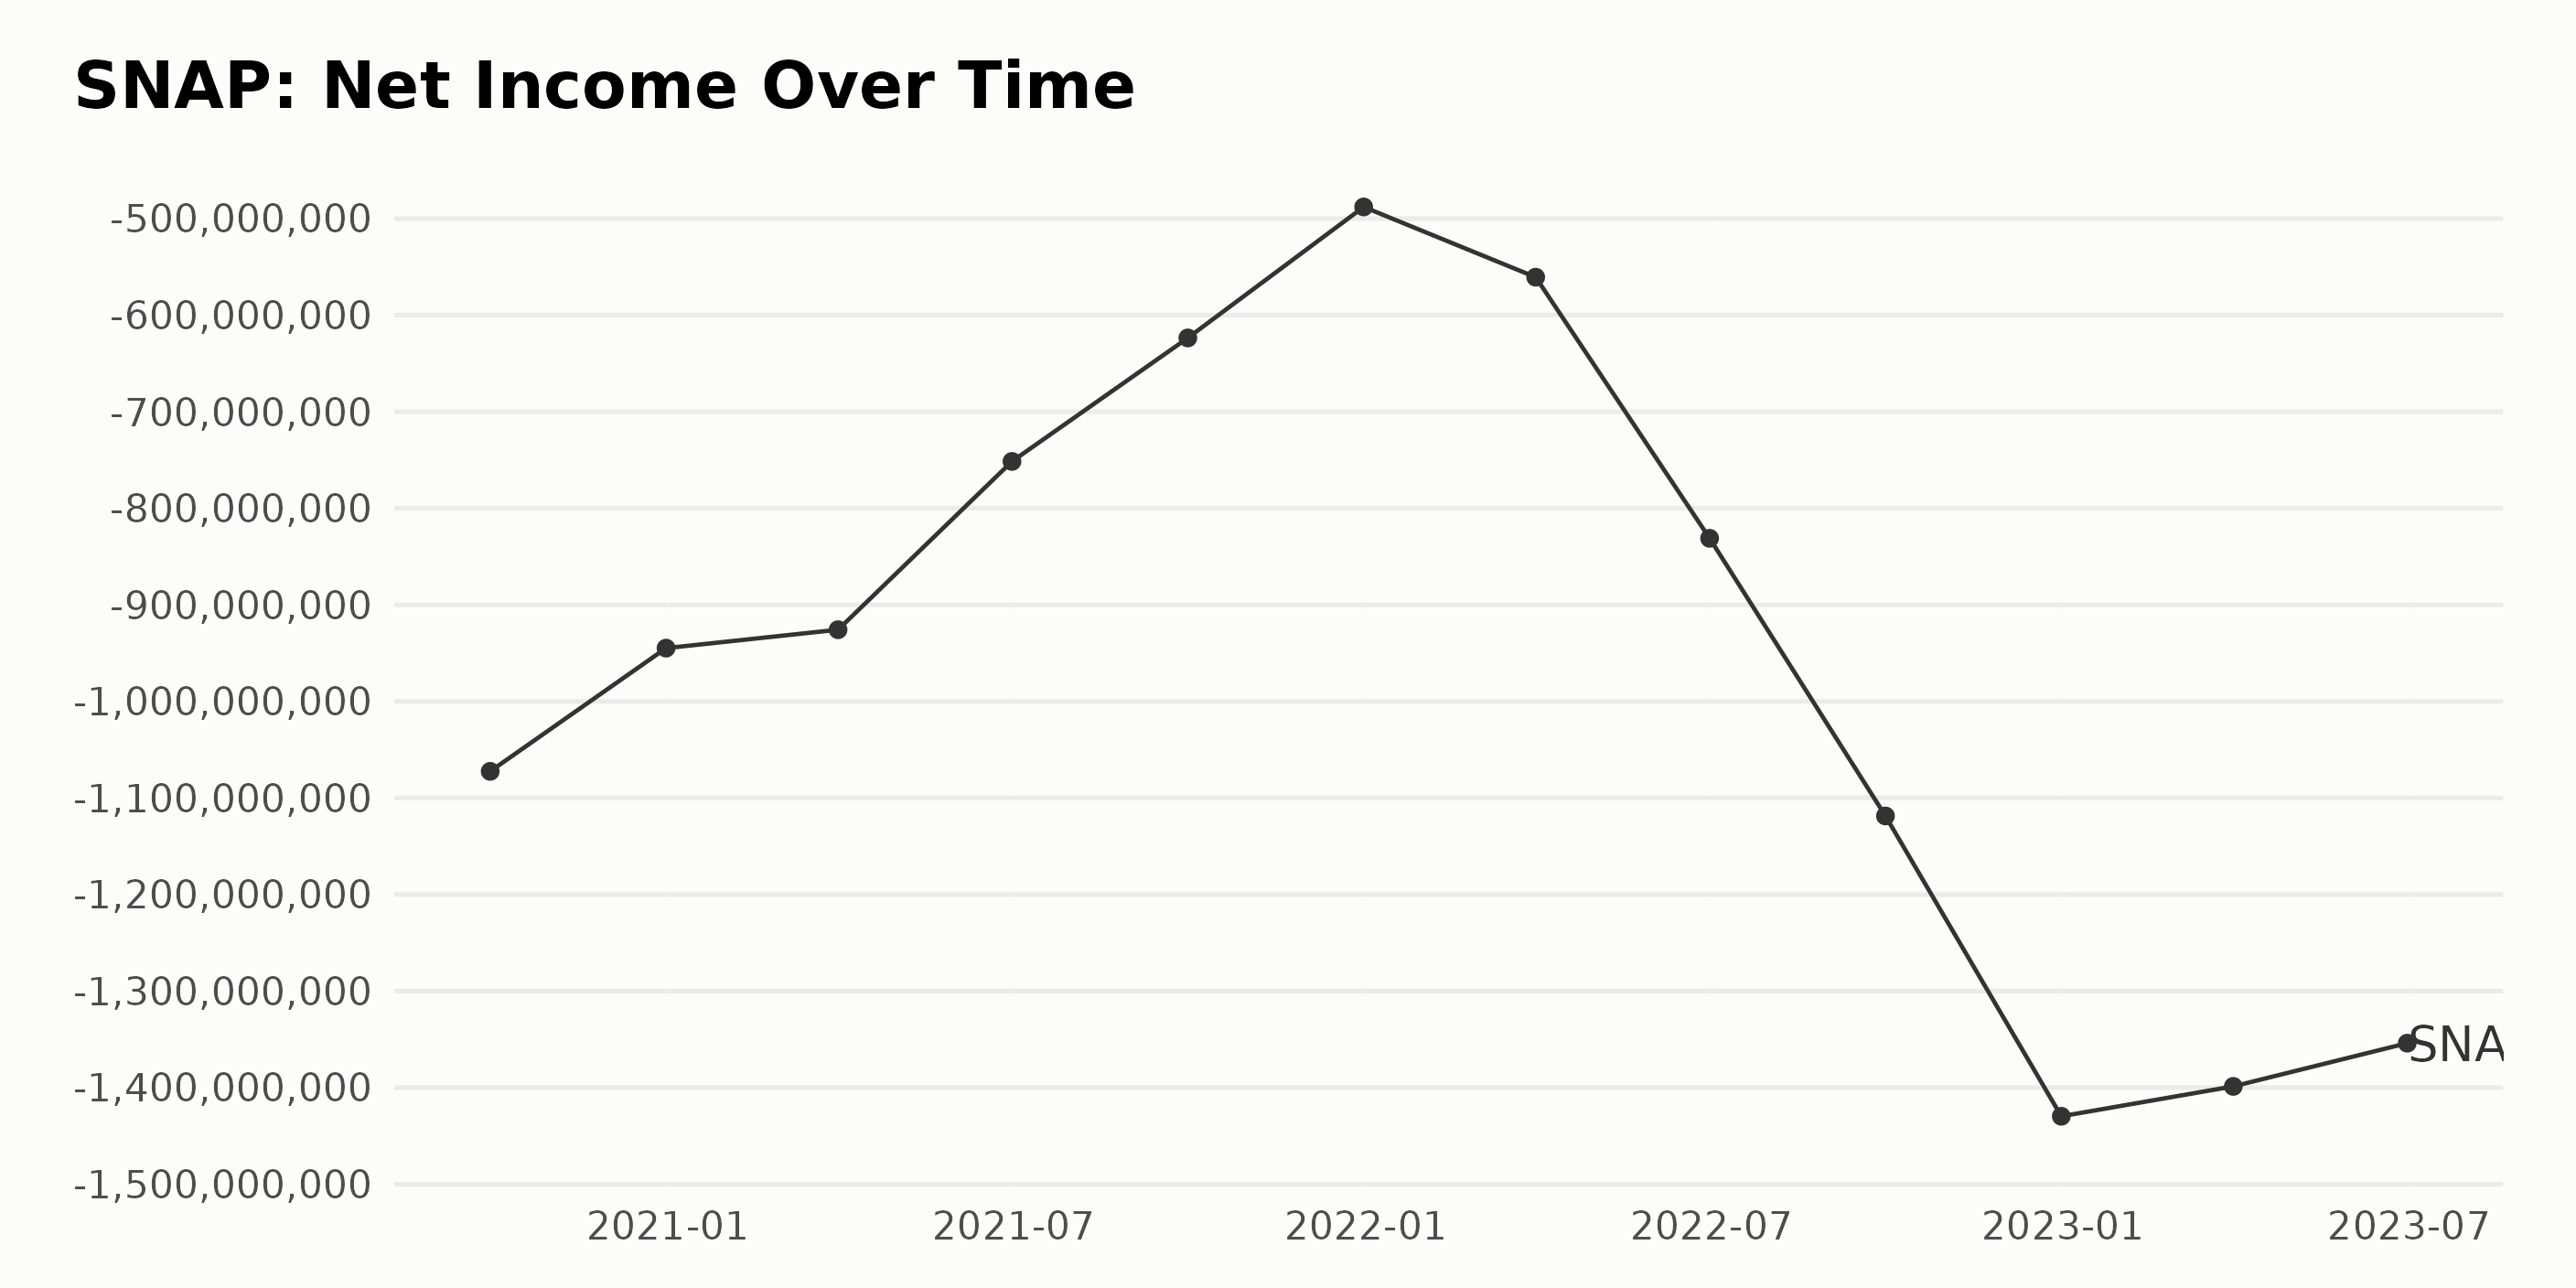
The trailing-12-month net income of SNAP has shown a fluctuating trend over the past few years, according to the data series. Here are the key takeaways:
- As of September 2020, the net income was at a value of -$1.07 billion.
- By the end of 2020, there was a slight improvement, with net income reducing its loss to -$944.84 million.
- In 2021, the first quarter marked a marginally lesser deficit of -$925.78 million, and by the second quarter, SNAP saw substantial mitigation in losses, with net income residing at approximately -$751.5 million.
- However, the company recorded escalated losses of -$1.42 billion by December 2022, showing an increasing negative trend in net income.
- Interestingly, the first and second quarters of 2023 showed a small but notable decline in losses, with a net income of -$1.39 billion and -$1.35 billion, respectively.
In terms of growth rate, comparing the initial value in September 2020 (-$1.07 billion) with the last one in June 2023 (-$1.35 billion), it represents an approximate increase in losses by about 26%.
Emphasis on more recent data suggests that the company's net income has not only remained negative but also witnessed spikes in these losses as of late. Please note that this information is based on publicly available data and might warrant further investigation for a comprehensive financial analysis.
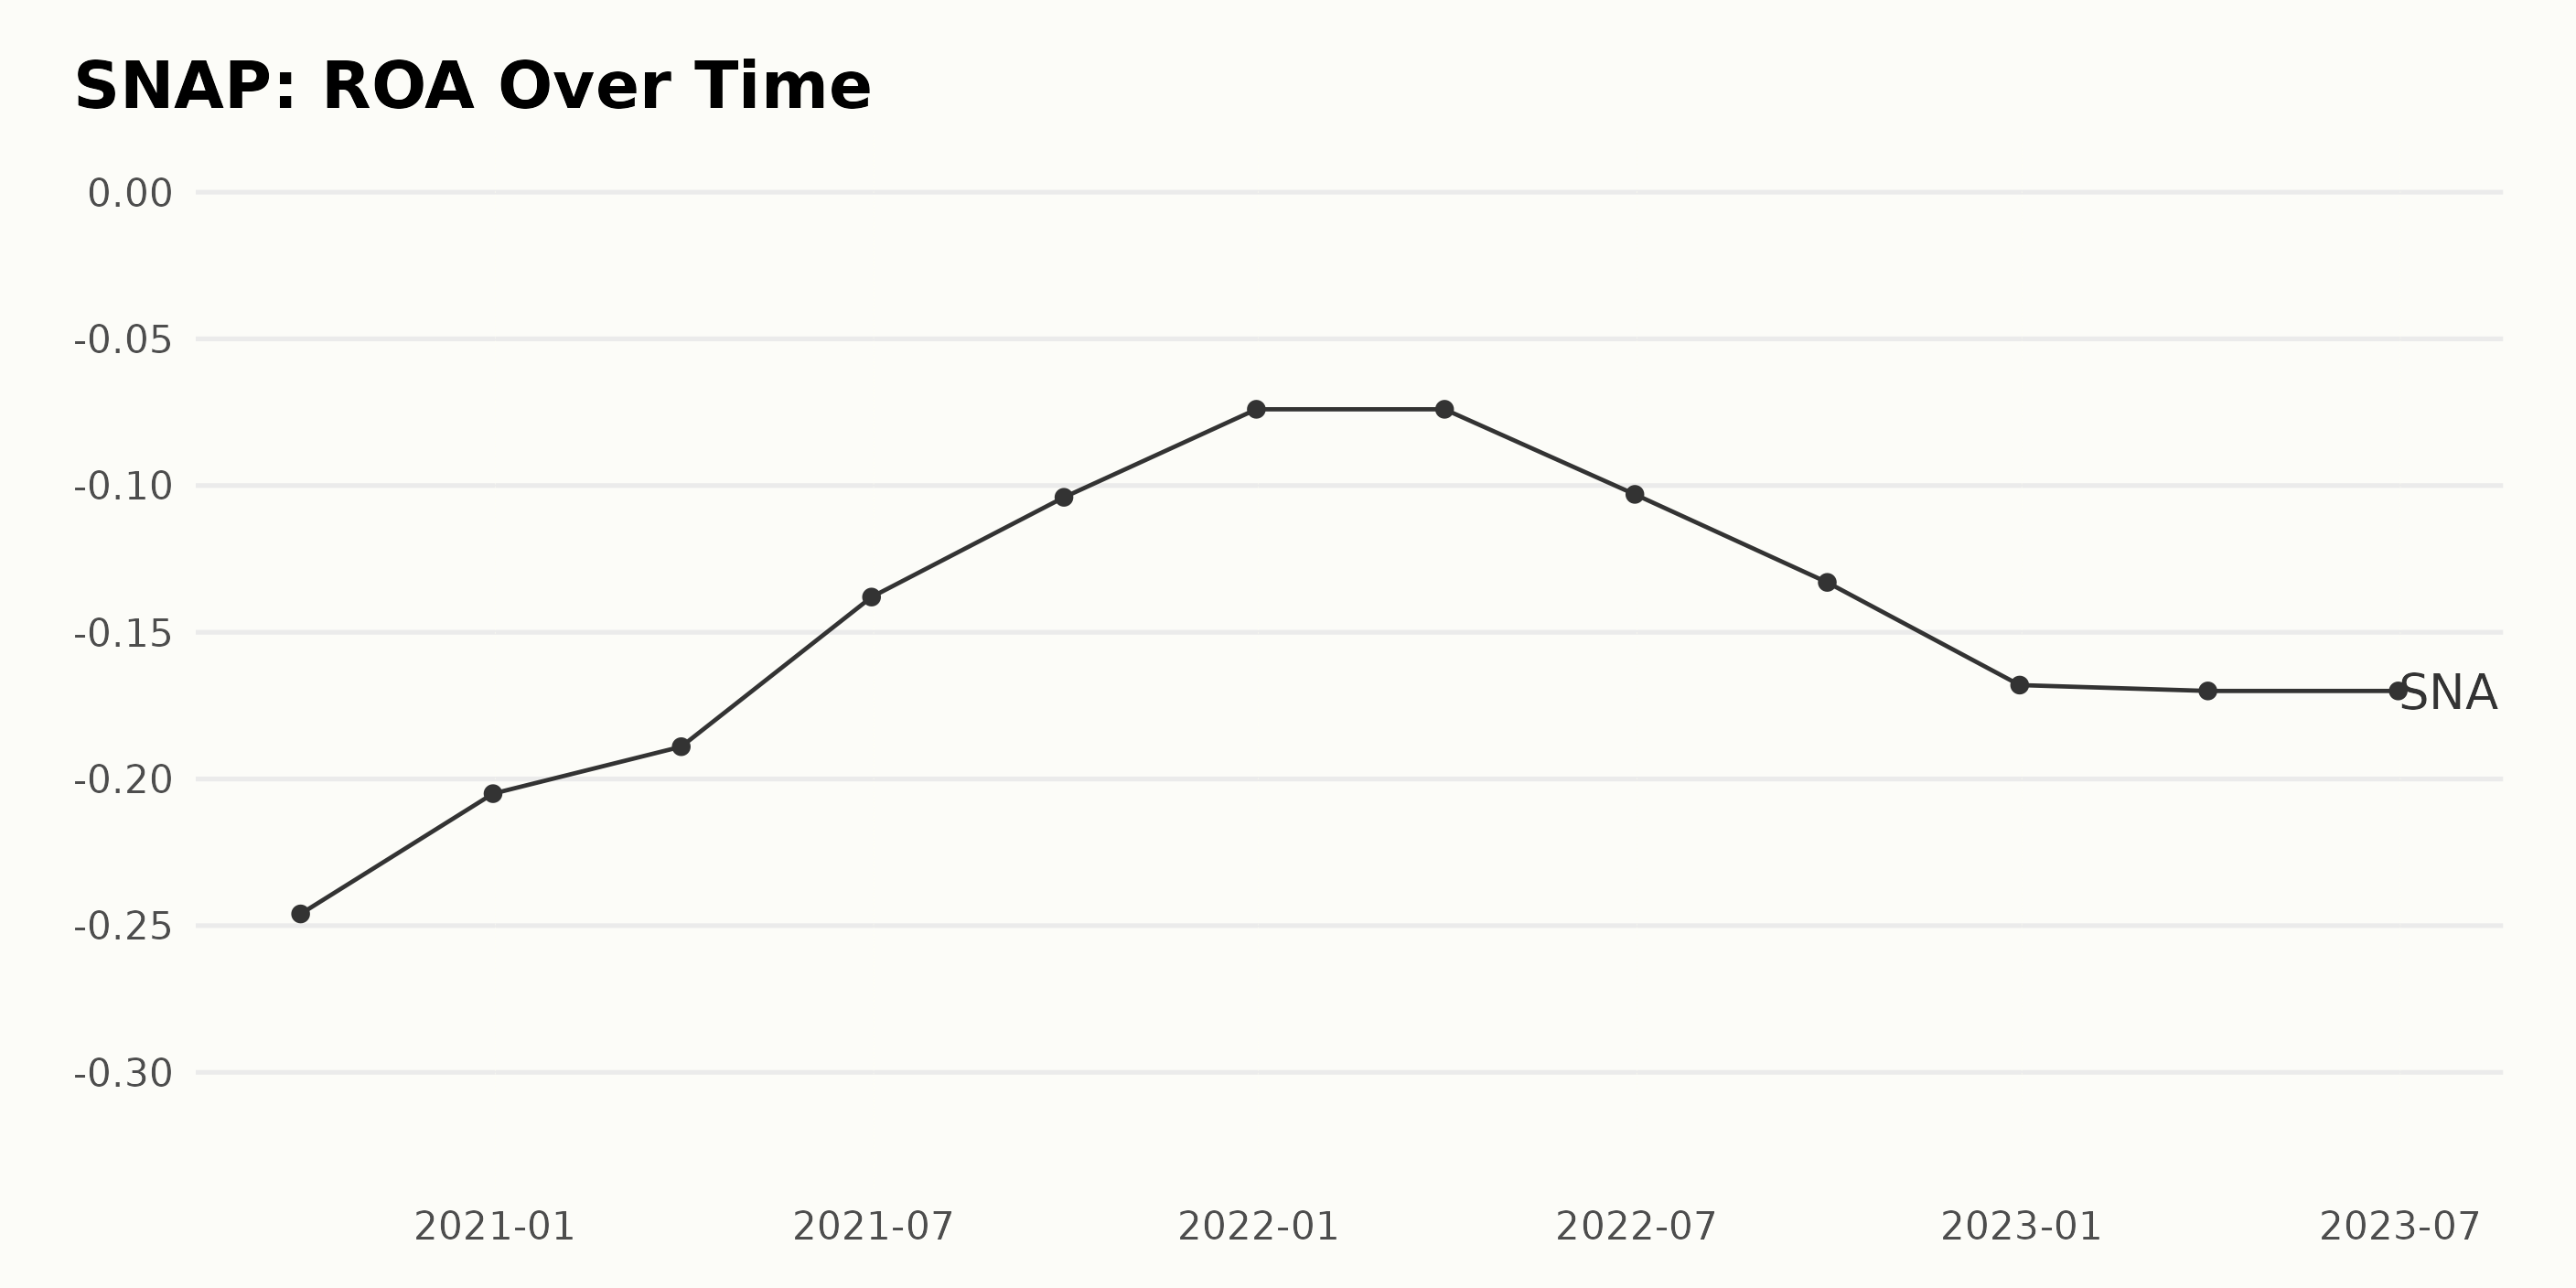
The reported ROA of SNAP, over the given time period, shows a trend of gradual improvement from a value of -0.25 in September 2020 to -0.07 in March 2022. This indication suggests an enhancement in financial efficiency despite still being in the negative range.
However, since June 2022, the company's ROA took a turn, showing a steadily increasing negative growth, reaching its peak at -0.17 by June 2023. The deterioration in the last five quarters of our data series indicates an unfavorable trend in the efficiency of the company's operations when it comes to generating profits. Here are key points:
- From September 2020 to March 2022, SNAP's ROA improved by approximately 70%.
- The ending value of the ROA in June 2023 was -0.17, indicating a negative return on assets.
- After March 2022, there was a notable negative fluctuation. The ROA fell from -0.07 in March 2022 to -0.17 in June 2023, representing a 128% growth in the negative direction.
This data exemplifies that despite an initial period of improvement, SNAP has been experiencing a downward trend in ROA since March 2022, suggesting a need for strategic changes moving forward.
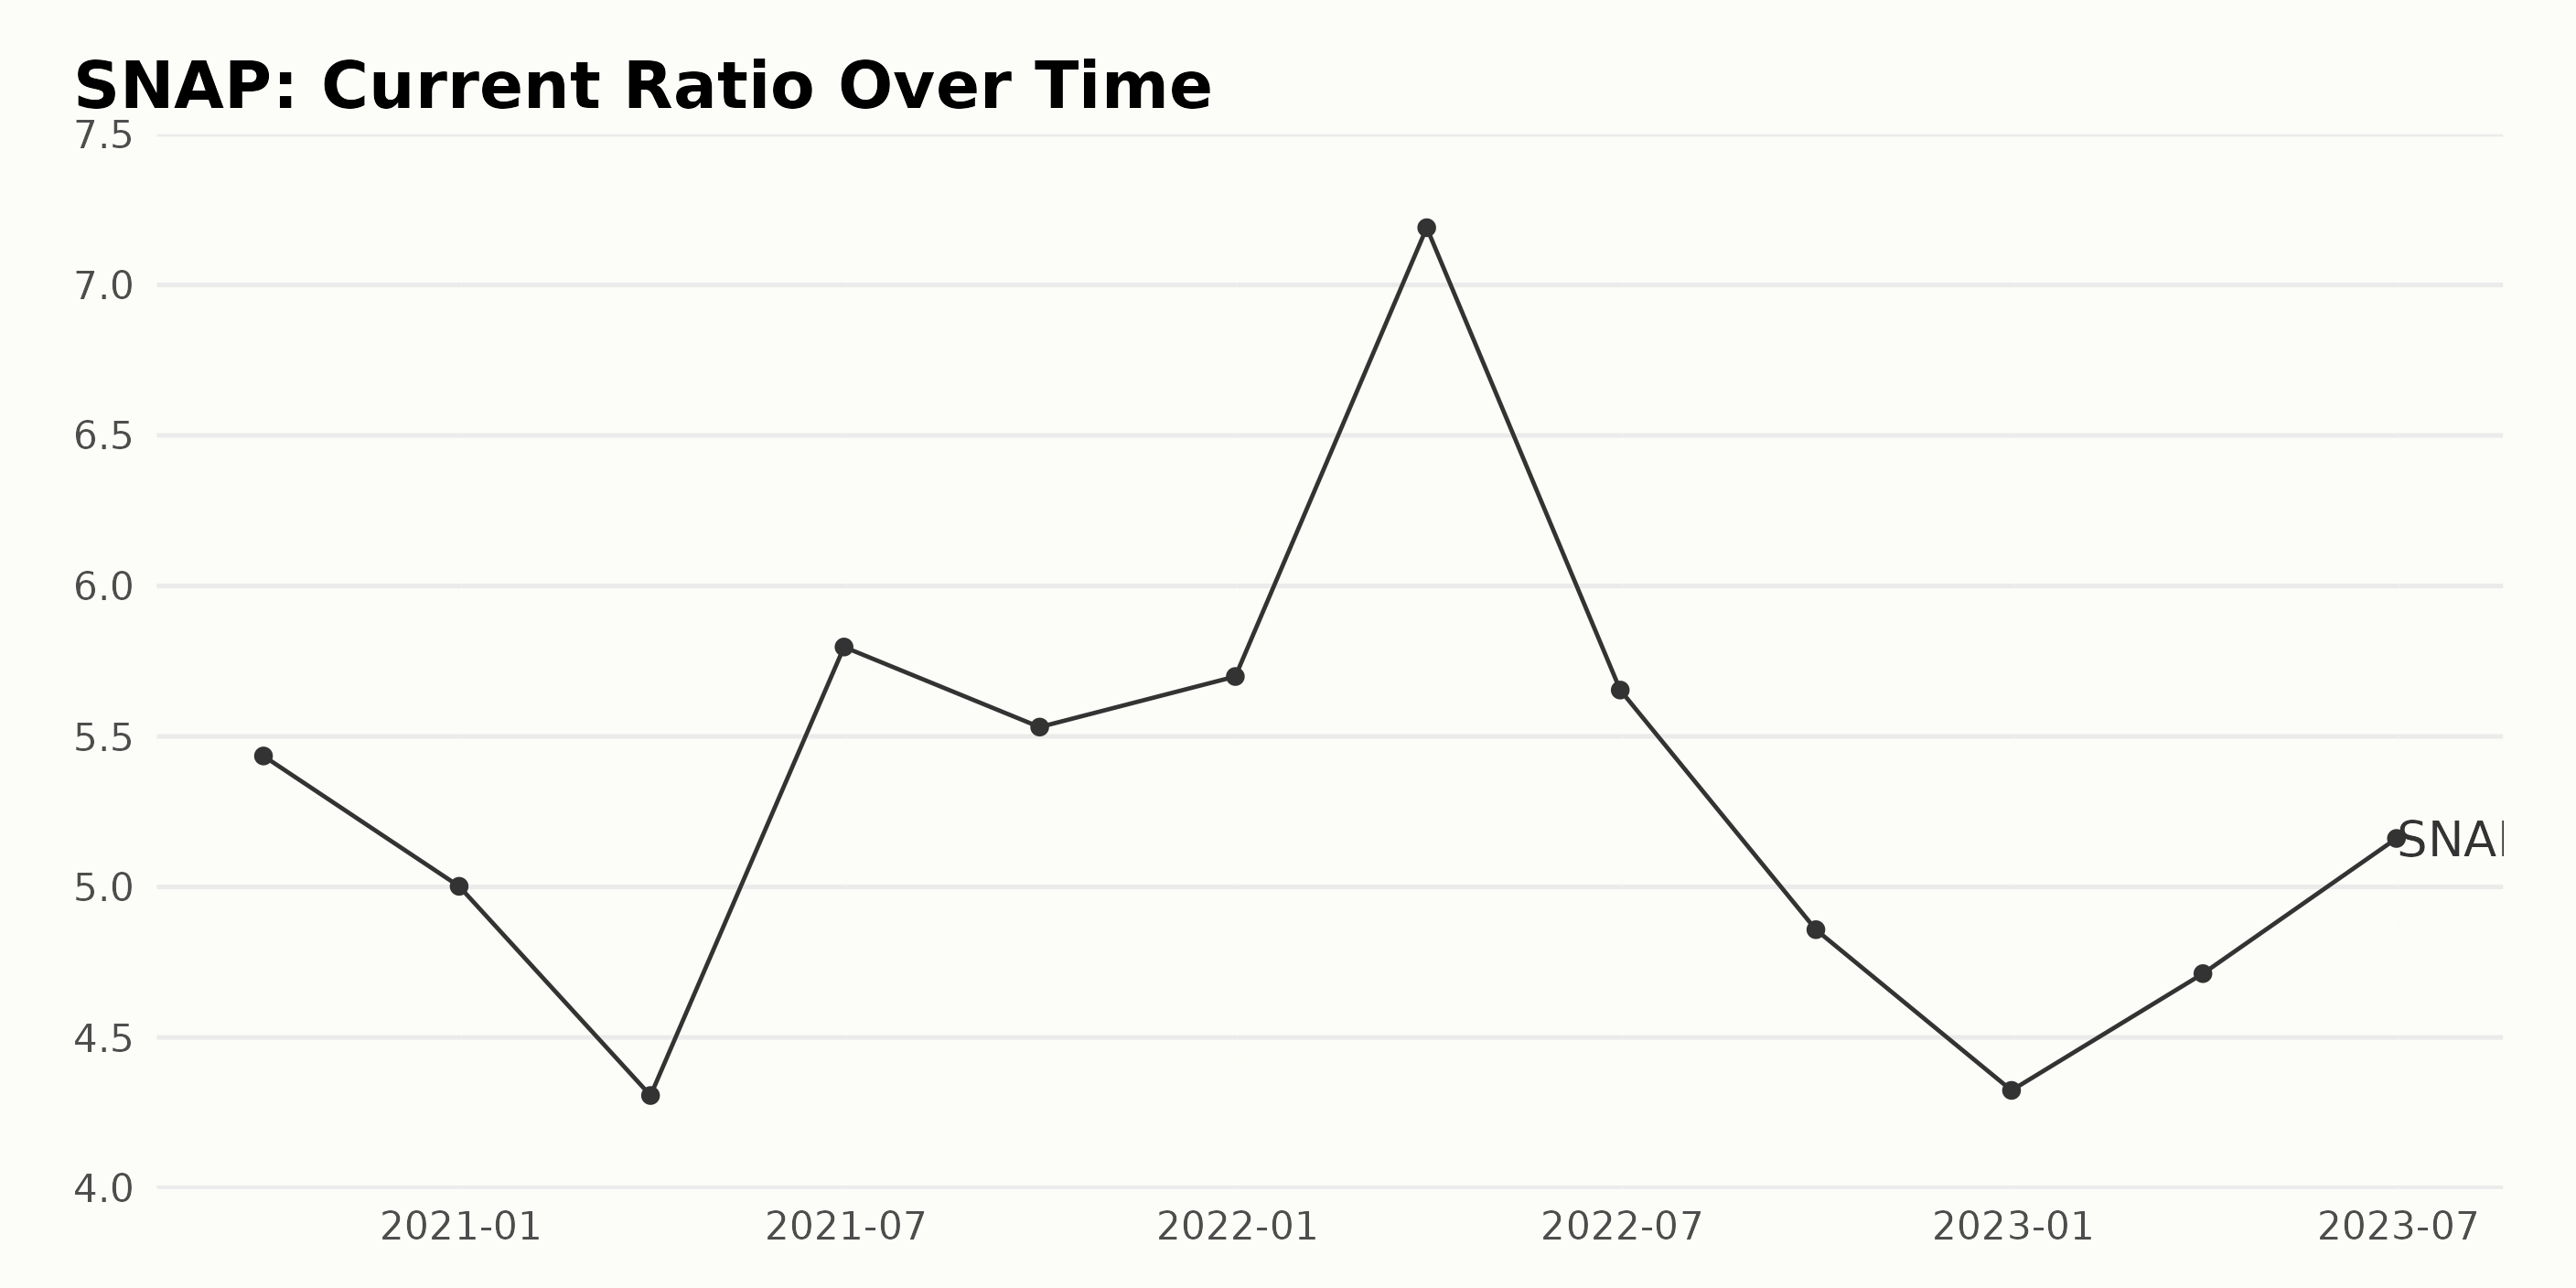
The current ratio of SNAP has experienced both trends and fluctuations from September 2020 to June 2023. The summary of these changes over time is outlined below:
- Starting at 5.43 in September 2020, the current ratio initially decreased to 5.00 by the end of December 2020.
- This downward trend was maintained until March 2021, when the ratio dropped further to 4.31.
- The ratio then rose sharply, reaching a peak of 5.80 in June 2021 before dropping to 5.53 by September 2021.
- The end of the calendar year 2021 saw another increase in the ratio, registering 5.70.
- The first quarter of 2022 witnessed a substantial spike in the current ratio, reaching an all-time high of 7.19. However, this surge was followed by continuous decreases across the subsequent quarters.
- By the end of 2022, the ratio had fallen substantially to 4.32.
- Into 2023, the ratio began gradually increasing again, reaching 5.16 by the end of June.
Overall, a growth rate calculation results in a decrease of approximately -0.27 between the current ratios of September 2020 and June 2023. Despite several periods of increase, the general trend over these years seems to be a gradually decreasing one. Notably, the most recent data reveals a slight upturn, but whether this continues remains to be seen.
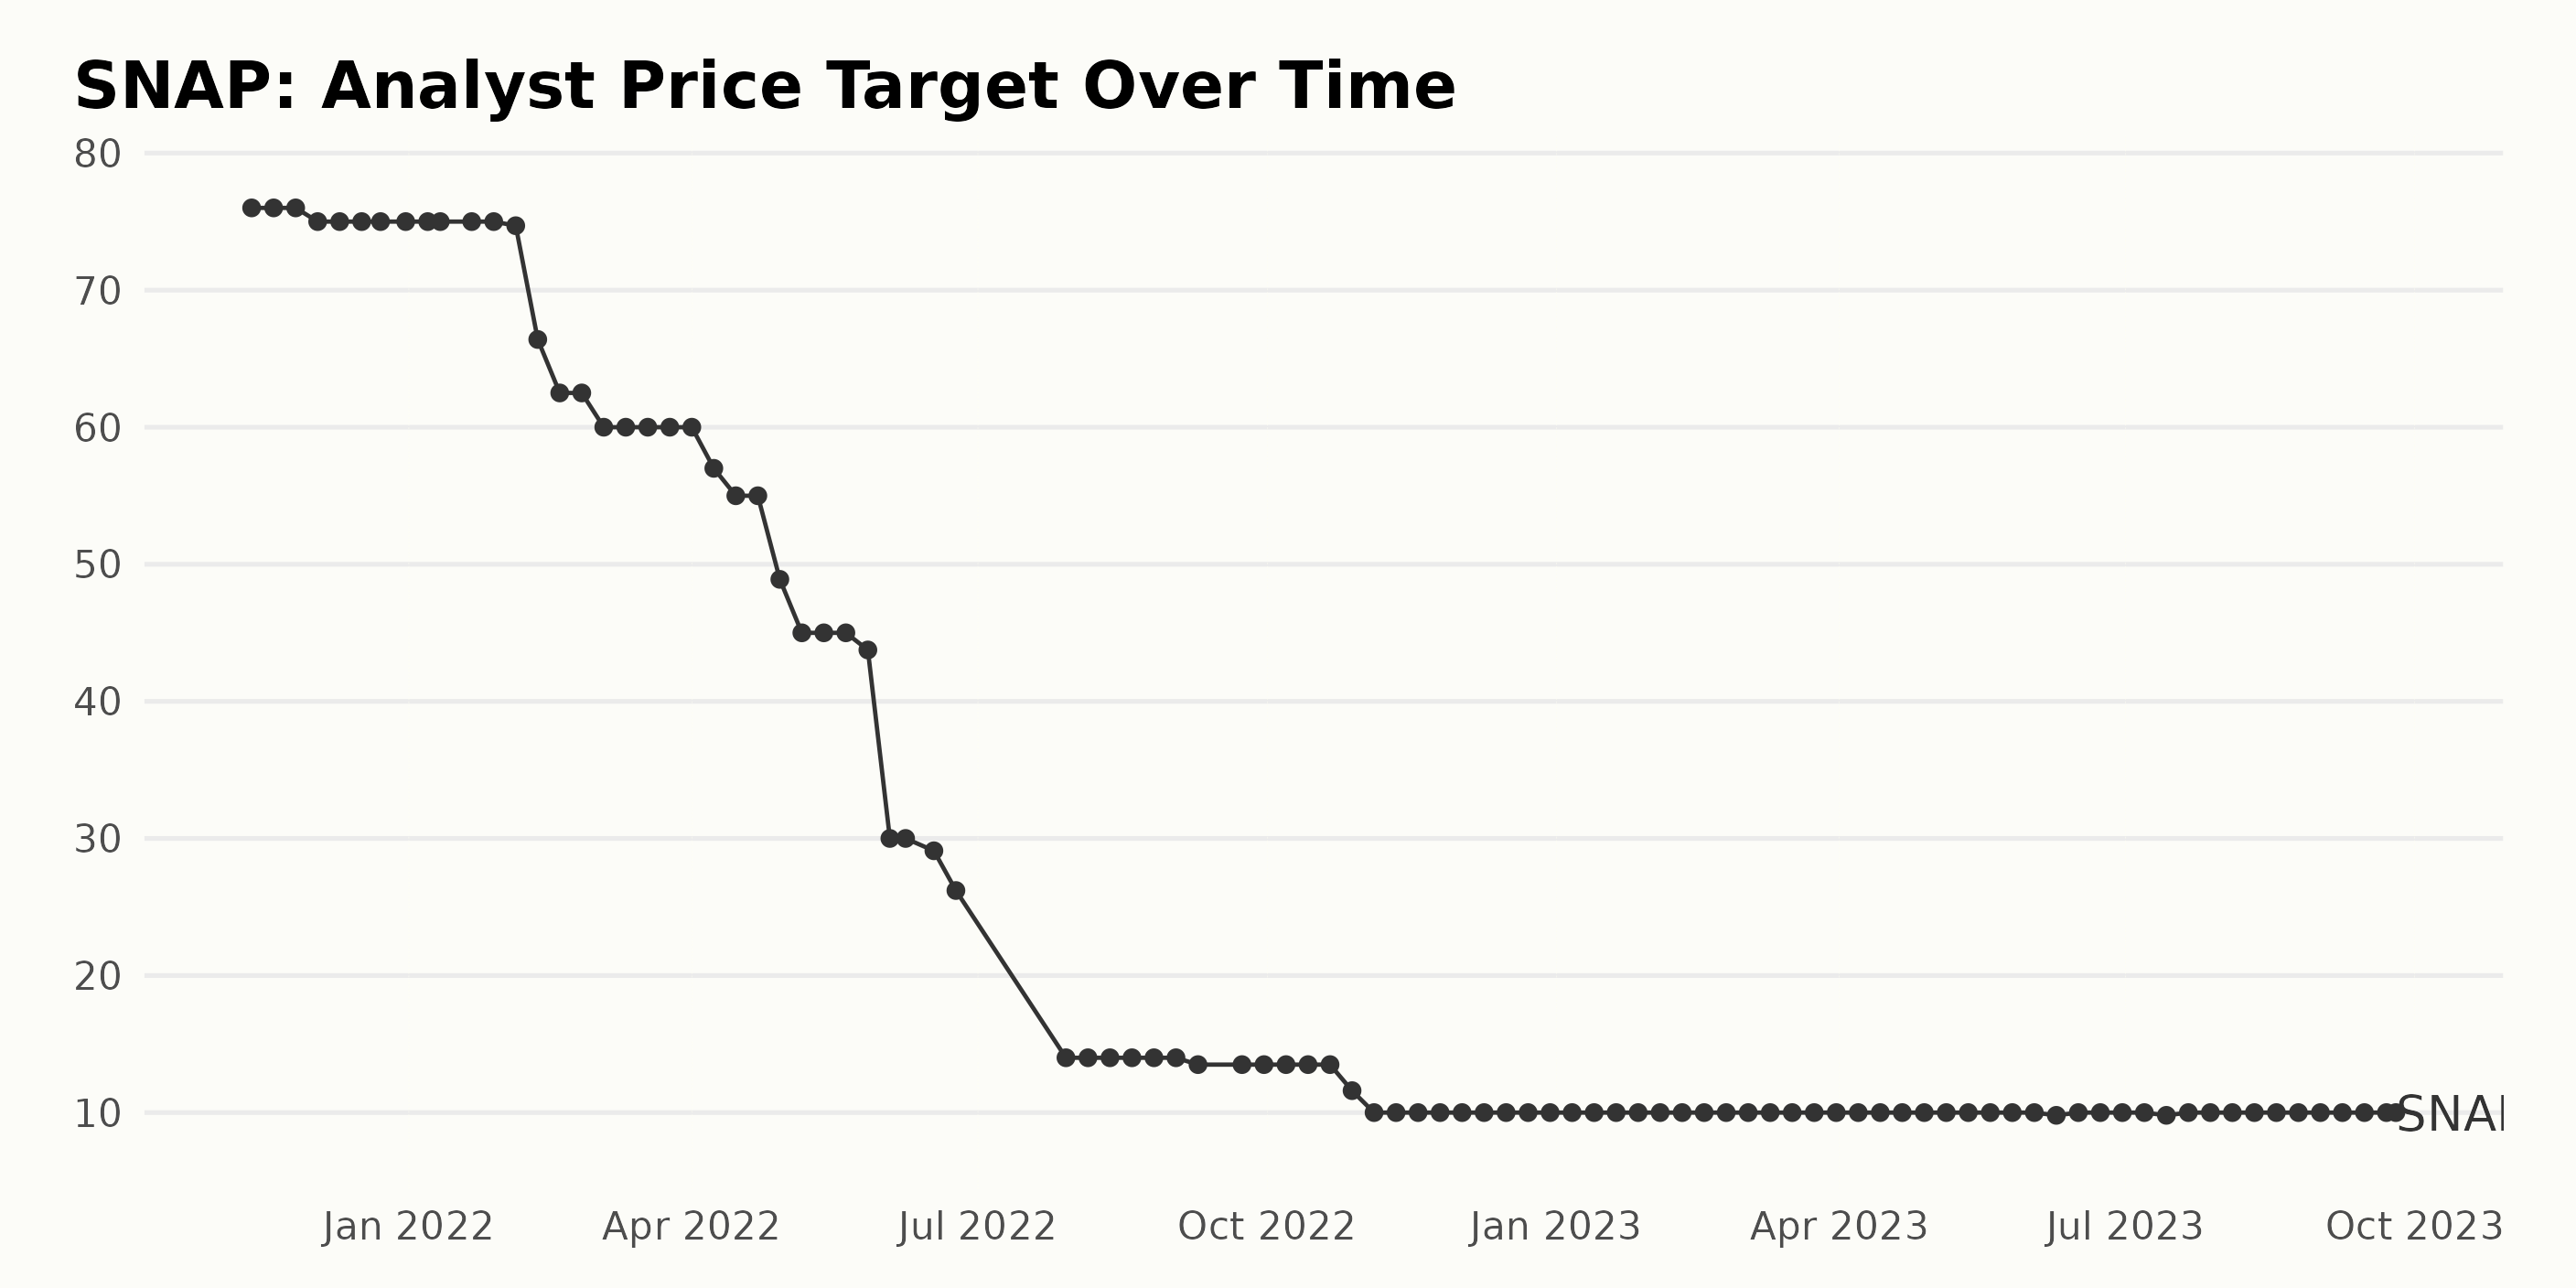
The analyst price target for SNAP exhibits a continual downtrend over the given period, with several periods of stability:
- Starting from $76 on November 12, 2021, the price is relatively stable until a mild decrease to $75 in December 2021, which stayed until the end of January 2022.
- Subsequently, the target price experienced fluctuations with notable drops approx. Monthly, hitting $60 in March 2022 and remaining there until a drop to 55 in mid-April 2022.
- The noticeable decreases continued, with the price reaching a critical low of $14 by July 29, 2022, where it remained stable until a slight drop to $13.5 in September 2022.
- There was a sharp decline to $10 in mid-November 2022, where it had mostly remained, with small changes observed in mid-2023, when it dipped slightly to $9.8 but quickly rose back to $10.
The overall decline, measured from the first value to the last, signifies a negative growth rate. This persistent decrease in the analyst price target could indicate underlying challenges or changes within the business structure of SNAP or shifts in market perception towards this asset. While there is momentary steadiness in the target price at various stages, the general trend is definitively downwards over this timeline.
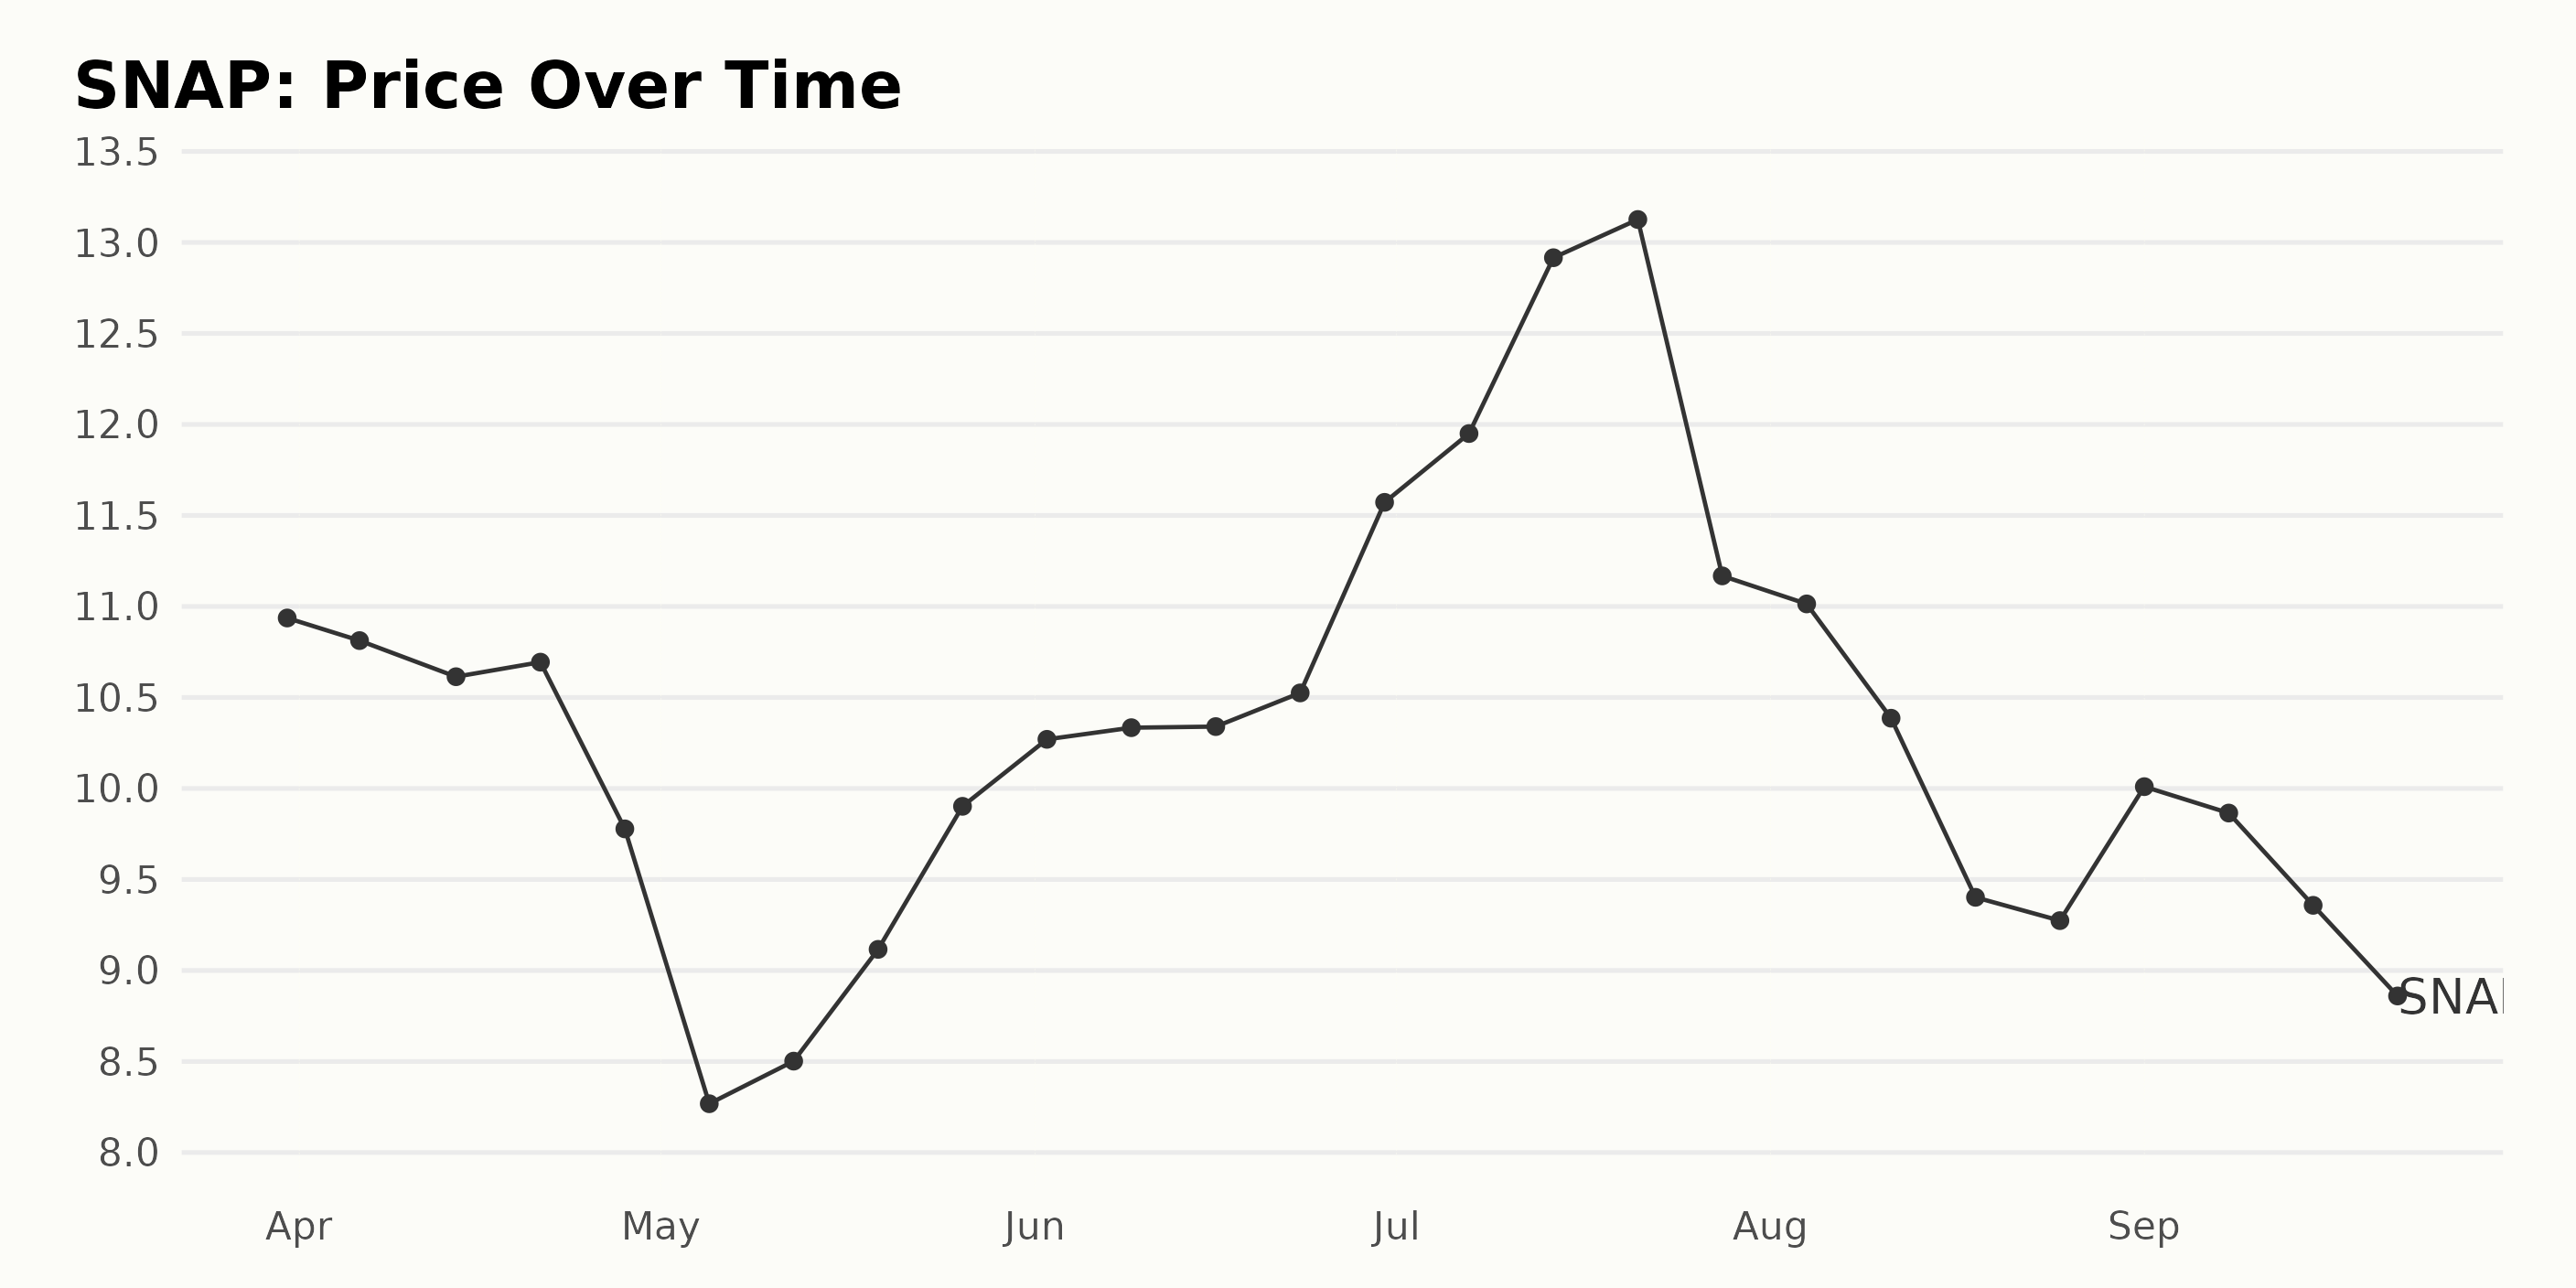
Snap Inc.'s Share Price Rollercoaster: A Detailed Look from March to September 2023
Based on the provided data, SNAP experienced fluctuation in its share price from March 2023 to September 2023, ranging from $8.27 to $13.13.
- By the end of March 2023, the share price stood at $10.94.
- In April, the share price initially dropped slightly from $10.81 to $9.78.
- There was a more drastic decrease in May, with the lowest recorded price in this period being $8.27 on May 5, 2023. However, an increasing trend began toward the end of the month as it closed at $9.90.
- June then saw a consistent acceleration in the price, covering a range from $10.27 to $11.57.
- In July, SNAP experienced its peak price of $13.13 on July 21, 2023.
- The trend then sharply turned negative, rapidly decreasing in value until the end of August, reaching $9.27.
- September also experienced a consistent but slight decrease in price, ending at $8.69.
Summarily, despite fluctuations, the overriding trend of SNAP's share price from March to September 2023 is a clear and steep deceleration in growth rate. Here is a chart of SNAP's price over the past 180 days.
Assessing Snap Inc.'s Performance: A Deep Dive into Value, Momentum, and Growth
The POWR Ratings grade for SNAP has been largely consistent throughout these months, it was observed.
- In April 2023, SNAP had a POWR grade of D (Sell), with its rank in the Internet stocks category hovering around #55-#56.
- There was a slight improvement in May 2023, as its rank rose to #50 by mid-month while maintaining the D (Sell) grade. By the end of May, the rank dropped marginally to #52.
- The trend continued into June and the first week of July 2023, with the Internet stock ranking fluctuating between #53 and #54.
- A slight improvement once again showed in mid-July as the ranking went to #52. However, by the end of July, it returned to rank #53.
- August witnessed a downward trend for SNAP as ranking in the category of Internet stocks dropped to #56 and maintained a D (Sell) grade.
- September 2023 shows an even more prominent dip as the ranking further climbed to #57 while the grade has remained D (Sell).
The most recent data from September 25, 2023, reveals that SNAP held a D (Sell) POWR grade, with it being ranked #57 among the 58 Internet stocks.
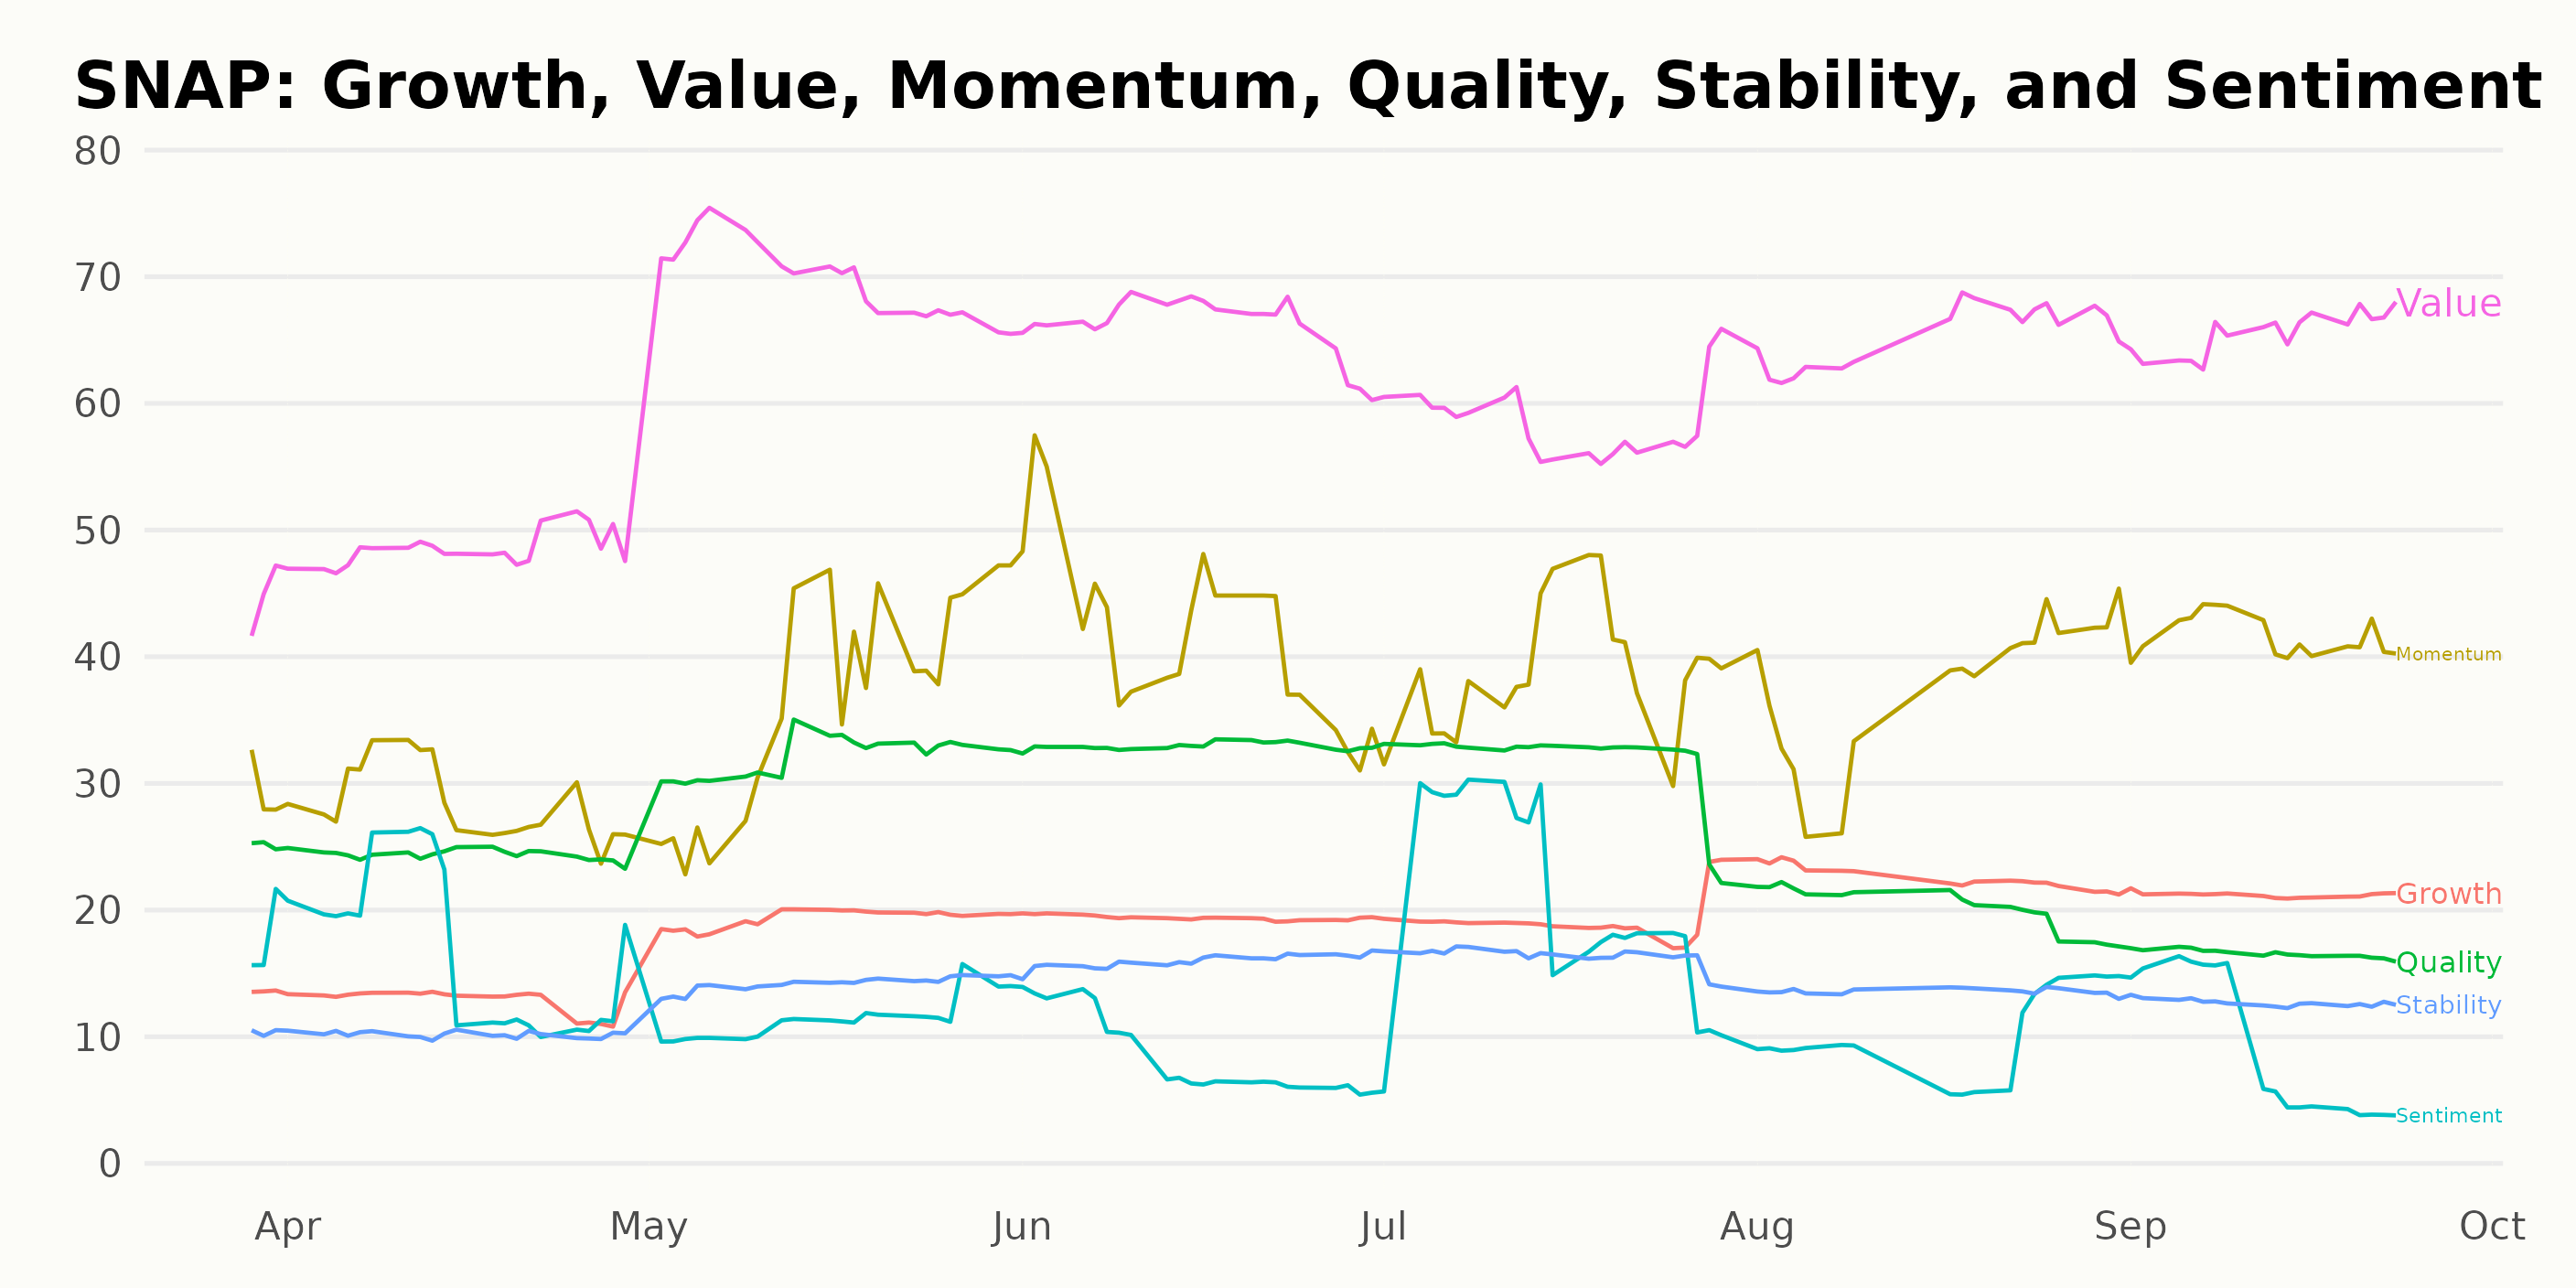
In the POWR Ratings for SNAP, three dimensions have stood out in terms of their notable values - Value, Momentum, and Growth.
- Value: The Value dimension has consistently shown the highest ratings across the periods. For instance, the value rating was at 45 in March 2023 and rose significantly to peak at 70 in May 2023. Despite fluctuating afterward, it remained relatively high, maintaining a score of 65 as of August 2023 and 66 in September 2023.
- Momentum: The Momentum rating presents a clear upward trend across the timeline. Starting from 30 in March 2023, this dimension rose to reach 42 by June 2023, dipped slightly to 38 in August, and bounced back to 42 again in September 2023.
- Growth: The Growth dimension also displayed an increasing trend overall. From a score of 14 in March 2023, it gradually increased and reached a score of 23 in August 2023 before dipping down to 21 in September 2023.
These three dimensions indicate a generally favorable situation for SNAP over the measured period, although specific aspects such as the company's actual performance and events occurring during this period should also be considered.
How does Snap Inc. (SNAP) Stack Up Against its Peers?
Other stocks in the Internet sector that may be worth considering are Yelp Inc. (YELP), Travelzoo (TZOO), and Despegar.com Corp. (DESP) - they have better POWR Ratings. Click here to explore other stocks in the Internet sector.
What To Do Next?
Get your hands on this special report with 3 low priced companies with tremendous upside potential even in today’s volatile markets:
3 Stocks to DOUBLE This Year >
SNAP shares were trading at $8.63 per share on Monday afternoon, down $0.06 (-0.69%). Year-to-date, SNAP has declined -3.58%, versus a 14.19% rise in the benchmark S&P 500 index during the same period.
About the Author: Anushka Dutta

Anushka is an analyst whose interest in understanding the impact of broader economic changes on financial markets motivated her to pursue a career in investment research.
The post Buy, Sell or Hold Before October: Snap (SNAP) appeared first on StockNews.com