
Consumer financial services company Synchrony Financial (NYSE: SYF) fell short of the market’s revenue expectations in Q2 CY2026, with sales falling 34.7% year on year to $2.38 billion. Its GAAP profit of $2.59 per share was 21.4% above analysts’ consensus estimates.
Is now the time to buy Synchrony Financial? Find out by accessing our full research report, it’s free.
Synchrony Financial (SYF) Q2 CY2026 Highlights:
- Net Interest Income: $4.61 billion vs analyst estimates of $4.76 billion
- Net Interest Margin: 15.1% vs analyst estimates of 15.2% (15.4 basis point miss)
- Revenue: $2.38 billion vs analyst estimates of $3.74 billion (34.7% year-on-year decline, 36.4% miss)
- Efficiency Ratio: 35.8% vs analyst estimates of 34.6% (117.1 basis point miss)
- EPS (GAAP): $2.59 vs analyst estimates of $2.13 (21.4% beat)
- Tangible Book Value per Share: $42.01 vs analyst estimates of $38.56 (14.9% year-on-year growth, 8.9% beat)
- Market Capitalization: $24.69 billion
Company Overview
Powering over 73 million active accounts and partnerships with major brands like Amazon, PayPal, and Lowe's, Synchrony Financial (NYSE: SYF) provides credit cards, installment loans, and banking products through partnerships with retailers, healthcare providers, and digital platforms.
Revenue Growth
A company’s long-term sales performance can indicate its overall quality. Any business can experience short-term success, but top-performing ones enjoy sustained growth for years. Over the last five years, Synchrony Financial grew its revenue at a tepid 5.7% compounded annual growth rate. This wasn’t a great result compared to the rest of the financials sector, but there are still things to like about Synchrony Financial.
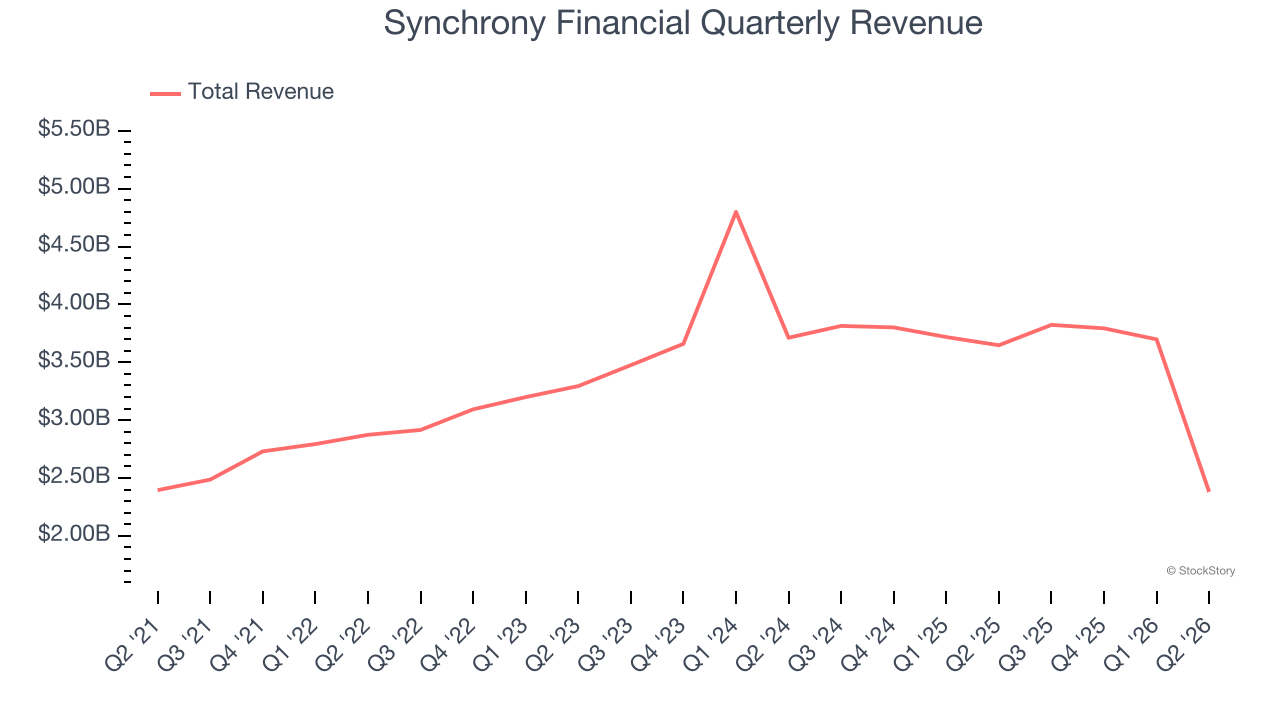
We at StockStory place the most emphasis on long-term growth, but within financials, a half-decade historical view may miss recent interest rate changes, market returns, and industry trends. Synchrony Financial’s performance shows it grew in the past but relinquished its gains over the last two years, as its revenue fell by 6.4% annually. 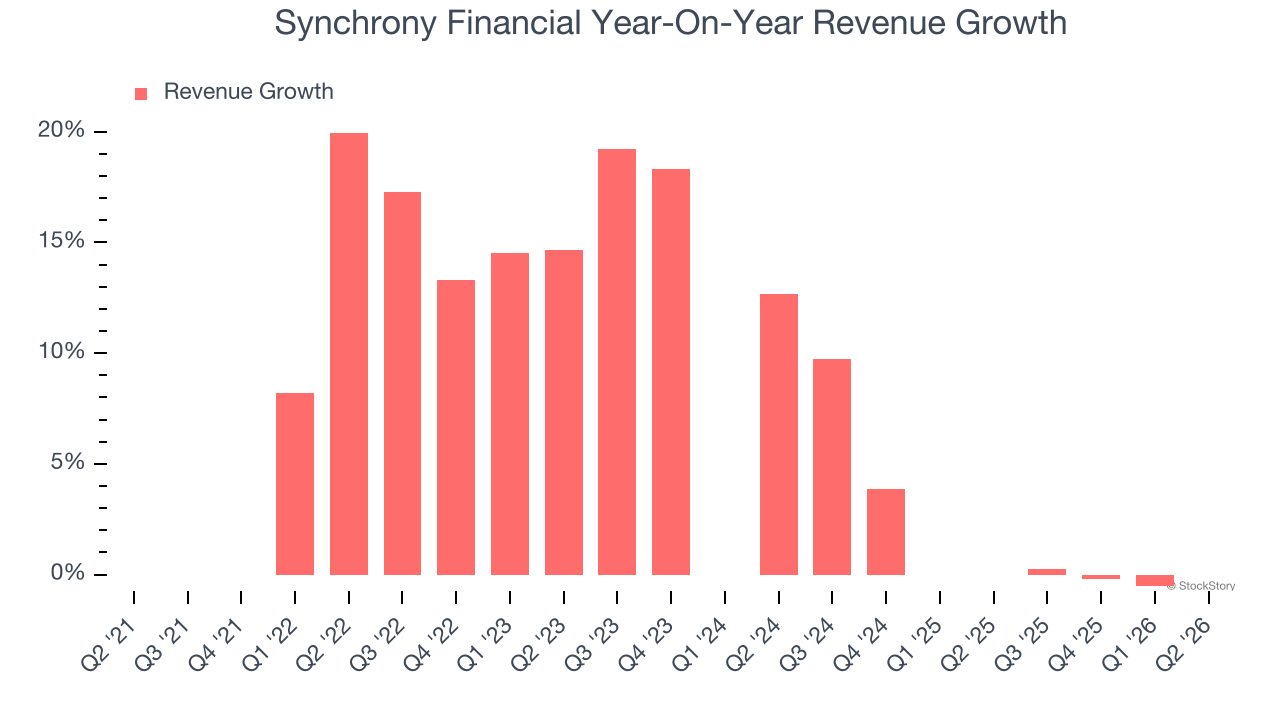 Note: Quarters not shown were determined to be outliers because they were impacted by outsized investment gains/losses that are not indicative of the recurring fundamentals of the business.
This quarter, Synchrony Financial missed Wall Street’s estimates and reported a rather uninspiring 34.7% year-on-year revenue decline, generating $2.38 billion of revenue.
ALSO WORTH WATCHING: Nvidia’s Quiet Partner. Nvidia’s chips cost a hundred grand. The connectors that make them work cost even more. One company makes them all.
Every AI server needs specialized infrastructure the chip companies don’t make. High-speed cables. Power connectors. Thermal sensors. This 90-year-old company built a monopoly on it. The AI boom just started. This stock is still flying under the radar. Claim The Stock Ticker Here for FREE.
Tangible Book Value Per Share (TBVPS)
The balance sheet drives profitability for financial firms since earnings flow from managing diverse assets and liabilities across multiple business lines. As such, valuations for these companies concentrate on capital strength and sustainable equity accumulation potential across their varied operations.
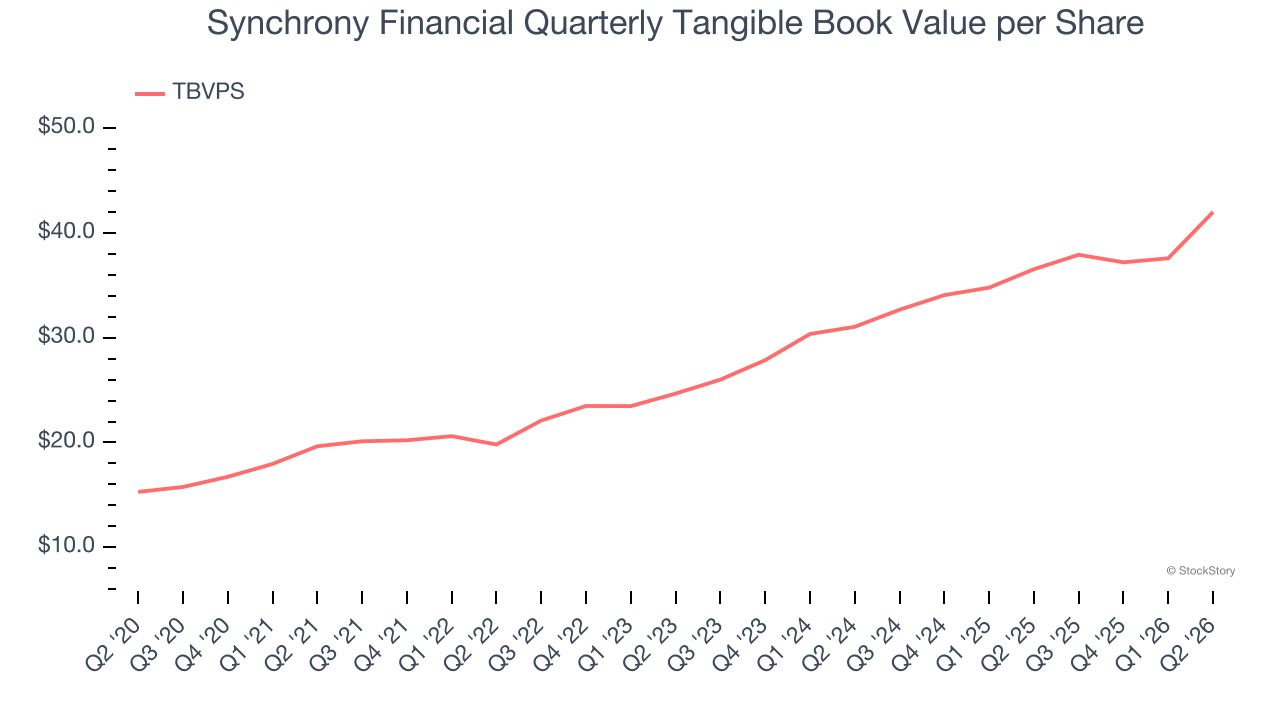
This is why we consider tangible book value per share (TBVPS) an important metric for the sector. TBVPS represents the real net worth per share across all business segments, providing a clear measure of shareholder equity regardless of the complexity of operations. On the other hand, EPS is often distorted by the diverse nature of operations, mergers, and various accounting treatments across different business units. Book value provides clearer performance insights.
Synchrony Financial’s TBVPS grew at an excellent 16.4% annual clip over the last five years. The last two years show a similar trajectory as TBVPS grew by 16.3% annually from $31.05 to $42.01 per share.
Tangible Book Value Per Share (TBVPS)
Financial institutions manage complex balance sheets spanning various financial activities. Valuations reflect this complexity, emphasizing balance sheet quality and long-term book value compounding across multiple revenue streams.
Because of this, tangible book value per share (TBVPS) emerges as the critical performance benchmark for the sector. This metric captures real, liquid net worth per share that reflects the institution’s overall financial health across all business lines. Traditional metrics like EPS are helpful but face distortion from the complexity of diversified operations, M&A activity, and various accounting rules that can obscure true performance across multiple business lines.
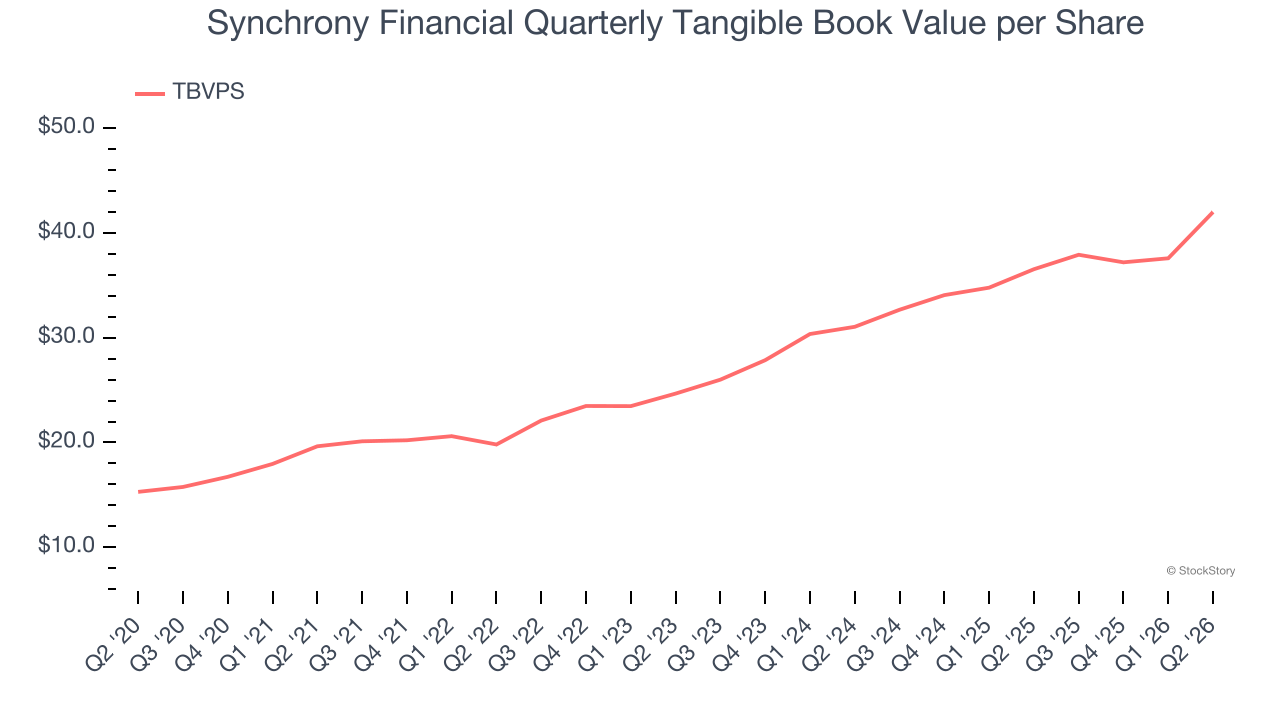
Synchrony Financial’s TBVPS grew at an excellent 16.4% annual clip over the last five years. The last two years show a similar trajectory as TBVPS grew by 16.3% annually from $31.05 to $42.01 per share.
Key Takeaways from Synchrony Financial’s Q2 Results
It was good to see Synchrony Financial beat analysts’ EPS expectations this quarter. We were also happy its efficiency ratio outperformed Wall Street’s estimates. On the other hand, its net interest margin missed and its net interest income fell short of Wall Street’s estimates. Overall, this was a weaker quarter. The stock traded down 1.6% to $72.20 immediately after reporting.
So should you invest in Synchrony Financial right now? When making that decision, it’s important to consider its valuation, business qualities, as well as what has happened in the latest quarter. We cover that in our actionable full research report which you can read here (it’s free).