
Title insurance company Fidelity National Financial (NYSE: FNF) fell short of the market’s revenue expectations in Q1 CY2026, but sales rose 18.2% year on year to $3.23 billion. Its non-GAAP profit of $0.93 per share was 14.7% below analysts’ consensus estimates.
Is now the time to buy Fidelity National Financial? Find out by accessing our full research report, it’s free.
Fidelity National Financial (FNF) Q1 CY2026 Highlights:
- Revenue: $3.23 billion vs analyst estimates of $3.61 billion (18.2% year-on-year growth, 10.7% miss)
- Pre-tax Profit: $498 million (15.4% margin)
- Adjusted EPS: $0.93 vs analyst expectations of $1.09 (14.7% miss)
- Market Capitalization: $13.88 billion
Chris Blunt, F&G's Chief Executive Officer, commented, "The first quarter was a solid start to the year, highlighted by record assets under management before reinsurance of nearly $75 billion fueled by $3.2 billion of gross sales in the quarter, including $2 billion of core sales from indexed annuities, indexed universal life and pension risk transfer, and $1.2 billion of opportunistic funding agreements and multiyear guaranteed annuities. Our high quality, diversified investment portfolio continues to perform extremely well, including our private origination portfolio, with total credit-related impairments stable and below our pricing assumptions."
Company Overview
Issuing more title insurance policies than any other company in the United States, Fidelity National Financial (NYSE: FNF) provides title insurance and escrow services for real estate transactions while also offering annuities and life insurance through its F&G subsidiary.
Revenue Growth
Insurance companies earn revenue from three primary sources: 1) The core insurance business itself, often called underwriting and represented in the income statement as premiums 2) Income from investing the “float” (premiums collected upfront not yet paid out as claims) in assets such as fixed-income assets and equities 3) Fees from various sources such as policy administration, annuities, or other value-added services. Over the last five years, Fidelity National Financial grew its revenue at a sluggish 4% compounded annual growth rate. This was below our standard for the insurance sector and is a rough starting point for our analysis.
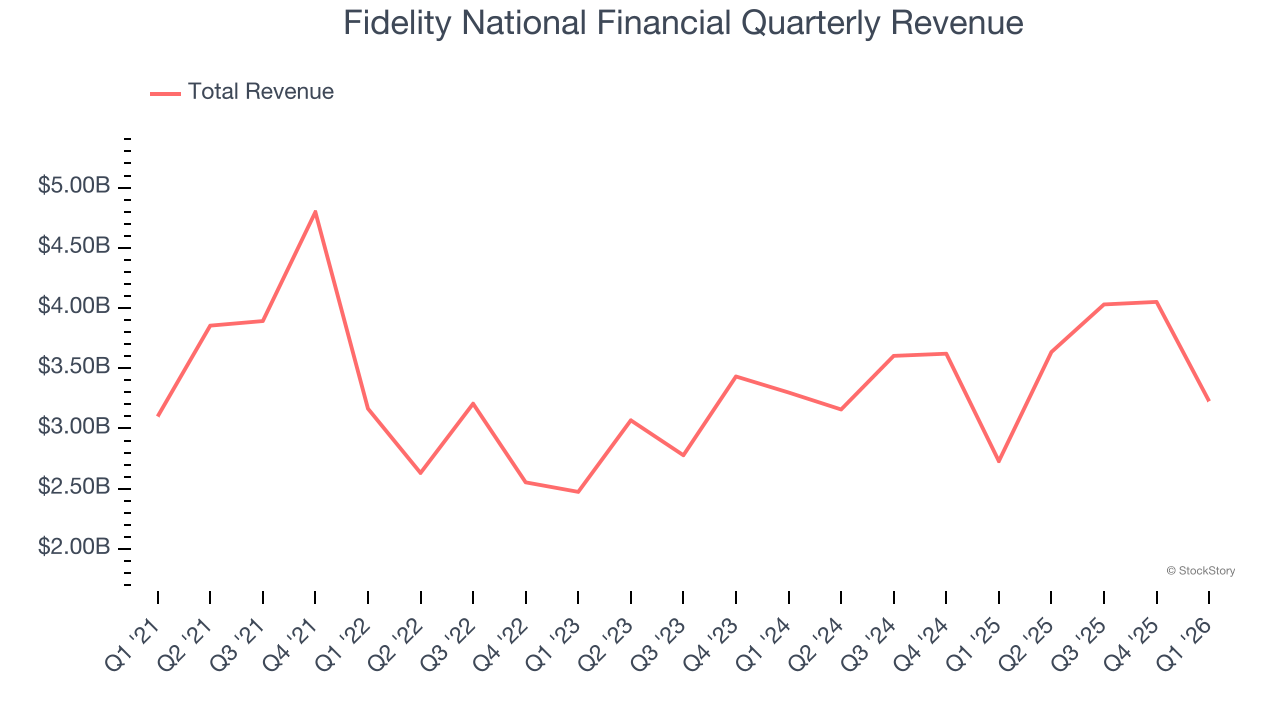
We at StockStory place the most emphasis on long-term growth, but within financials, a half-decade historical view may miss recent interest rate changes, market returns, and industry trends. Fidelity National Financial’s annualized revenue growth of 9% over the last two years is above its five-year trend, suggesting some bright spots. 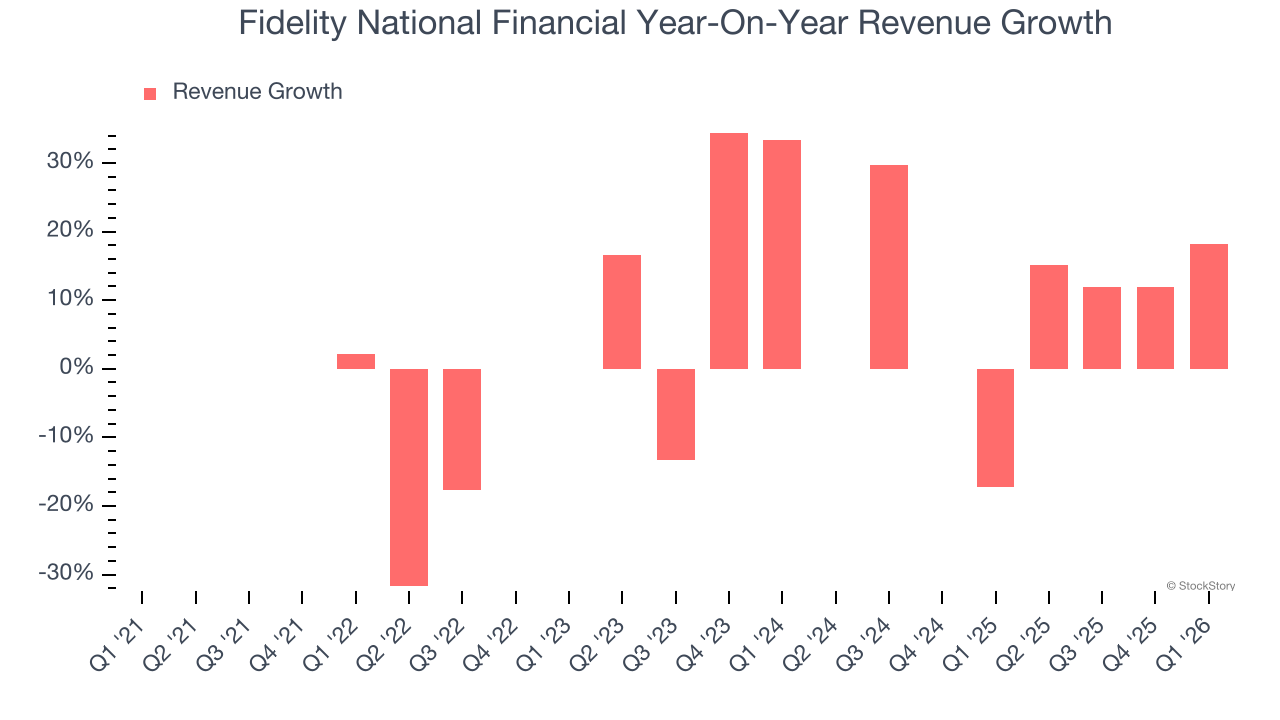 Note: Quarters not shown were determined to be outliers, impacted by outsized investment gains/losses that are not indicative of the recurring fundamentals of the business.
This quarter, Fidelity National Financial’s revenue grew by 18.2% year on year to $3.23 billion but fell short of Wall Street’s estimates.
Net premiums earned made up 45.6% of the company’s total revenue during the last five years, meaning Fidelity National Financial’s growth drivers strike a balance between insurance and non-insurance activities.
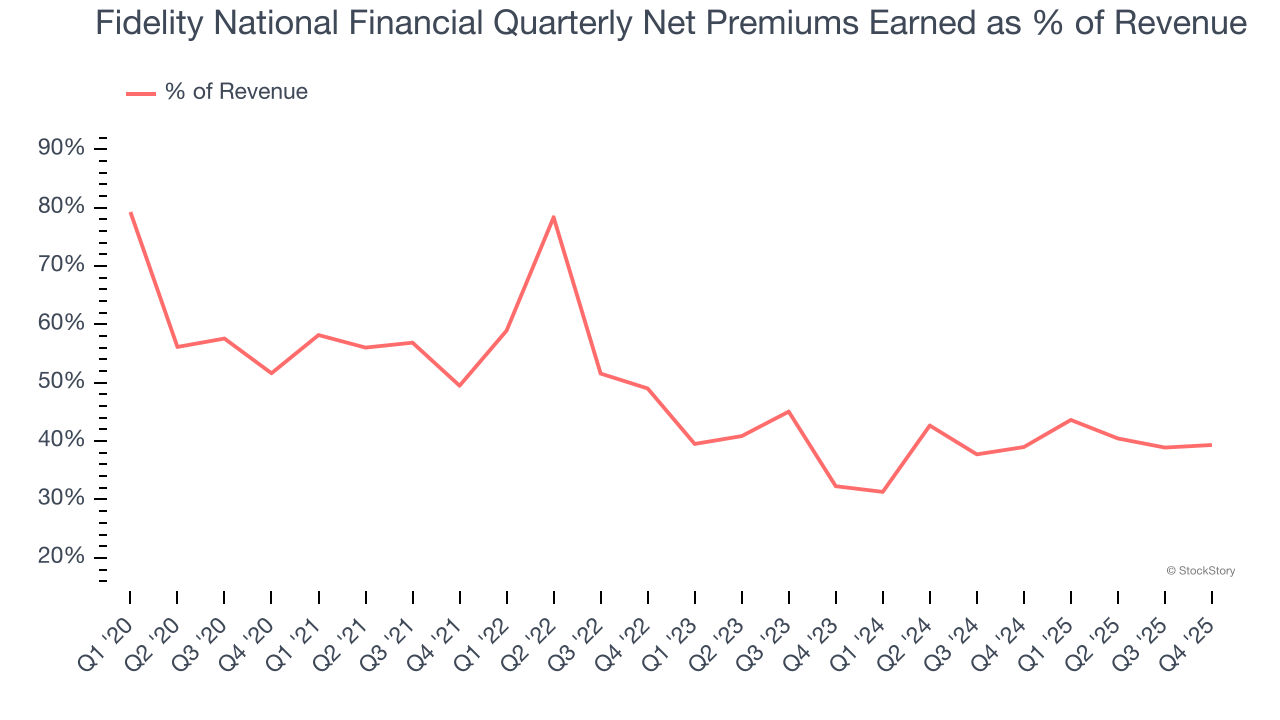
Our experience and research show the market cares primarily about an insurer’s net premiums earned growth as investment and fee income are considered more susceptible to market volatility and economic cycles.
ONE MORE THING: The $21 AI Application Stock Wall Street Forgot. While Wall Street obsesses over who’s building AI, one company is already using it to print money. And nobody’s paying attention.
AI chip stocks trade at ridiculous valuations. This company processes a trillion consumer signals monthly using AI and trades at a third of the price. The gap won’t last. The institutions will figure it out. You need to see this first. Read the FREE Report Before They Notice.
Net Premiums Earned
Insurers sell policies then use reinsurance (insurance for insurance companies) to protect themselves from large losses. Net premiums earned are therefore what's collected from selling policies less what’s paid to reinsurers as a risk mitigation tool.
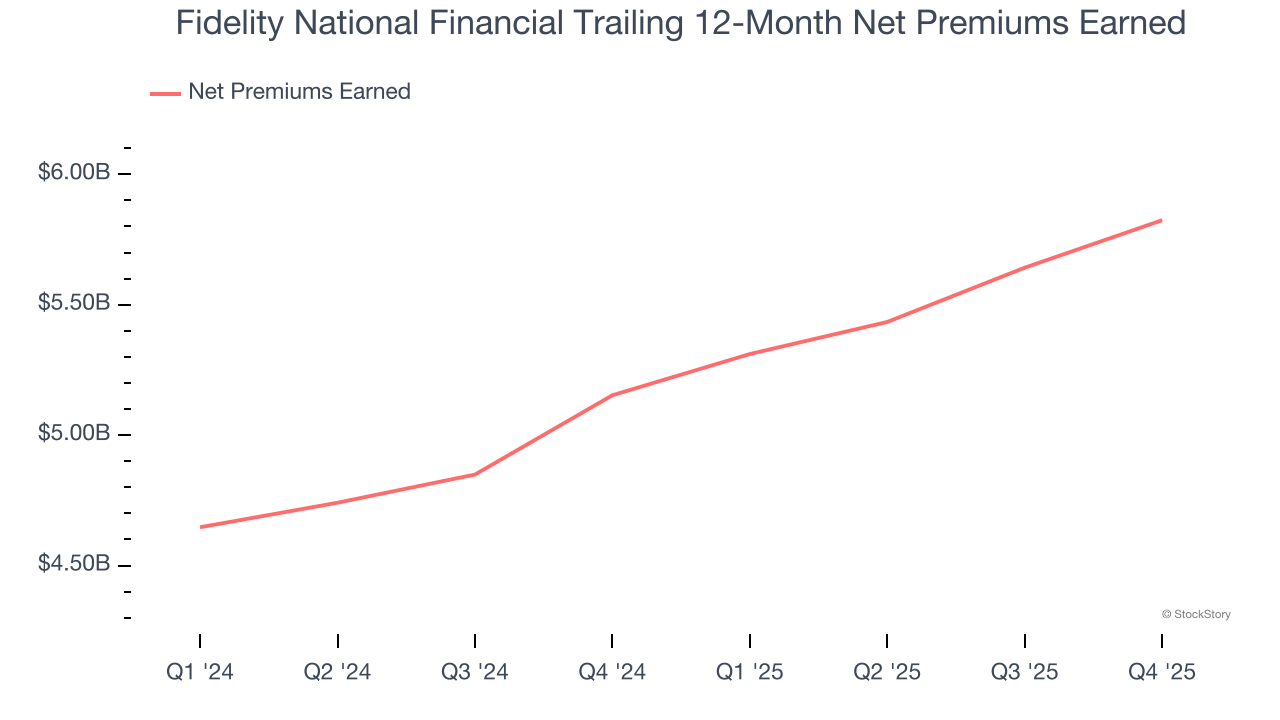
Fidelity National Financial’s net premiums earned has declined by 1.6% annually over the last five years, much worse than the broader insurance industry. This shows that policy underwriting underperformed its other business lines.
When analyzing Fidelity National Financial’s net premiums earned over the last two years, we can see that growth accelerated to 13.2% annually. Since two-year net premiums earned grew faster than total revenue over this period, it's implied that other line items such as investment income grew at a slower rate. These extra revenue streams are important to the bottom line, yet their performance can be inconsistent. Some firms have been more successful and consistent in managing their float, but sharp fluctuations in the fixed income and equity markets can dramatically affect short-term results.
Key Takeaways from Fidelity National Financial’s Q1 Results
We struggled to find many positives in these results. Its revenue missed and its EPS fell short of Wall Street’s estimates. Overall, this was a softer quarter. The stock traded down 3.7% to $49.40 immediately following the results.
Fidelity National Financial may have had a tough quarter, but does that actually create an opportunity to invest right now? What happened in the latest quarter matters, but not as much as longer-term business quality and valuation, when deciding whether to invest in this stock. We cover that in our actionable full research report which you can read here (it’s free).