
Life sciences company Neogen (NASDAQ: NEOG) reported Q1 CY2026 results topping the market’s revenue expectations, but sales fell by 4.4% year on year to $211.2 million. The company’s full-year revenue guidance of $858.5 million at the midpoint came in 0.9% above analysts’ estimates. Its non-GAAP profit of $0.09 per share was 68.8% above analysts’ consensus estimates.
Is now the time to buy Neogen? Find out by accessing our full research report, it’s free.
Neogen (NEOG) Q1 CY2026 Highlights:
- Revenue: $211.2 million vs analyst estimates of $204.3 million (4.4% year-on-year decline, 3.4% beat)
- Adjusted EPS: $0.09 vs analyst estimates of $0.05 (68.8% beat)
- Adjusted EBITDA: $48.2 million vs analyst estimates of $40.71 million (22.8% margin, 18.4% beat)
- The company slightly lifted its revenue guidance for the full year to $858.5 million at the midpoint from $850 million
- EBITDA guidance for the full year is $175 million at the midpoint, above analyst estimates of $170.8 million
- Operating Margin: -1.6%, down from 2.5% in the same quarter last year
- Free Cash Flow was $11.07 million, up from -$13.51 million in the same quarter last year
- Market Capitalization: $2.25 billion
Company Overview
Founded in 1981 and operating at the intersection of food safety and animal health, Neogen (NASDAQ: NEOG) develops and manufactures diagnostic tests and related products to detect dangerous substances in food and pharmaceuticals for animal health.
Revenue Growth
A company’s long-term sales performance can indicate its overall quality. Any business can put up a good quarter or two, but the best consistently grow over the long haul. Luckily, Neogen’s sales grew at a solid 14.1% compounded annual growth rate over the last five years. Its growth beat the average healthcare company and shows its offerings resonate with customers.
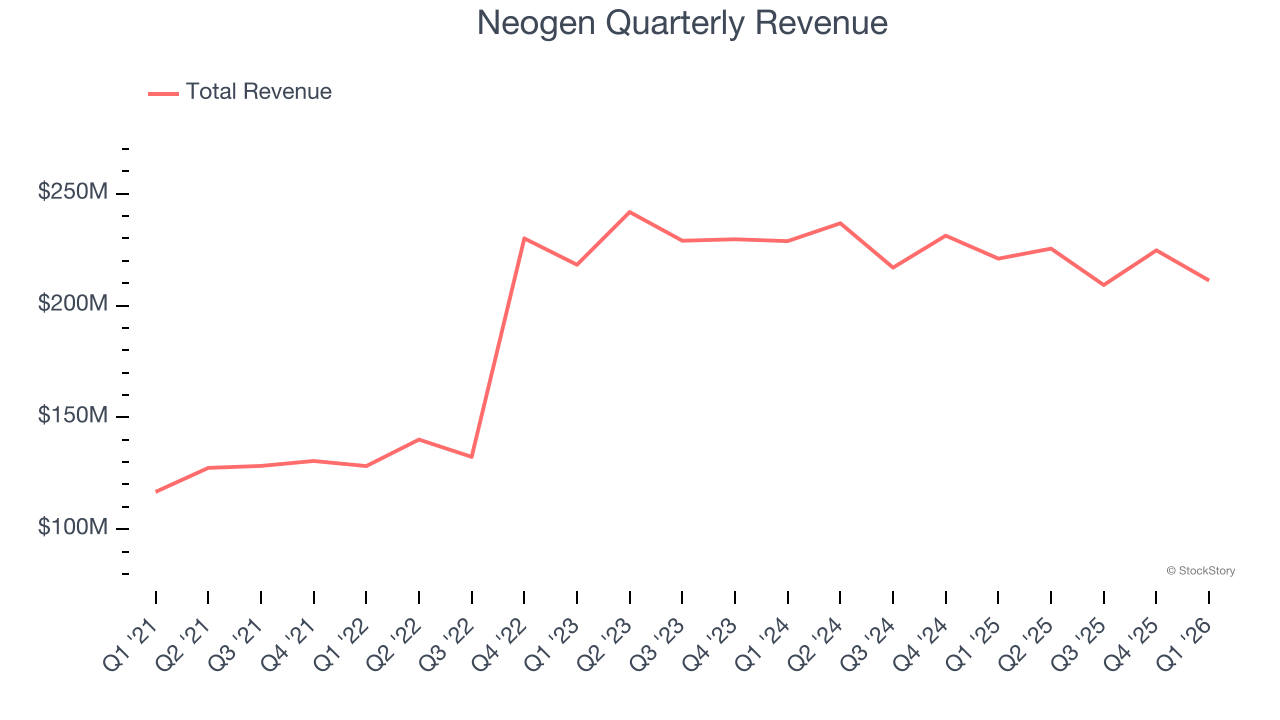
We at StockStory place the most emphasis on long-term growth, but within healthcare, a half-decade historical view may miss recent innovations or disruptive industry trends. Neogen’s recent performance marks a sharp pivot from its five-year trend as its revenue has shown annualized declines of 3.2% over the last two years. 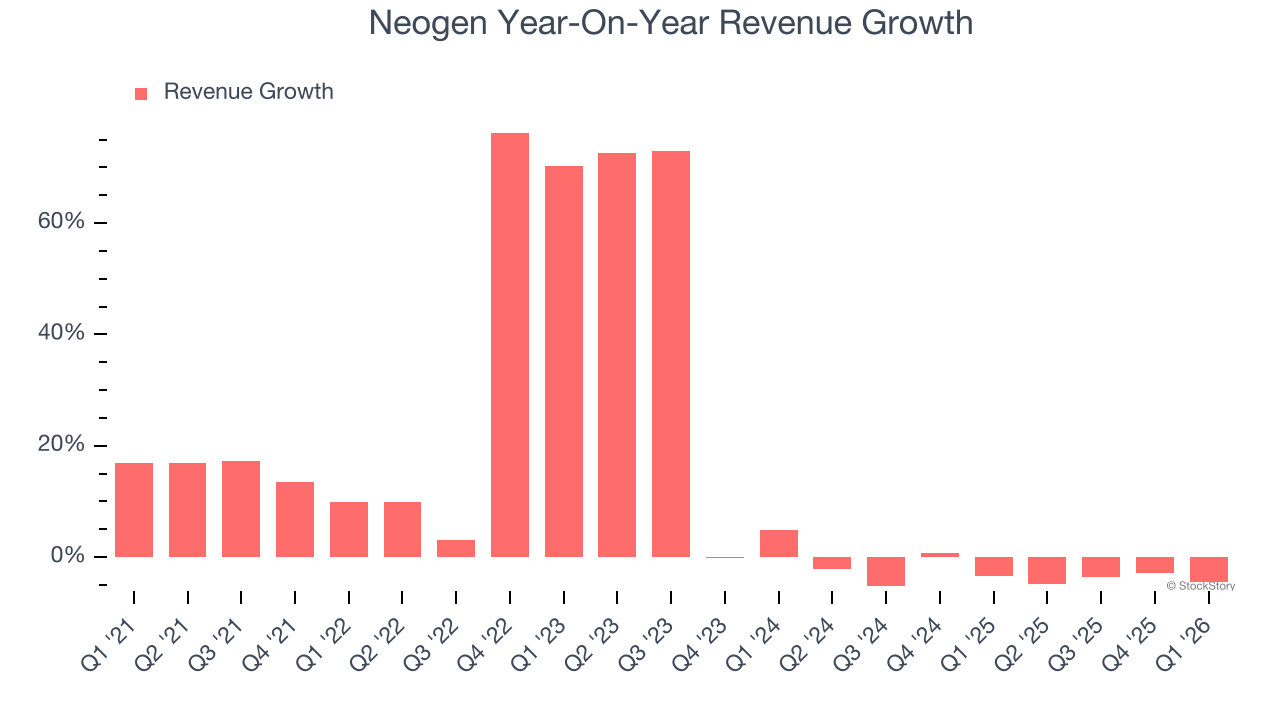
This quarter, Neogen’s revenue fell by 4.4% year on year to $211.2 million but beat Wall Street’s estimates by 3.4%.
Looking ahead, sell-side analysts expect revenue to decline by 1.2% over the next 12 months. While this projection is better than its two-year trend, it’s hard to get excited about a company that is struggling with demand.
WHILE YOU’RE HERE: The Next Palantir? One satellite company captures images of every point on Earth. Every single day. The Pentagon wants it. Hedge funds are using it to beat earnings. You’ve probably never heard of it.
This is what the early days of Palantir looked like before it became a $437 billion giant. Same playbook. Different technology. If you missed Palantir, you need to see this. Claim The Stock Ticker for Free HERE.
Adjusted Operating Margin
Although Neogen was profitable this quarter from an operational perspective, it’s generally struggled over a longer time period. Its expensive cost structure has contributed to an average adjusted operating margin of negative 22% over the last five years. Unprofitable healthcare companies require extra attention because they could get caught swimming naked when the tide goes out. It’s hard to trust that the business can endure a full cycle.
Looking at the trend in its profitability, Neogen’s adjusted operating margin decreased by 79.7 percentage points over the last five years. The company’s two-year trajectory also shows it failed to get its profitability back to the peak as its margin fell by 75.3 percentage points. This performance was poor no matter how you look at it - it shows its expenses were rising and it couldn’t pass those costs onto its customers.
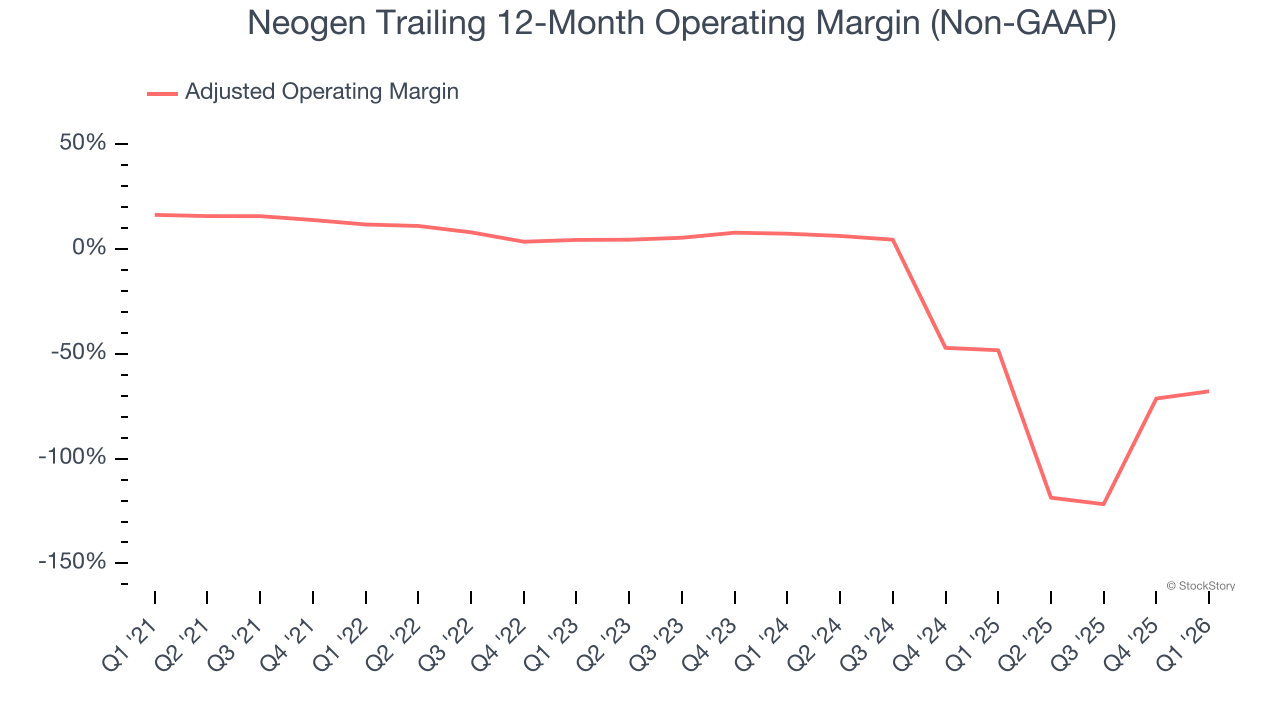
In Q1, Neogen generated an adjusted operating margin profit margin of 20%, up 17.5 percentage points year on year. This increase was a welcome development, especially since its revenue fell, showing it was more efficient because it scaled down its expenses.
Earnings Per Share
Revenue trends explain a company’s historical growth, but the long-term change in earnings per share (EPS) points to the profitability of that growth – for example, a company could inflate its sales through excessive spending on advertising and promotions.
Sadly for Neogen, its EPS declined by 13.6% annually over the last five years while its revenue grew by 14.1%. However, its adjusted operating margin actually improved during this time, telling us that non-fundamental factors such as interest expenses and taxes affected its ultimate earnings.
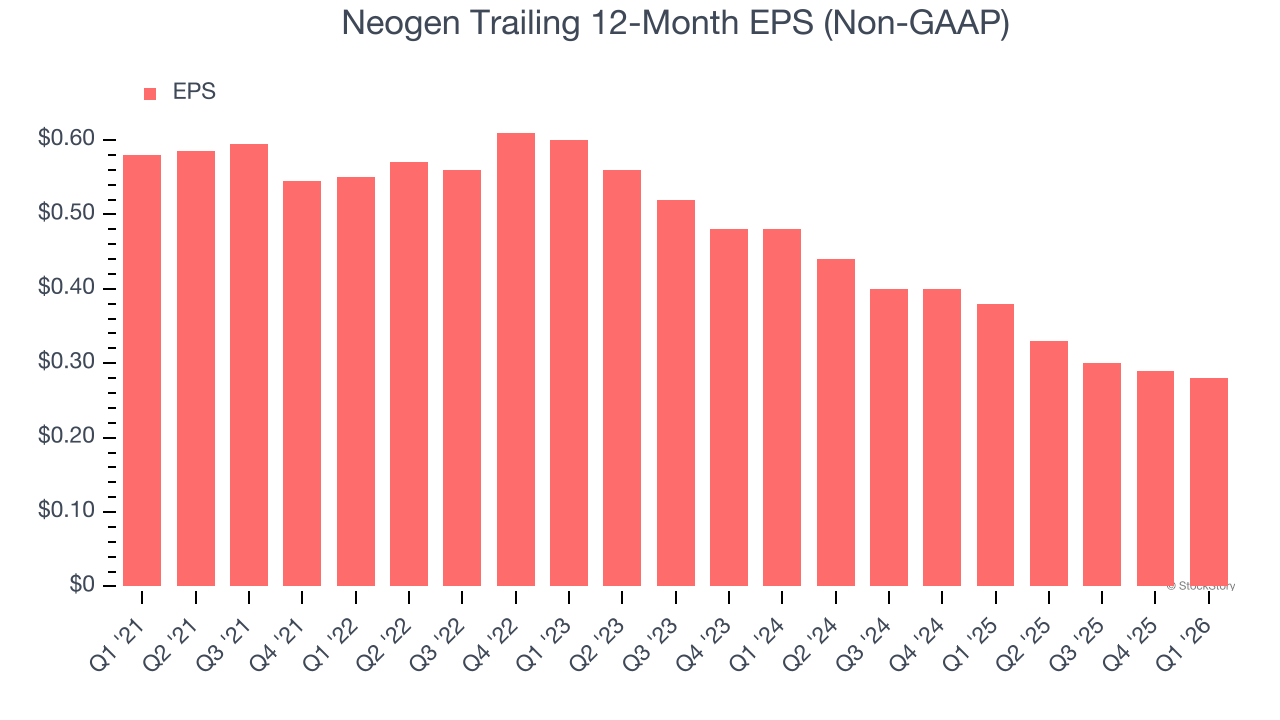
Diving into the nuances of Neogen’s earnings can give us a better understanding of its performance. As we mentioned earlier, Neogen’s adjusted operating margin expanded this quarter but declined by 79.7 percentage points over the last five years. Its share count also grew by 103%, meaning the company not only became less efficient with its operating expenses but also diluted its shareholders. 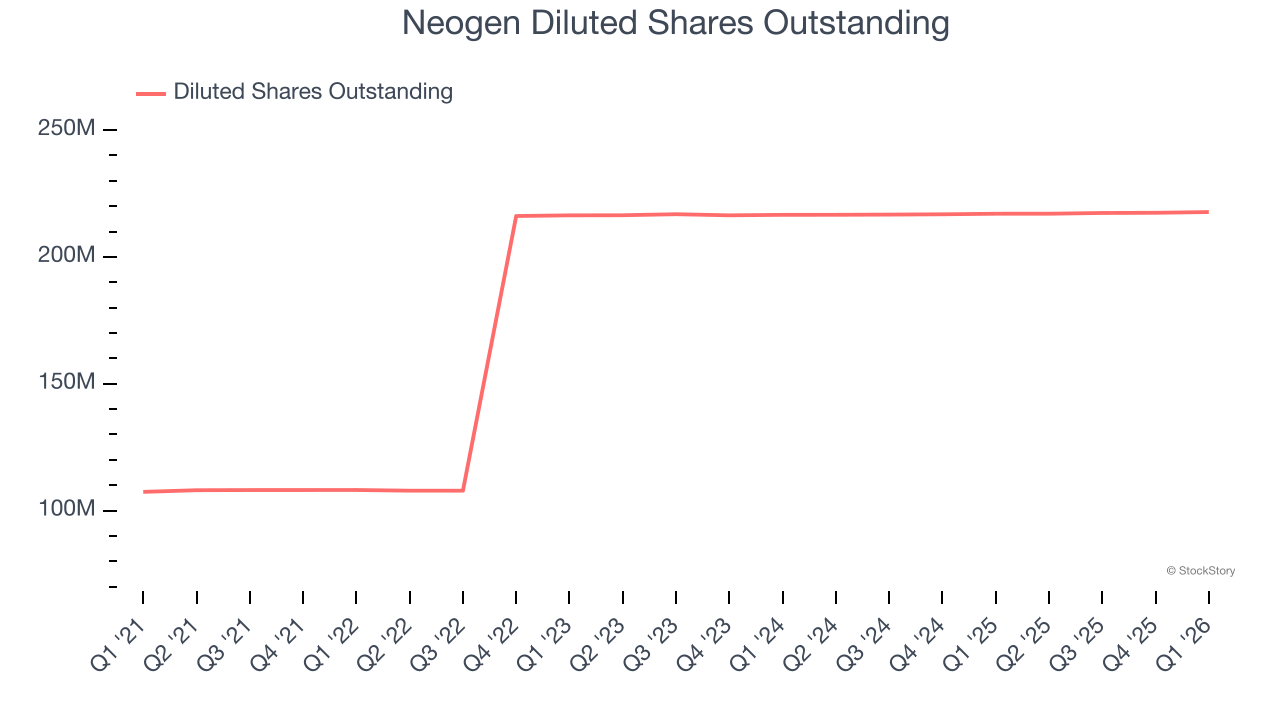
In Q1, Neogen reported adjusted EPS of $0.09, down from $0.10 in the same quarter last year. Despite falling year on year, this print easily cleared analysts’ estimates. Over the next 12 months, Wall Street expects Neogen’s full-year EPS of $0.28 to grow 5.4%.
Key Takeaways from Neogen’s Q1 Results
It was good to see Neogen beat analysts’ EPS expectations this quarter. We were also glad its revenue outperformed Wall Street’s estimates. Looking ahead, full-year revenue guidance was raised and full-year EBITDA guidance came in ahead. Zooming out, we think this was a good print with some key areas of upside. The stock remained flat at $10.30 immediately after reporting.
Is Neogen an attractive investment opportunity at the current price? We think that the latest quarter is only one piece of the longer-term business quality puzzle. Quality, when combined with valuation, can help determine if the stock is a buy. We cover that in our actionable full research report which you can read here (it’s free).