PCB manufacturing company TTM Technologies (NASDAQ: TTMI) reported Q4 CY2025 results topping the market’s revenue expectations, with sales up 18.9% year on year to $774.3 million. On top of that, next quarter’s revenue guidance ($790 million at the midpoint) was surprisingly good and 7% above what analysts were expecting. Its non-GAAP profit of $0.70 per share was 2.6% above analysts’ consensus estimates.
Is now the time to buy TTM Technologies? Find out by accessing our full research report, it’s free.
TTM Technologies (TTMI) Q4 CY2025 Highlights:
- Revenue: $774.3 million vs analyst estimates of $752.3 million (18.9% year-on-year growth, 2.9% beat)
- Adjusted EPS: $0.70 vs analyst estimates of $0.68 (2.6% beat)
- Adjusted EBITDA: $126.2 million vs analyst estimates of $119.9 million (16.3% margin, 5.2% beat)
- Revenue Guidance for Q1 CY2026 is $790 million at the midpoint, above analyst estimates of $738.5 million
- Adjusted EPS guidance for Q1 CY2026 is $0.67 at the midpoint, above analyst estimates of $0.61
- Operating Margin: 10.4%, up from 1.4% in the same quarter last year
- Free Cash Flow Margin: 1.5%, down from 5.1% in the same quarter last year
- Market Capitalization: $11.12 billion
Company Overview
As one of the world's largest printed circuit board manufacturers with facilities spanning North America and Asia, TTM Technologies (NASDAQ: TTMI) manufactures printed circuit boards (PCBs) and radio frequency (RF) components for aerospace, defense, automotive, and telecommunications industries.
Revenue Growth
A company’s long-term sales performance is one signal of its overall quality. Even a bad business can shine for one or two quarters, but a top-tier one grows for years.
With $2.91 billion in revenue over the past 12 months, TTM Technologies is a mid-sized business services company, which sometimes brings disadvantages compared to larger competitors benefiting from better economies of scale. On the bright side, it can still flex high growth rates because it’s working from a smaller revenue base.
As you can see below, TTM Technologies’s 5.3% annualized revenue growth over the last five years was decent. This shows its offerings generated slightly more demand than the average business services company, a helpful starting point for our analysis.
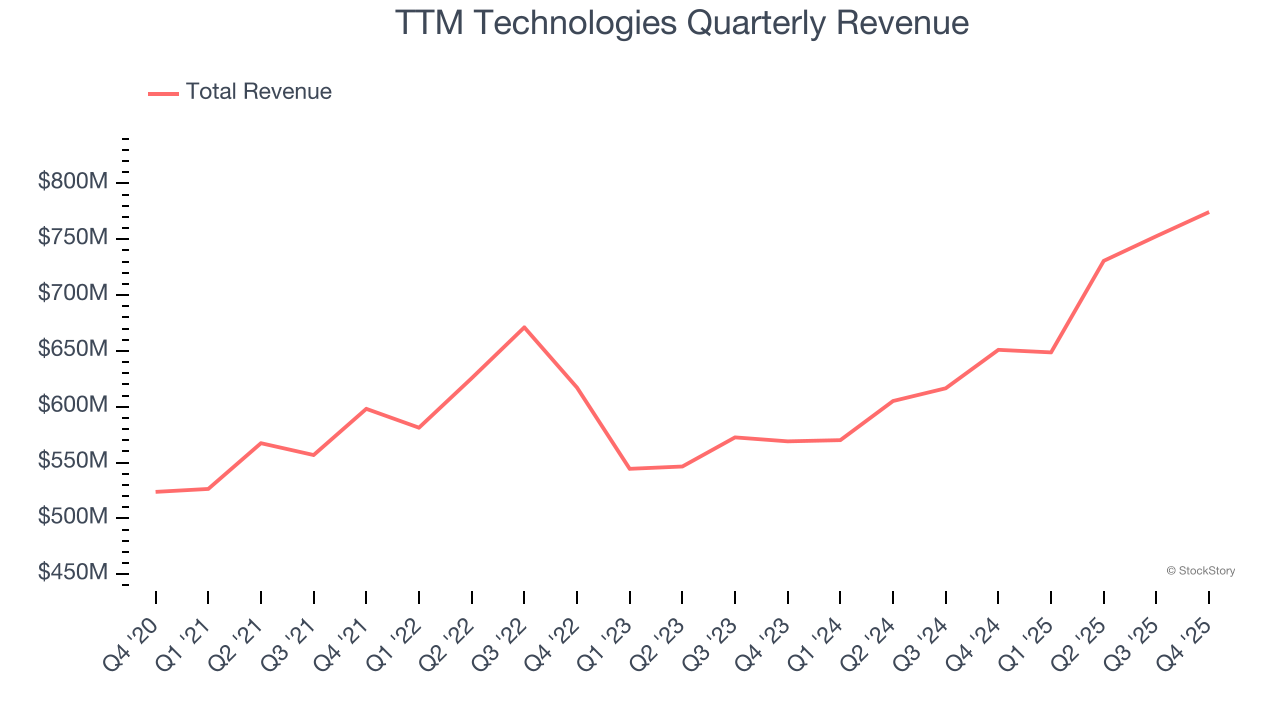
Long-term growth is the most important, but within business services, a half-decade historical view may miss new innovations or demand cycles. TTM Technologies’s annualized revenue growth of 14.1% over the last two years is above its five-year trend, suggesting its demand recently accelerated. 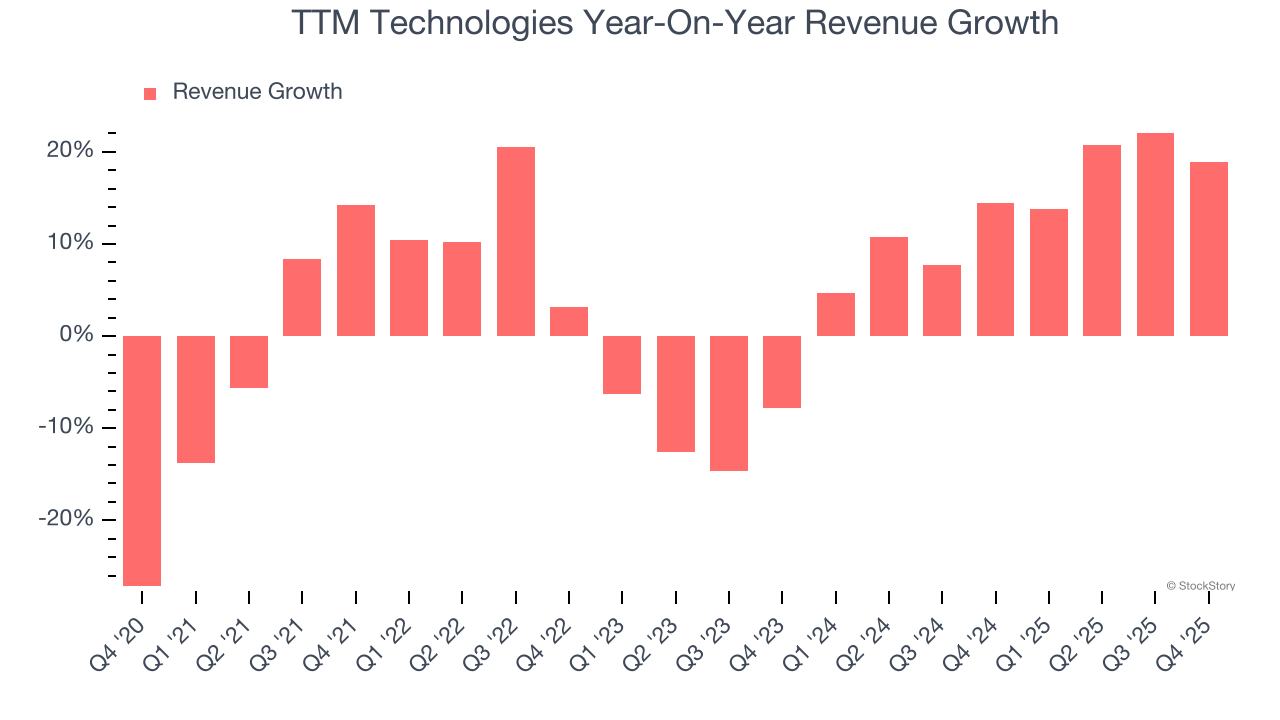
This quarter, TTM Technologies reported year-on-year revenue growth of 18.9%, and its $774.3 million of revenue exceeded Wall Street’s estimates by 2.9%. Company management is currently guiding for a 21.8% year-on-year increase in sales next quarter.
Looking further ahead, sell-side analysts expect revenue to grow 10.5% over the next 12 months, a deceleration versus the last two years. Still, this projection is admirable and suggests the market sees success for its products and services.
While Wall Street chases Nvidia at all-time highs, an under-the-radar semiconductor supplier is dominating a critical AI component these giants can’t build without. Click here to access our free report one of our favorites growth stories.
Operating Margin
Operating margin is one of the best measures of profitability because it tells us how much money a company takes home after subtracting all core expenses, like marketing and R&D.
TTM Technologies was profitable over the last five years but held back by its large cost base. Its average operating margin of 6.2% was weak for a business services business.
On the plus side, TTM Technologies’s operating margin rose by 3.5 percentage points over the last five years, as its sales growth gave it operating leverage.
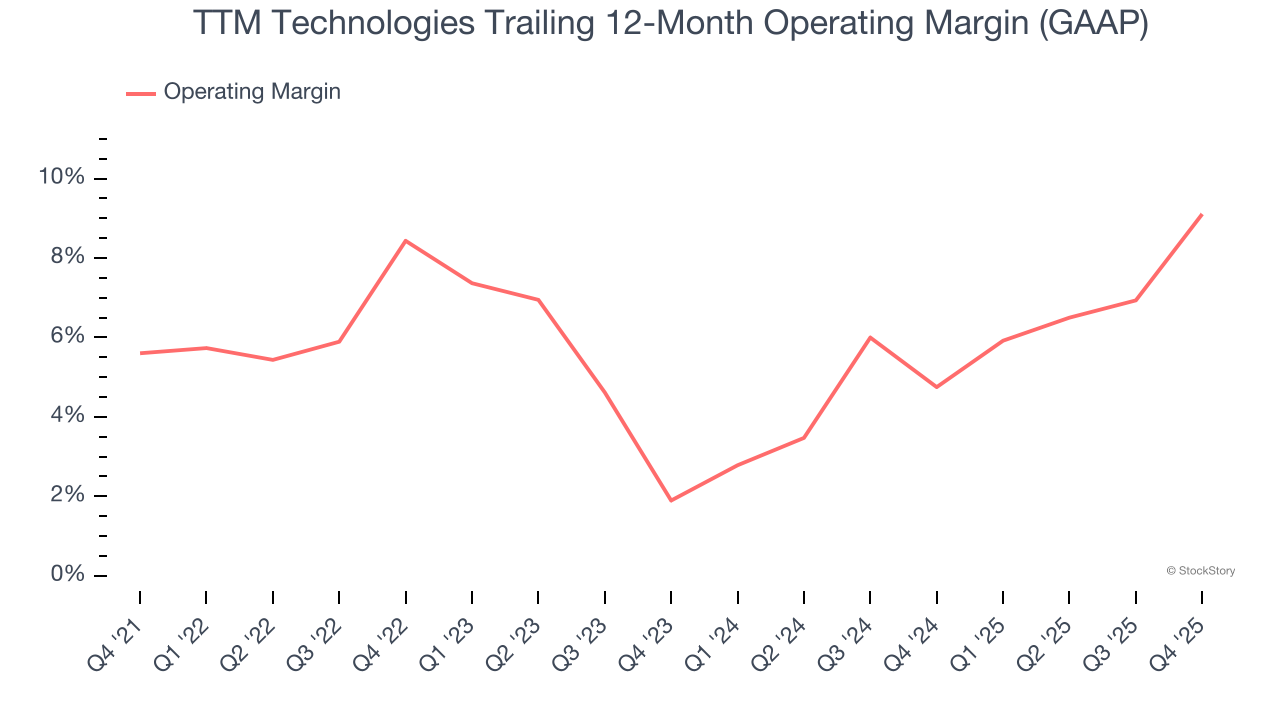
This quarter, TTM Technologies generated an operating margin profit margin of 10.4%, up 9 percentage points year on year. This increase was a welcome development and shows it was more efficient.
Earnings Per Share
Revenue trends explain a company’s historical growth, but the long-term change in earnings per share (EPS) points to the profitability of that growth – for example, a company could inflate its sales through excessive spending on advertising and promotions.
TTM Technologies’s EPS grew at an astounding 17.2% compounded annual growth rate over the last five years, higher than its 5.3% annualized revenue growth. This tells us the company became more profitable on a per-share basis as it expanded.
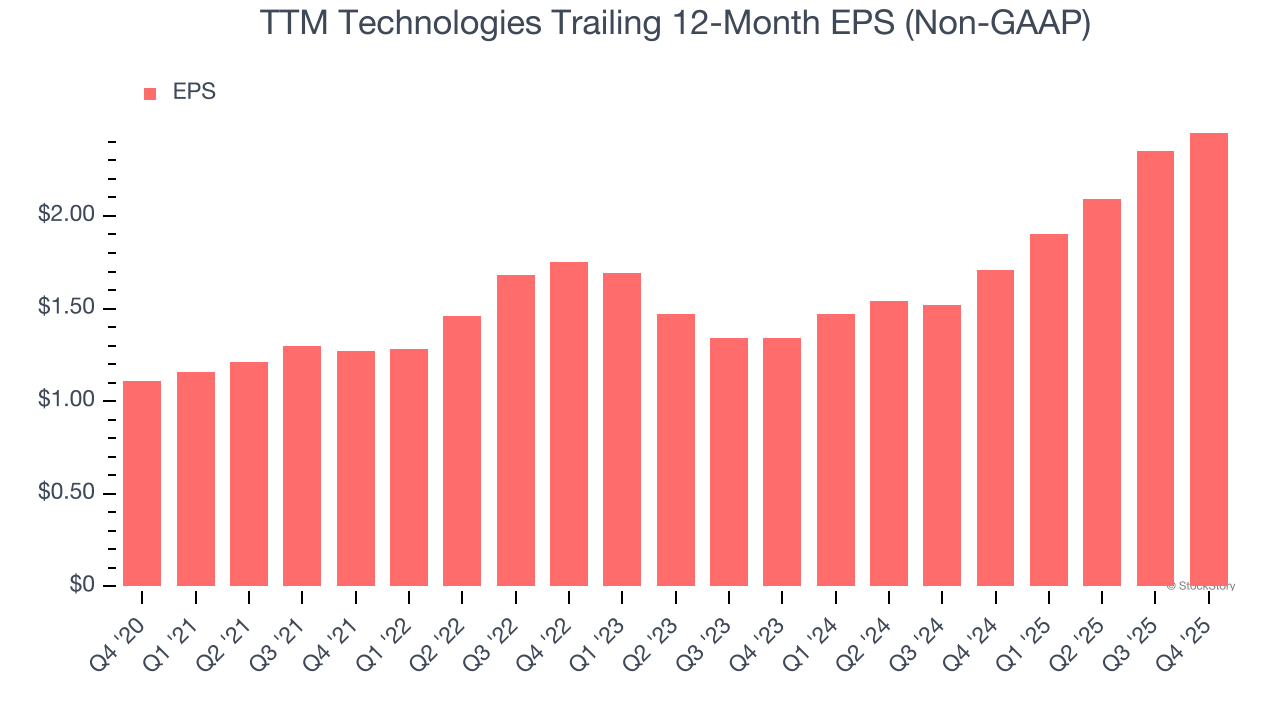
We can take a deeper look into TTM Technologies’s earnings to better understand the drivers of its performance. As we mentioned earlier, TTM Technologies’s operating margin expanded by 3.5 percentage points over the last five years. On top of that, its share count shrank by 6.1%. These are positive signs for shareholders because improving profitability and share buybacks turbocharge EPS growth relative to revenue growth. 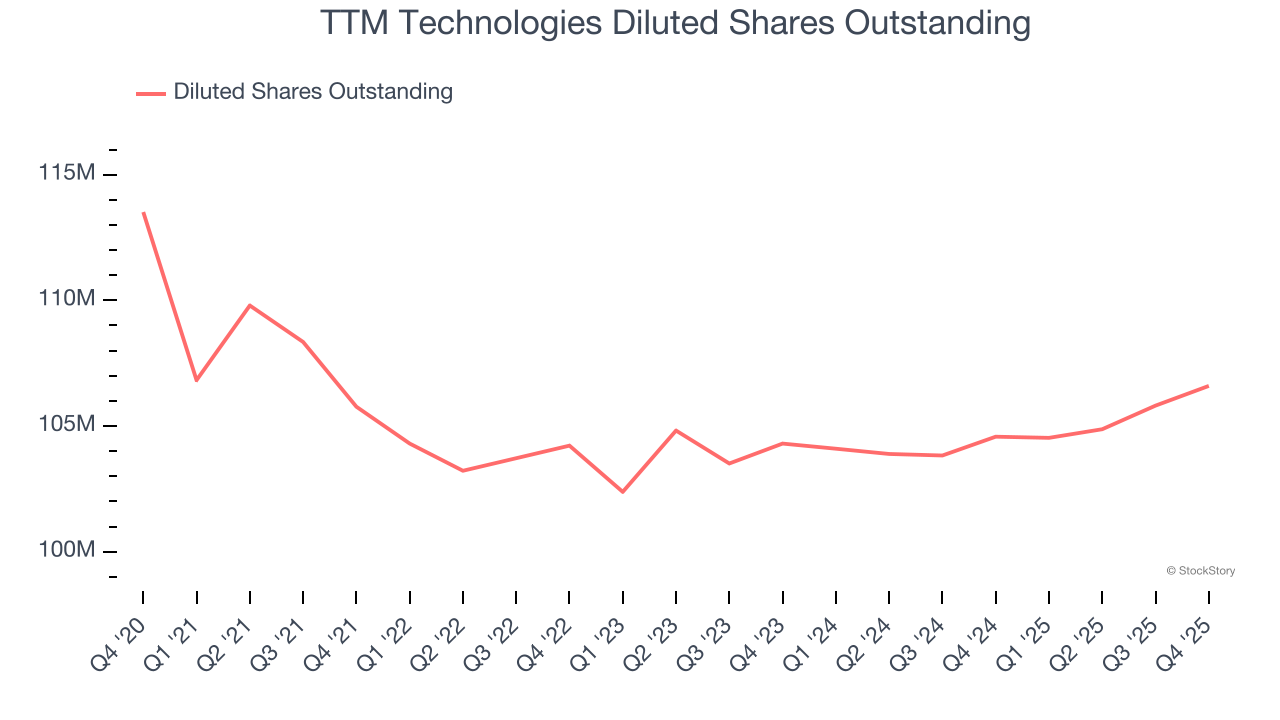
Like with revenue, we analyze EPS over a more recent period because it can provide insight into an emerging theme or development for the business.
For TTM Technologies, its two-year annual EPS growth of 35.2% was higher than its five-year trend. We love it when earnings growth accelerates, especially when it accelerates off an already high base.
In Q4, TTM Technologies reported adjusted EPS of $0.70, up from $0.60 in the same quarter last year. This print beat analysts’ estimates by 2.6%. Over the next 12 months, Wall Street expects TTM Technologies’s full-year EPS of $2.45 to grow 23.6%.
Key Takeaways from TTM Technologies’s Q4 Results
We were impressed by how significantly TTM Technologies blew past analysts’ EPS guidance for next quarter expectations this quarter. We were also glad its revenue guidance for next quarter trumped Wall Street’s estimates. Zooming out, we think this was a solid print. The stock traded up 3.8% to $99.83 immediately after reporting.
TTM Technologies may have had a good quarter, but does that mean you should invest right now? The latest quarter does matter, but not nearly as much as longer-term fundamentals and valuation, when deciding if the stock is a buy. We cover that in our actionable full research report which you can read here (it’s free).