
IT solutions provider Connection (NASDAQ: CNXN) missed Wall Street’s revenue expectations in Q2 CY2025 as sales rose 3.2% year on year to $759.7 million. Its non-GAAP profit of $0.97 per share was 7.2% above analysts’ consensus estimates.
Is now the time to buy Connection? Find out by accessing our full research report, it’s free.
Connection (CNXN) Q2 CY2025 Highlights:
- Revenue: $759.7 million vs analyst estimates of $764.1 million (3.2% year-on-year growth, 0.6% miss)
- Adjusted EPS: $0.97 vs analyst estimates of $0.91 (7.2% beat)
- Adjusted EBITDA: $36.22 million vs analyst estimates of $36.73 million (4.8% margin, 1.4% miss)
- Operating Margin: 4.1%, in line with the same quarter last year
- Free Cash Flow Margin: 3.2%, down from 5% in the same quarter last year
- Market Capitalization: $1.63 billion
“Q2 2025 represents our fifth consecutive quarter of year-over-year net sales growth. Despite a dynamic economic environment, customers continued to invest in data center refresh initiatives and in the transition to Windows 11, which resulted in positive momentum in advanced technologies and end point devices. We remain committed to delivering outstanding value through integrated IT solutions and superior customer service,” said Timothy McGrath, President and Chief Executive Officer.
Company Overview
Starting as a small computer products seller in 1982 and evolving into a Fortune 1000 company, Connection (NASDAQ: CNXN) is a technology solutions provider that helps businesses and government agencies design, purchase, implement, and manage their IT infrastructure and systems.
Revenue Growth
Reviewing a company’s long-term sales performance reveals insights into its quality. Any business can put up a good quarter or two, but the best consistently grow over the long haul.
With $2.89 billion in revenue over the past 12 months, Connection is a mid-sized business services company, which sometimes brings disadvantages compared to larger competitors benefiting from better economies of scale.
As you can see below, Connection’s 1.9% annualized revenue growth over the last five years was sluggish. This shows it failed to generate demand in any major way and is a rough starting point for our analysis.
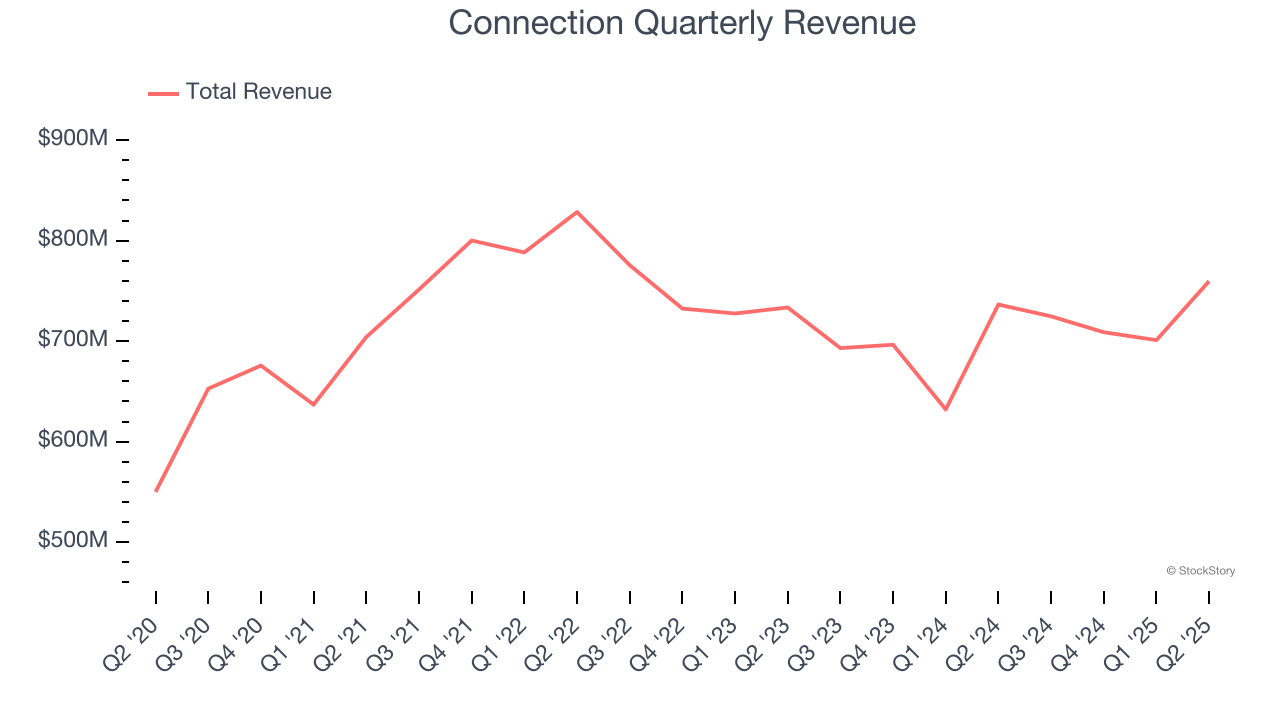
Long-term growth is the most important, but within business services, a half-decade historical view may miss new innovations or demand cycles. Connection’s performance shows it grew in the past but relinquished its gains over the last two years, as its revenue fell by 1.3% annually. 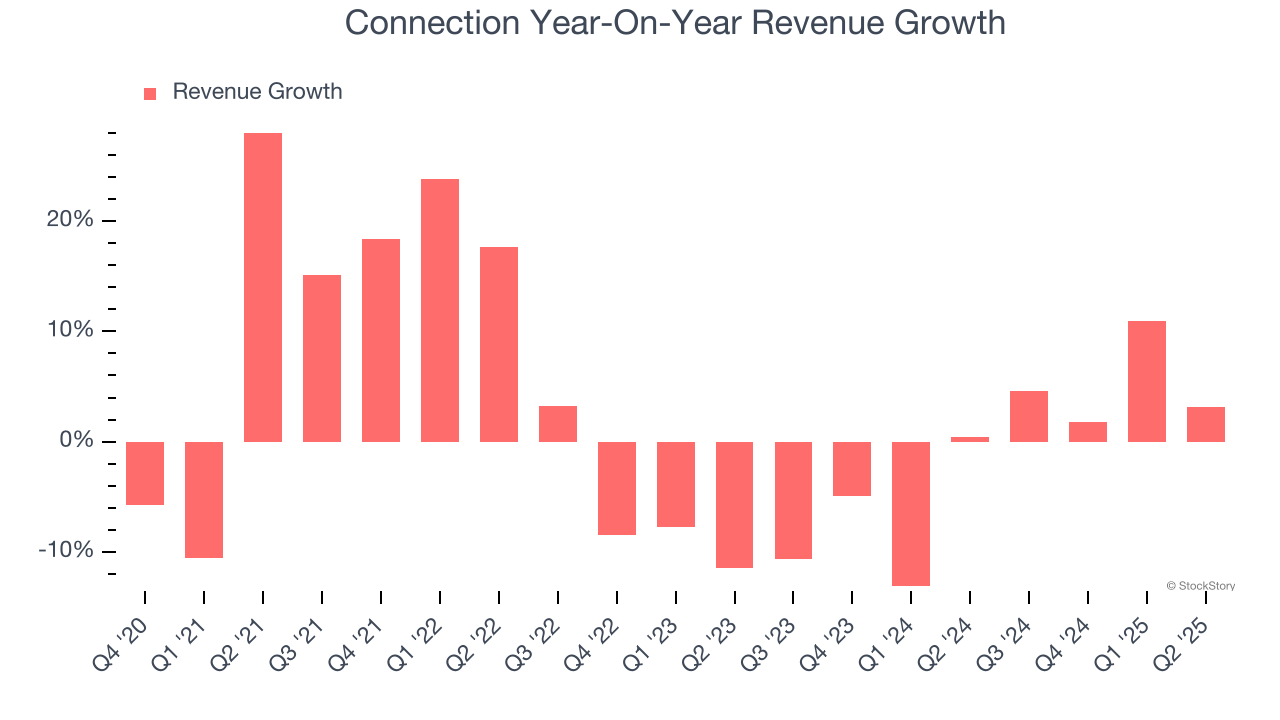
This quarter, Connection’s revenue grew by 3.2% year on year to $759.7 million, falling short of Wall Street’s estimates.
Looking ahead, sell-side analysts expect revenue to grow 6.1% over the next 12 months, an improvement versus the last two years. This projection is above the sector average and implies its newer products and services will fuel better top-line performance.
Software is eating the world and there is virtually no industry left that has been untouched by it. That drives increasing demand for tools helping software developers do their jobs, whether it be monitoring critical cloud infrastructure, integrating audio and video functionality, or ensuring smooth content streaming. Click here to access a free report on our 3 favorite stocks to play this generational megatrend.
Operating Margin
Operating margin is one of the best measures of profitability because it tells us how much money a company takes home after subtracting all core expenses, like marketing and R&D.
Connection’s operating margin might fluctuated slightly over the last 12 months but has remained more or less the same, averaging 3.5% over the last five years. This profitability was lousy for a business services business and caused by its suboptimal cost structure.
Looking at the trend in its profitability, Connection’s operating margin might fluctuated slightly but has generally stayed the same over the last five years. This raises questions about the company’s expense base because its revenue growth should have given it leverage on its fixed costs, resulting in better economies of scale and profitability.
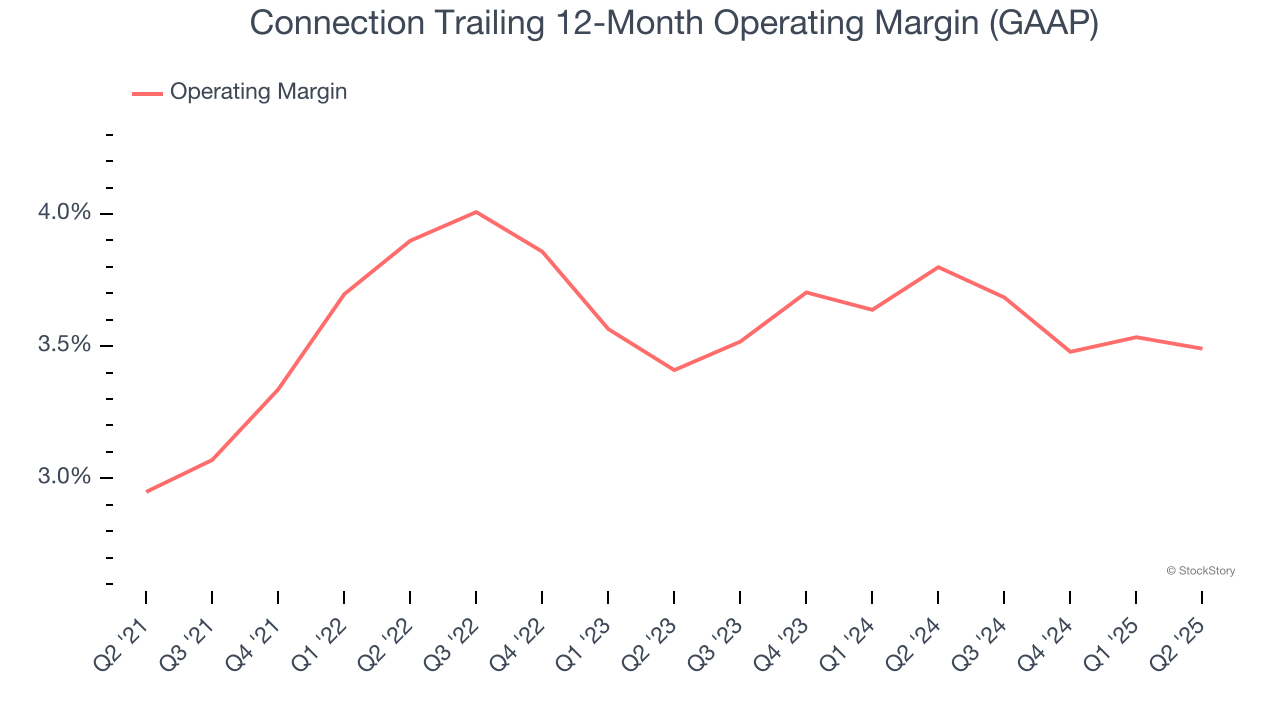
This quarter, Connection generated an operating margin profit margin of 4.1%, in line with the same quarter last year. This indicates the company’s overall cost structure has been relatively stable.
Earnings Per Share
We track the long-term change in earnings per share (EPS) for the same reason as long-term revenue growth. Compared to revenue, however, EPS highlights whether a company’s growth is profitable.
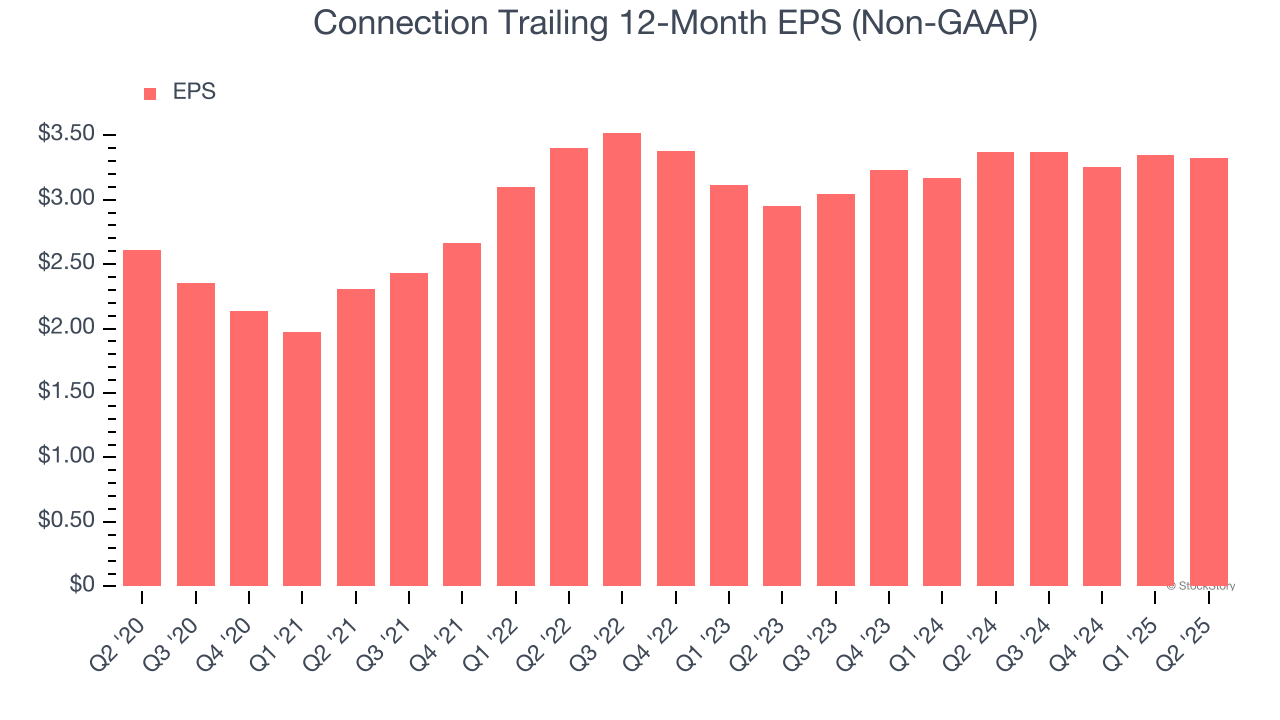
Connection’s EPS grew at an unimpressive 4.9% compounded annual growth rate over the last five years. On the bright side, this performance was better than its 1.9% annualized revenue growth and tells us the company became more profitable on a per-share basis as it expanded.
Like with revenue, we analyze EPS over a more recent period because it can provide insight into an emerging theme or development for the business.
For Connection, its two-year annual EPS growth of 6.1% was higher than its five-year trend. Accelerating earnings growth is almost always an encouraging data point.
In Q2, Connection reported adjusted EPS at $0.97, down from $1 in the same quarter last year. Despite falling year on year, this print beat analysts’ estimates by 7.2%. Over the next 12 months, Wall Street expects Connection’s full-year EPS of $3.32 to grow 8.9%.
Key Takeaways from Connection’s Q2 Results
It was encouraging to see Connection beat analysts’ EPS expectations this quarter. On the other hand, its revenue slightly missed. Overall, this print was mixed. The stock remained flat at $64.03 immediately following the results.
Is Connection an attractive investment opportunity at the current price? What happened in the latest quarter matters, but not as much as longer-term business quality and valuation, when deciding whether to invest in this stock. We cover that in our actionable full research report which you can read here, it’s free.


