


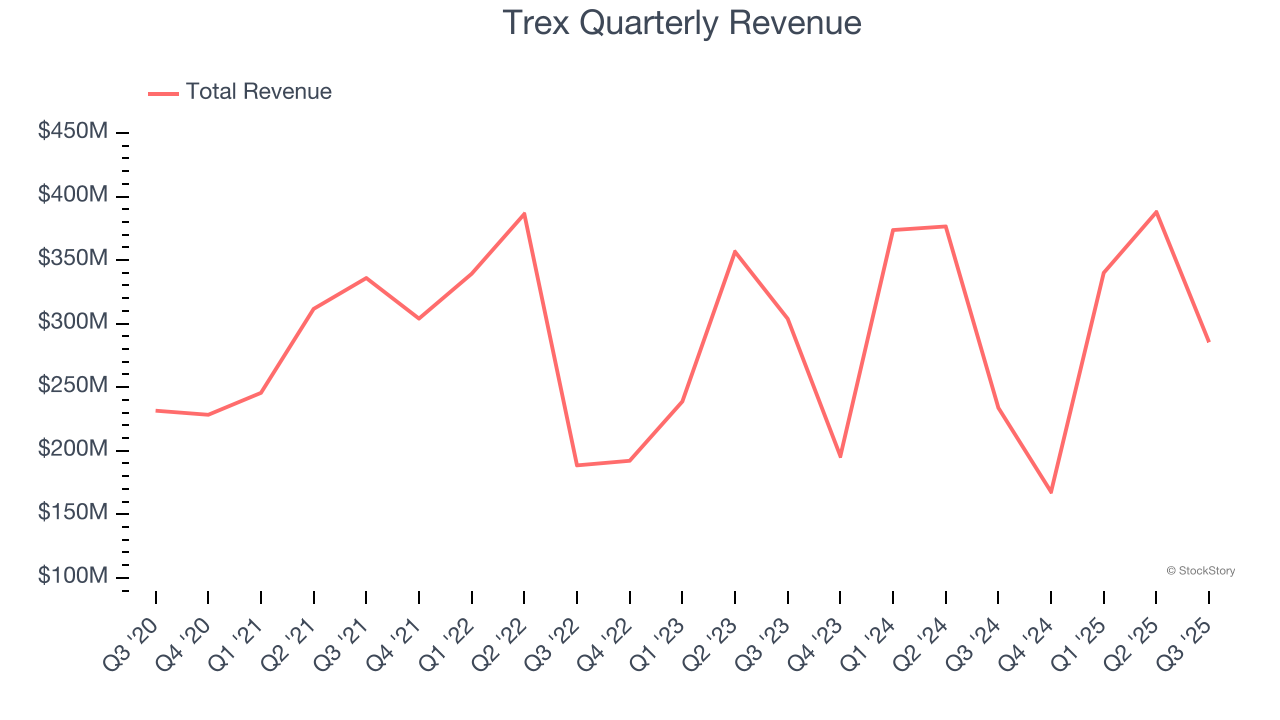
Composite decking and railing products manufacturer Trex Company (NYSE: TREX) fell short of the markets revenue expectations in Q3 CY2025, but sales rose 22.1% year on year to $285.3 million. Next quarter’s revenue guidance of $145 million underwhelmed, coming in 27.1% below analysts’ estimates. Its non-GAAP profit of $0.51 per share was 10.2% below analysts’ consensus estimates.
Is now the time to buy Trex? Find out by accessing our full research report, it’s free for active Edge members.
Trex (TREX) Q3 CY2025 Highlights:
- Revenue: $285.3 million vs analyst estimates of $301.3 million (22.1% year-on-year growth, 5.3% miss)
- Adjusted EPS: $0.51 vs analyst expectations of $0.57 (10.2% miss)
- Adjusted EBITDA: $90.39 million vs analyst estimates of $96.82 million (31.7% margin, 6.6% miss)
- Revenue Guidance for Q4 CY2025 is $145 million at the midpoint, below analyst estimates of $198.9 million
- Operating Margin: 24.7%, up from 23.2% in the same quarter last year
- Free Cash Flow Margin: 50.1%, up from 23.3% in the same quarter last year
- Market Capitalization: $5.14 billion
Company Overview
Addressing the demand for aesthetically-pleasing and unique outdoor living spaces, Trex Company (NYSE: TREX) makes wood-alternative decking, railing, and patio furniture.
Revenue Growth
A company’s long-term sales performance is one signal of its overall quality. Any business can put up a good quarter or two, but the best consistently grow over the long haul. Thankfully, Trex’s 7.6% annualized revenue growth over the last five years was decent. Its growth was slightly above the average industrials company and shows its offerings resonate with customers.
We at StockStory place the most emphasis on long-term growth, but within industrials, a half-decade historical view may miss cycles, industry trends, or a company capitalizing on catalysts such as a new contract win or a successful product line. Trex’s recent performance shows its demand has slowed as its annualized revenue growth of 4% over the last two years was below its five-year trend. 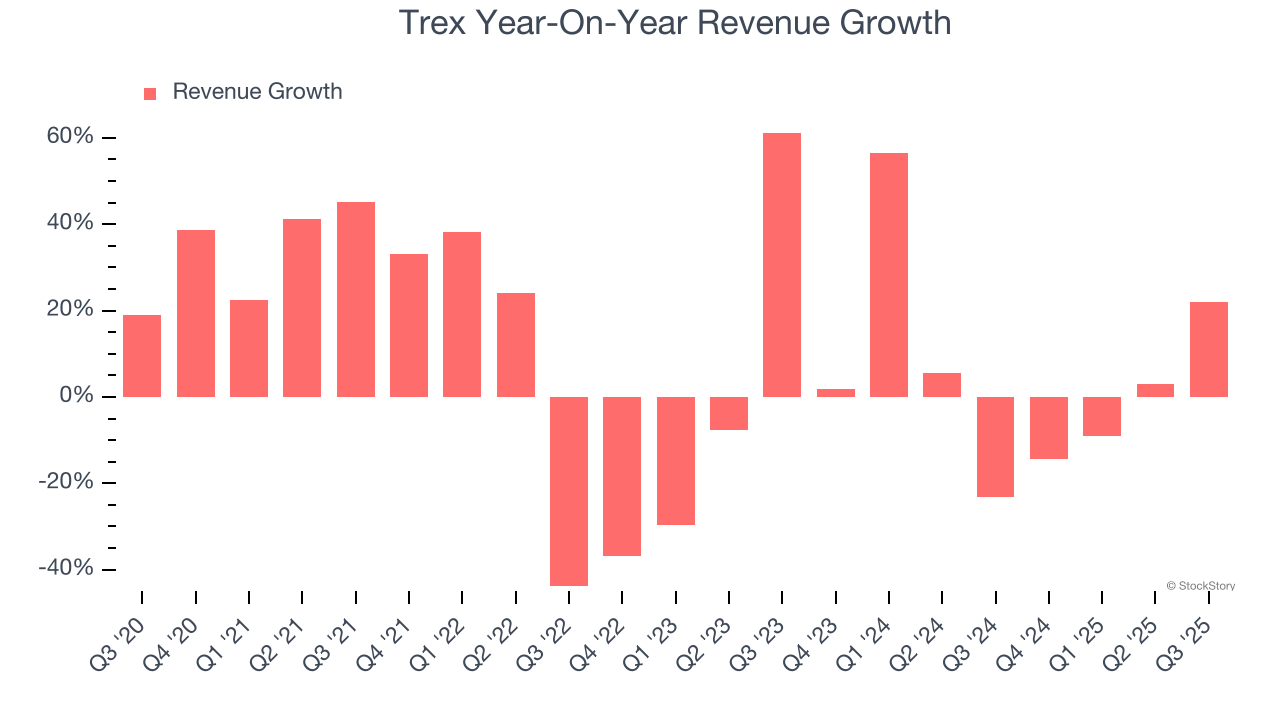
This quarter, Trex generated an excellent 22.1% year-on-year revenue growth rate, but its $285.3 million of revenue fell short of Wall Street’s high expectations. Company management is currently guiding for a 13.5% year-on-year decline in sales next quarter.
Looking further ahead, sell-side analysts expect revenue to grow 10.4% over the next 12 months, an improvement versus the last two years. This projection is noteworthy and implies its newer products and services will spur better top-line performance.
While Wall Street chases Nvidia at all-time highs, an under-the-radar semiconductor supplier is dominating a critical AI component these giants can’t build without. Click here to access our free report one of our favorites growth stories.
Operating Margin
Operating margin is one of the best measures of profitability because it tells us how much money a company takes home after procuring and manufacturing its products, marketing and selling those products, and most importantly, keeping them relevant through research and development.
Trex has been a well-oiled machine over the last five years. It demonstrated elite profitability for an industrials business, boasting an average operating margin of 25.3%. This result isn’t surprising as its high gross margin gives it a favorable starting point.
Looking at the trend in its profitability, Trex’s operating margin decreased by 4.2 percentage points over the last five years. This raises questions about the company’s expense base because its revenue growth should have given it leverage on its fixed costs, resulting in better economies of scale and profitability.
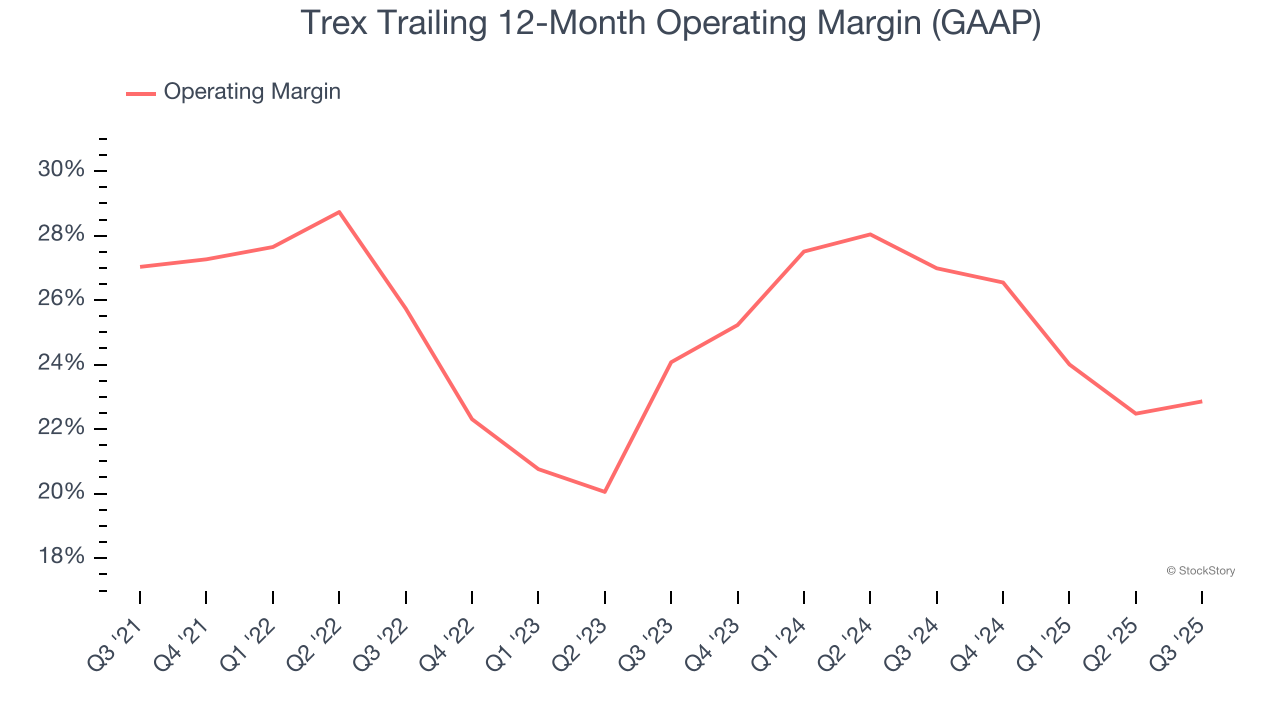
In Q3, Trex generated an operating margin profit margin of 24.7%, up 1.4 percentage points year on year. The increase was encouraging, and because its operating margin rose more than its gross margin, we can infer it was more efficient with expenses such as marketing, R&D, and administrative overhead.
Earnings Per Share
Revenue trends explain a company’s historical growth, but the long-term change in earnings per share (EPS) points to the profitability of that growth – for example, a company could inflate its sales through excessive spending on advertising and promotions.
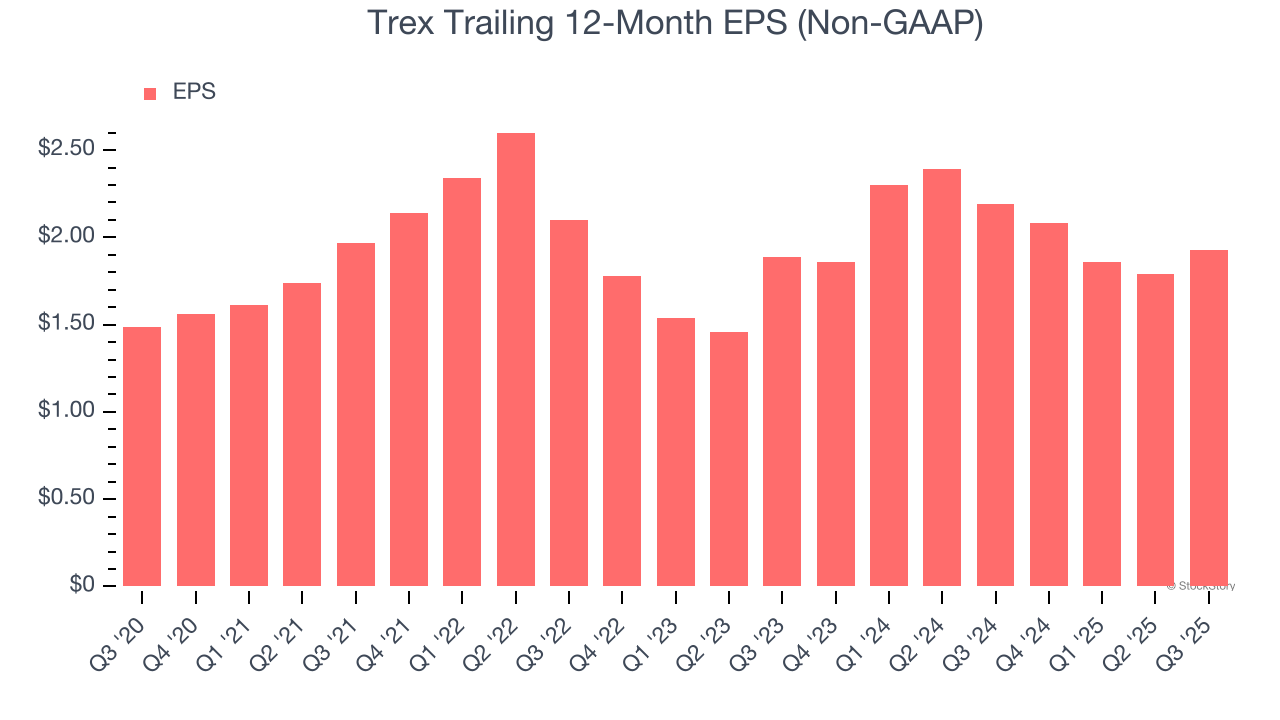
Trex’s EPS grew at an unimpressive 5.4% compounded annual growth rate over the last five years, lower than its 7.6% annualized revenue growth. This tells us the company became less profitable on a per-share basis as it expanded due to non-fundamental factors such as interest expenses and taxes.
We can take a deeper look into Trex’s earnings to better understand the drivers of its performance. As we mentioned earlier, Trex’s operating margin expanded this quarter but declined by 4.2 percentage points over the last five years. This was the most relevant factor (aside from the revenue impact) behind its lower earnings; interest expenses and taxes can also affect EPS but don’t tell us as much about a company’s fundamentals.
Like with revenue, we analyze EPS over a more recent period because it can provide insight into an emerging theme or development for the business.
Trex’s two-year annual EPS growth of 1.1% was subpar and lower than its 4% two-year revenue growth.
In Q3, Trex reported adjusted EPS of $0.51, up from $0.37 in the same quarter last year. Despite growing year on year, this print missed analysts’ estimates. Over the next 12 months, Wall Street expects Trex’s full-year EPS of $1.93 to grow 27.4%.
Key Takeaways from Trex’s Q3 Results
We struggled to find many positives in these results as its revenue, EPS, and EBITDA missed Wall Street’s estimates. Its full-year revenue guidance also fell short. Overall, this was a softer quarter. The stock traded down 13.3% to $40.80 immediately following the results.
Trex underperformed this quarter, but does that create an opportunity to invest right now? The latest quarter does matter, but not nearly as much as longer-term fundamentals and valuation, when deciding if the stock is a buy. We cover that in our actionable full research report which you can read here, it’s free for active Edge members.


