MUMBAI, IN / ACCESS Newswire / September 17, 2026 / Price is one of the most important things traders watch. Every move in the Futures and Options (F&O) segment ultimately comes back to the movement of the underlying index. If Nifty starts moving sharply higher or lower, market sentiment can change quickly.
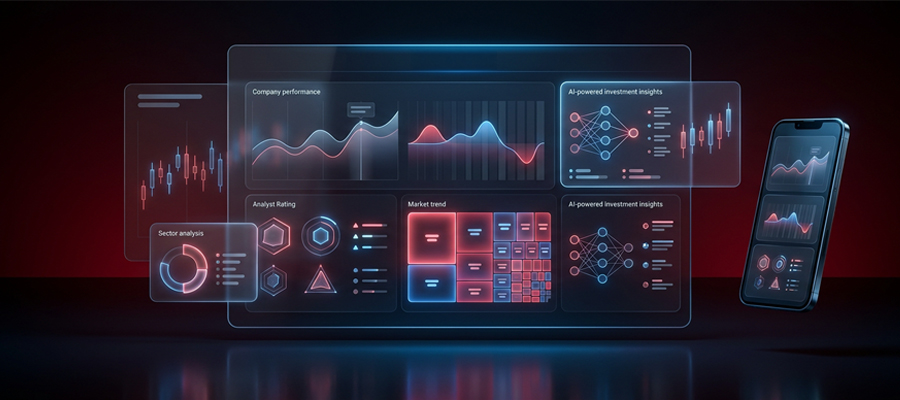
Many traders, however, look beyond price alone. They also track how positions are building across different strike prices throughout the session. Fresh positions get created. Existing ones get closed. Activity shifts between Calls and Puts. All of these details are captured in what is called the Nifty Option Chain, and learning to read it is one of the first things serious F&O traders focus on.
What Is A Nifty Option Chain?
Think of the Nifty option chain as a snapshot of the options market. You will find contracts in it at multiple strike prices, with all of them expiring on the same date. It brings together strike prices, Call options, Put options, and trading activity in one place.
At first glance, the table can look crowded. There are multiple strike prices. Open Interest keeps changing. Volumes keep updating throughout the day. For someone new to F&O, it may feel like there is too much information on the screen.
However, traders are usually looking for a few specific things. They want to see where activity is building. They want to know which strike prices are attracting attention. They also track whether positions are increasing or reducing as the market moves. That is why the Nifty option chain is often viewed alongside price action.
Understanding The Main Components Of A Nifty 50 Option Chain
A Nifty option chain contains several columns. Each one provides a different piece of information about market activity.
Strike Price
If you scroll through a Nifty option chain, the strike price column is usually the first thing you will notice. Every open contract is linked to one of these strike prices. On an active trading day, some strikes may see far more activity than others as traders adjust their positions.
Call And Put Options
Around the strike price column, you will see Call and Put option sections. Calls are often linked with traders expecting the market to strengthen. Puts are more commonly associated with bearish expectations. Looking at both sides together often gives a better picture than focusing on just one.
Open Interest (OI)
Some strikes always stand out because the numbers are much larger than the rest. That is usually because Open Interest is concentrated there. This figure shows how many option contracts remain active at a particular strike and is one of the most-watched numbers in the entire chain.
Change In Open Interest
Open Interest alone only tells part of the story. Traders also want to know whether positions are being added or reduced. That is where Change in Open Interest becomes useful, as it shows how activity is evolving during the trading session.
Volume
Every active strike sees a different amount of trading. Some contracts may have high Open Interest but very little fresh activity during the day. Volume helps fill that gap by showing how many contracts have actually changed hands during the session.
Last Traded Price (LTP)
Every option contract has its own premium. The Last Traded Price shows the latest premium at which the contract was traded. As Nifty moves and market sentiment changes, this number can move quickly as well.
Benefits Of Tracking The Nifty Option Chain
Price tells you where Nifty is trading. The option chain shows where activity is building. Looking at both together often gives traders a better understanding of what is happening in the market.
One of the biggest reasons traders track the option chain is to identify important price levels. Some strike prices naturally attract more attention than others. These often become support and resistance levels during the trading session.
Traders also use it to understand the market mood. Activity across Calls and Puts keeps changing throughout the day. Tracking these helps interpret if the market is more bullish, bearish, or staying neutral.
Another advantage is that the option chain adds context to other forms of analysis. Most traders do not rely on a single indicator while making decisions. They typically compare the chain with chart patterns and technical indicators before forming a view.
When Traders Usually Refer To The Nifty Option Chain
The Nifty option chain is not something traders check only once during the day. Market activity keeps changing, and the option chain reflects those changes in real time.
Many traders refer to the option chain before entering a trade. They may want to see where activity is concentrated. It can also show which strike prices are attracting the most activity.
The option chain also becomes relevant when Nifty approaches key support or resistance levels. Traders monitor it to know how positions are changing around these zones before making a decision.
The chain is closely observed during sharp market moves as well. Certain strikes that had limited activity earlier may start attracting significant attention. A similar shift is often visible during expiry sessions.
Common Mistakes Beginners Make
Given the amount of data in an option chain, it is natural to feel overwhelmed at first. A few mistakes are especially common among beginners.
- A single strike price catching all the attention
- High Open Interest being treated as a prediction rather than a data point
- Option chain numbers getting more importance than price action
- One signal driving the entire analysis
- Support and resistance levels being viewed as fixed throughout the day
- Rapid changes in option activity being overlooked during volatile sessions
Where Can You Track The Nifty Option Chain?
The Nifty option chain is available on the National Stock Exchange's (NSE) website. It remains one of the most widely used sources for option chain data.
Most brokerage platforms offer the same information within their trading interface. This is where platforms like Kotak Neo are helpful. Traders can view the Nifty option chain along with other market information from a single platform. This makes it easier to keep track of developments as the trading session unfolds.
Conclusion
Reading the Nifty option chain is less about memorising numbers. It is more about recognising patterns. Open Interest, volume, and strike-wise activity can all provide useful insights when viewed together.
For beginners, the learning usually comes from observation. The more often you track how the option chain changes during market hours, the easier it becomes to understand what traders are watching and why.
Contact Details
kumar.navin@kotak.com
SOURCE: Kotak neo
View the original press release on ACCESS Newswire