
Real estate franchise company RE/MAX (NYSE: RMAX) missed Wall Street’s revenue expectations in Q2 CY2026, with sales falling 5.8% year on year to $68.51 million. Its non-GAAP profit of $0.32 per share was 18.6% below analysts’ consensus estimates.
Is now the time to buy RE/MAX? Find out by accessing our full research report, it’s free.
RE/MAX (RMAX) Q2 CY2026 Highlights:
- Revenue: $68.51 million vs analyst estimates of $72.77 million (5.8% year-on-year decline, 5.9% miss)
- Adjusted EPS: $0.32 vs analyst expectations of $0.39 (18.6% miss)
- Adjusted EBITDA: $22.95 million vs analyst estimates of $26.52 million (33.5% margin, 13.5% miss)
- Operating Margin: 2.2%, down from 19.3% in the same quarter last year
- Free Cash Flow Margin: 6.8%, up from 4% in the same quarter last year
- Agents: up 2,194 year on year
- Market Capitalization: $206 million
Company Overview
Short for Real Estate Maximums, RE/MAX (NYSE: RMAX) operates a real estate franchise network spanning over 100 countries and territories.
Revenue Growth
A company’s long-term sales performance is one signal of its overall quality. Any business can have short-term success, but a top-tier one grows for years. Unfortunately, RE/MAX struggled to consistently increase demand as its $283.1 million of sales for the trailing 12 months was close to its revenue five years ago. This was below our standards and suggests it’s a low quality business.
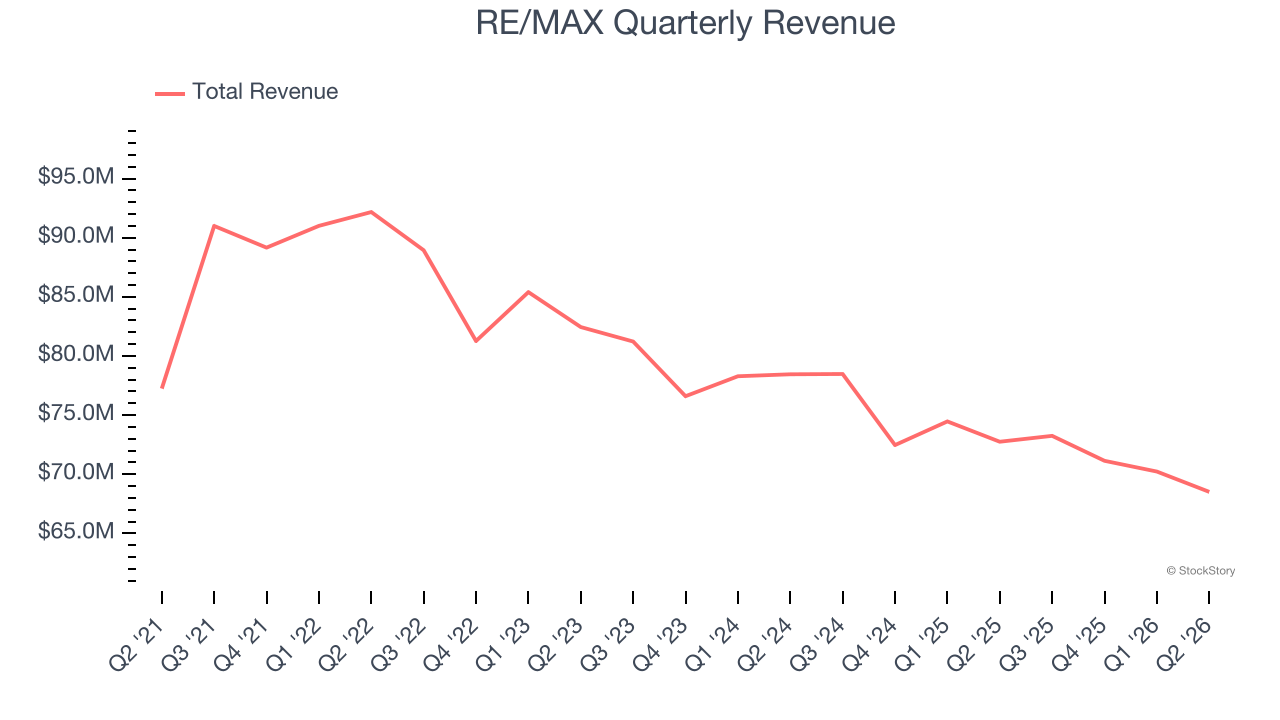
We at StockStory place the most emphasis on long-term growth, but within consumer discretionary, a stretched historical view may miss a company riding a successful new product or trend. RE/MAX’s recent performance shows its demand remained suppressed as its revenue has declined by 5.1% annually over the last two years. 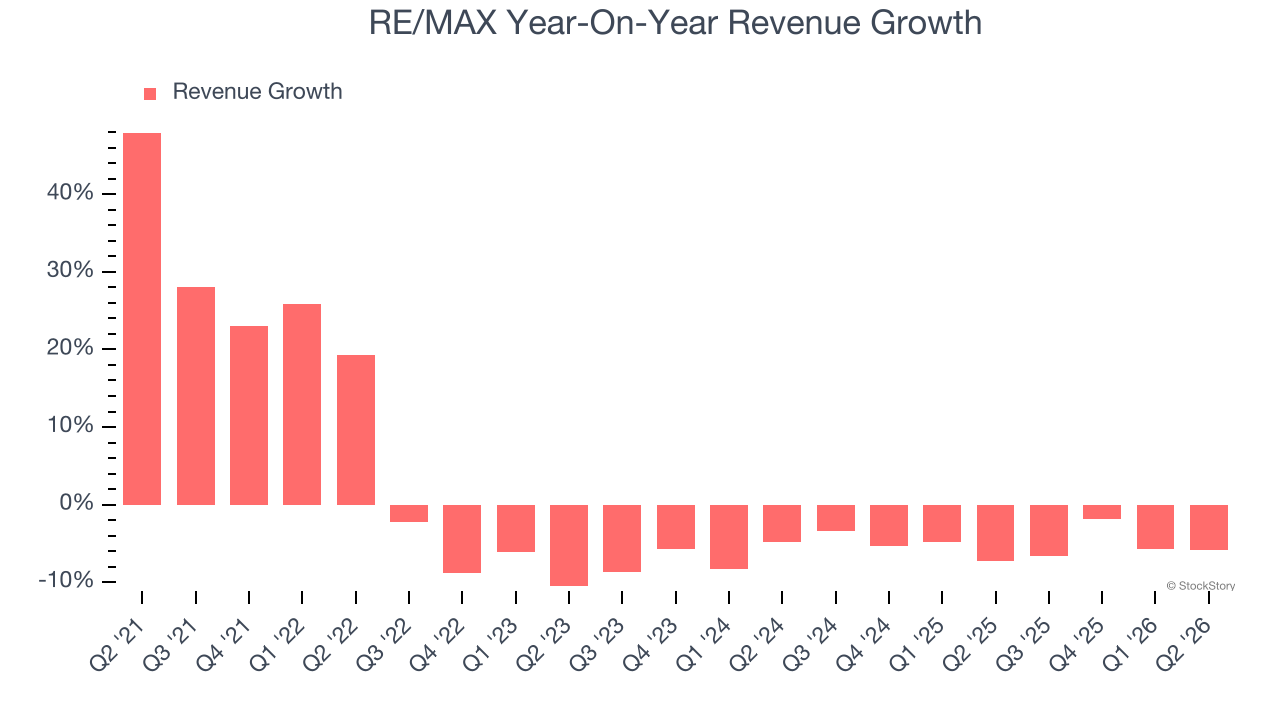
RE/MAX also discloses its number of agents, which reached 149,267 in the latest quarter. Over the last two years, RE/MAX’s agents averaged 1.5% year-on-year growth. Because this number is higher than its revenue growth during the same period, we can see the company’s monetization has fallen. 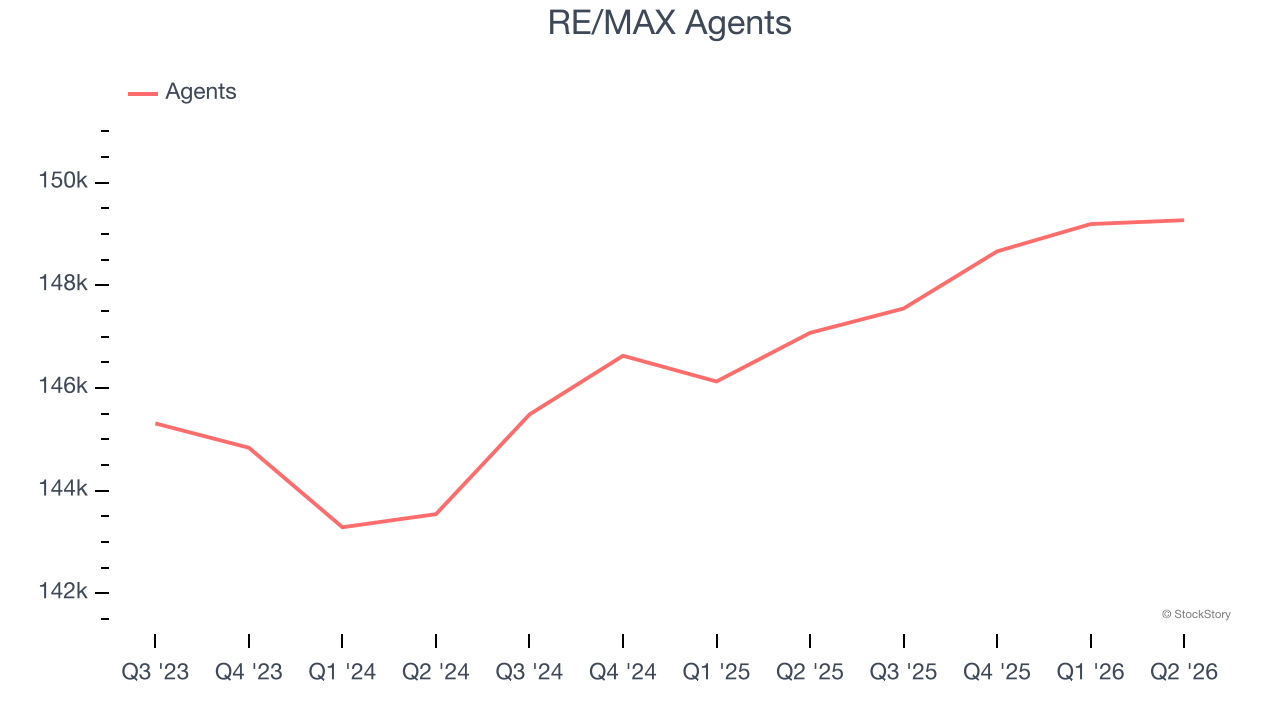
This quarter, RE/MAX missed Wall Street’s estimates and reported a rather uninspiring 5.8% year-on-year revenue decline, generating $68.51 million of revenue.
Looking ahead, sell-side analysts expect revenue to grow 3.3% over the next 12 months. Although this projection indicates its newer products and services will spur better top-line performance, it is still below average for the sector.
WHILE YOU’RE HERE: The Next Palantir? One satellite company captures images of every point on Earth. Every single day. The Pentagon wants it. Hedge funds are using it to beat earnings. You’ve probably never heard of it.
This is what the early days of Palantir looked like before it became a giant. Same playbook. Different technology. If you missed Palantir, you need to see this. Claim The Stock Ticker for Free HERE.
Operating Margin
Operating margin is an important measure of profitability as it shows the portion of revenue left after accounting for all core expenses — everything from the cost of goods sold to advertising and wages. It’s also useful for comparing profitability across companies with different levels of debt and tax rates because it excludes interest and taxes.
RE/MAX’s operating margin has shrunk over the last 12 months and averaged 10.4% over the last two years. The company’s profitability was mediocre for a consumer discretionary business and shows it couldn’t pass its higher operating expenses onto its customers.
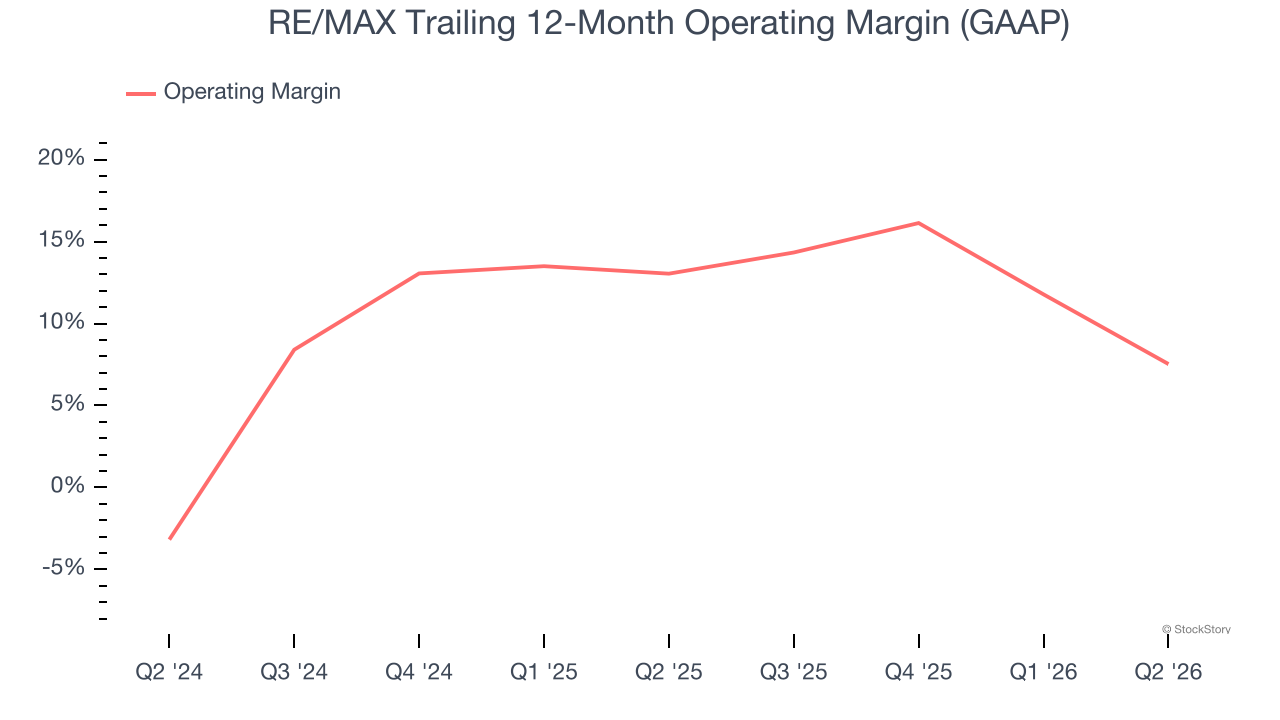
In Q2, RE/MAX generated an operating margin profit margin of 2.2%, down 17.1 percentage points year on year. This contraction shows it was less efficient because its expenses increased relative to its revenue.
Earnings Per Share
We track the long-term change in earnings per share (EPS) for the same reason as long-term revenue growth. Compared to revenue, however, EPS highlights whether a company’s growth is profitable.
Sadly for RE/MAX, its EPS declined by 12.2% annually over the last five years while its revenue was flat. This tells us the company struggled because its fixed cost base made it difficult to adjust to choppy demand.
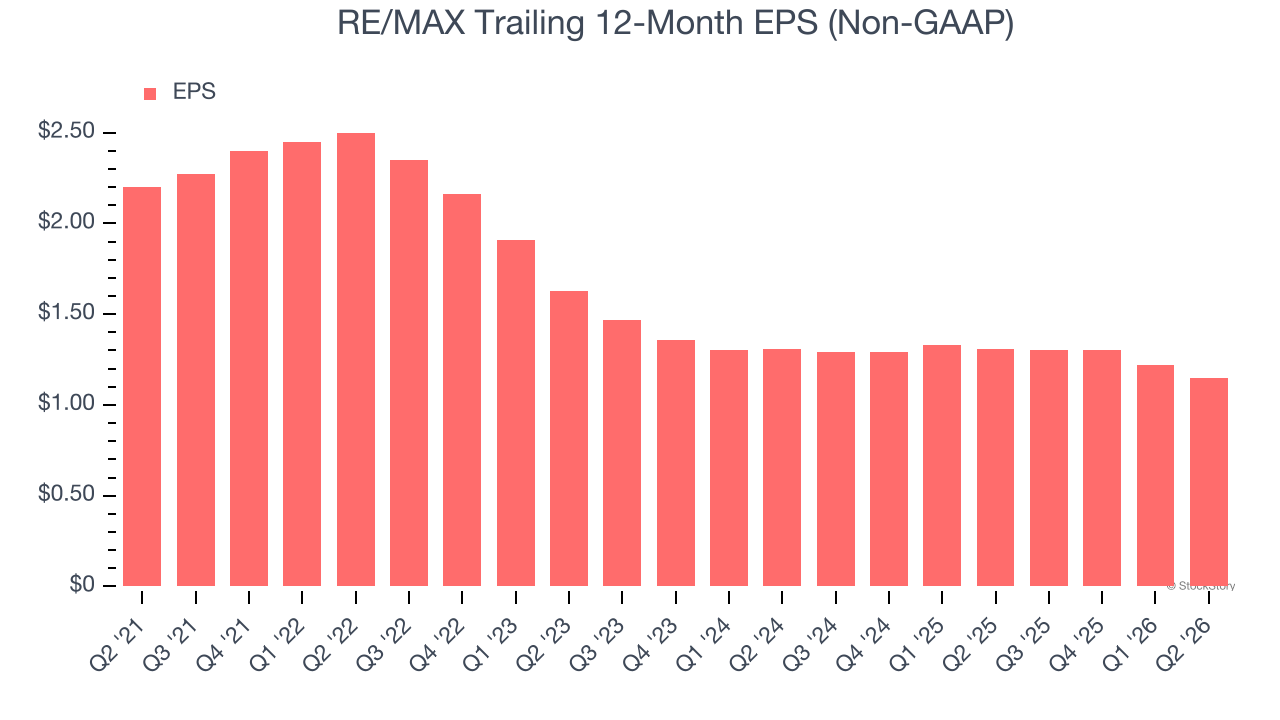
In Q2, RE/MAX reported adjusted EPS of $0.32, down from $0.39 in the same quarter last year. This print missed analysts’ estimates. Over the next 12 months, Wall Street expects RE/MAX’s full-year EPS to grow 15.7% from $1.15 to $1.33.
Key Takeaways from RE/MAX’s Q2 Results
We struggled to find many positives in these results. Its revenue missed and its EPS fell short of Wall Street’s estimates. Overall, this was a softer quarter. The stock traded up 1.8% to $10.93 immediately following the results.
Should you buy the stock or not? When making that decision, it’s important to consider its valuation, business qualities, as well as what has happened in the latest quarter. We cover that in our actionable full research report which you can read here (it’s free).