Luxury hotels and casino operator Wynn Resorts (NASDAQ: WYNN) reported Q2 CY2026 results exceeding the market’s revenue expectations, with sales up 6.9% year on year to $1.86 billion. Its non-GAAP profit of $1.24 per share was 26.4% above analysts’ consensus estimates.
Is now the time to buy Wynn Resorts? Find out by accessing our full research report, it’s free.
Wynn Resorts (WYNN) Q2 CY2026 Highlights:
- Revenue: $1.86 billion vs analyst estimates of $1.83 billion (6.9% year-on-year growth, 1.4% beat)
- Adjusted EPS: $1.24 vs analyst estimates of $0.98 (26.4% beat)
- Operating Margin: 16%, in line with the same quarter last year
- Market Capitalization: $10.06 billion
Company Overview
Founded by the former Mirage Resorts CEO, Wynn Resorts (NASDAQ: WYNN) is a global developer and operator of high-end hotels and casinos, known for its luxurious properties and premium guest services.
Revenue Growth
Reviewing a company’s long-term sales performance reveals insights into its quality. Any business can put up a good quarter or two, but the best consistently grow over the long haul. Over the last five years, Wynn Resorts grew its sales at a 21.6% annual rate. Though this growth is acceptable on an absolute basis, we need to see more than just topline growth for the consumer discretionary sector, which can display significant earnings volatility. This means our bar for the sector is particularly high, reflecting the non-essential and hit-driven nature of the products and services offered. Additionally, five-year CAGR starts around Covid, when revenue was depressed then rebounded.
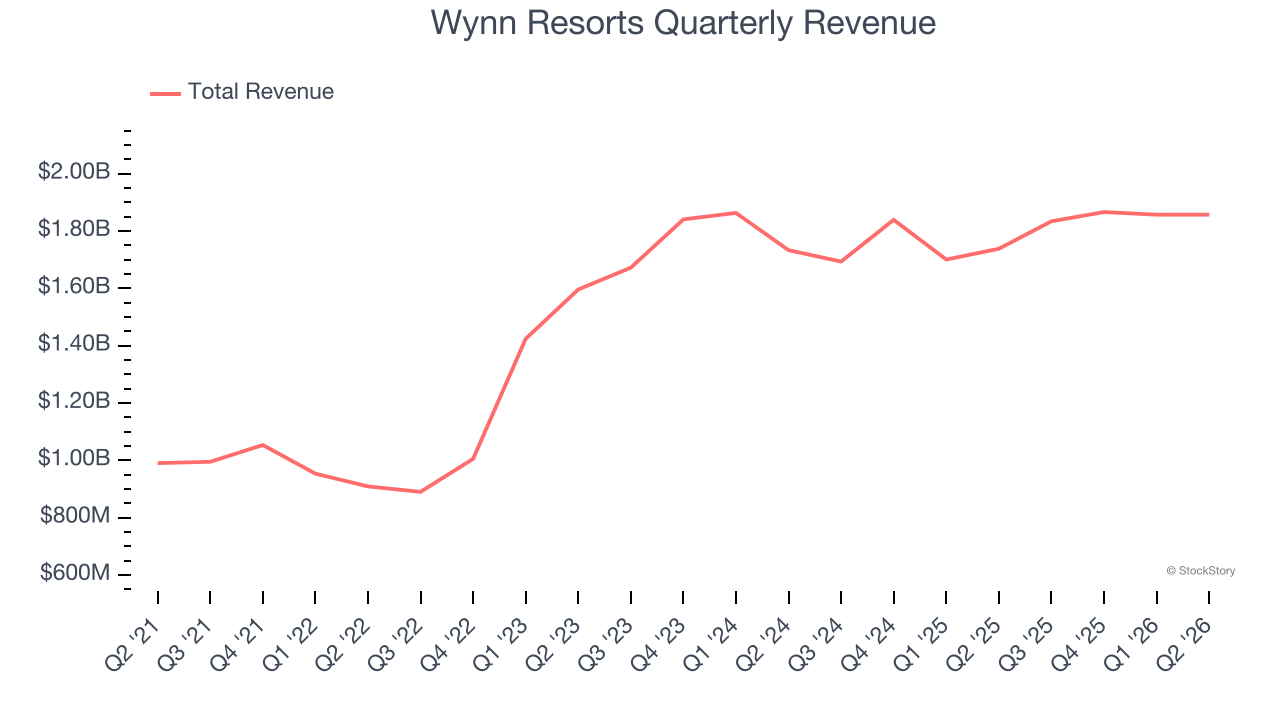
Long-term growth is the most important, but within consumer discretionary, product cycles are short and revenue can be hit-driven due to rapidly changing trends and consumer preferences. Wynn Resorts’s recent performance shows its demand has slowed as its annualized revenue growth of 2.1% over the last two years was below its five-year trend. We’re wary when companies in the sector see decelerations in revenue growth, as it could signal changing consumer tastes aided by low switching costs. Note that COVID hurt Wynn Resorts’s business in 2020 and part of 2021, and it bounced back in a big way thereafter. 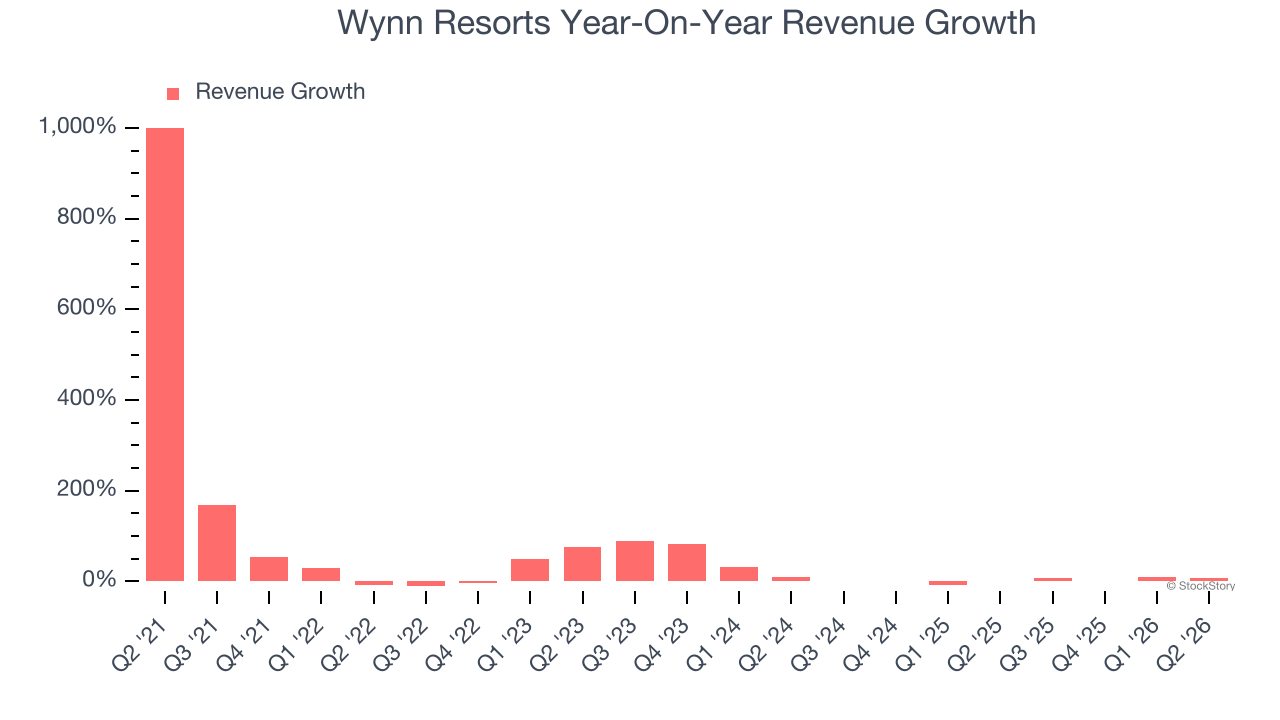
Wynn Resorts also breaks out the revenue for its three most important segments: Casino, Hotel, and Dining and Entertainment, which are 63.3%, 15.6%, and 14.2% of revenue. Over the last two years, Wynn Resorts’s Casino revenue (Poker, slots) averaged 6.1% year-on-year growth while its Hotel (overnight bookings) and Dining and Entertainment (food, beverage, Wynn Interactive) revenues averaged declines of 4.3% and 1.6%. 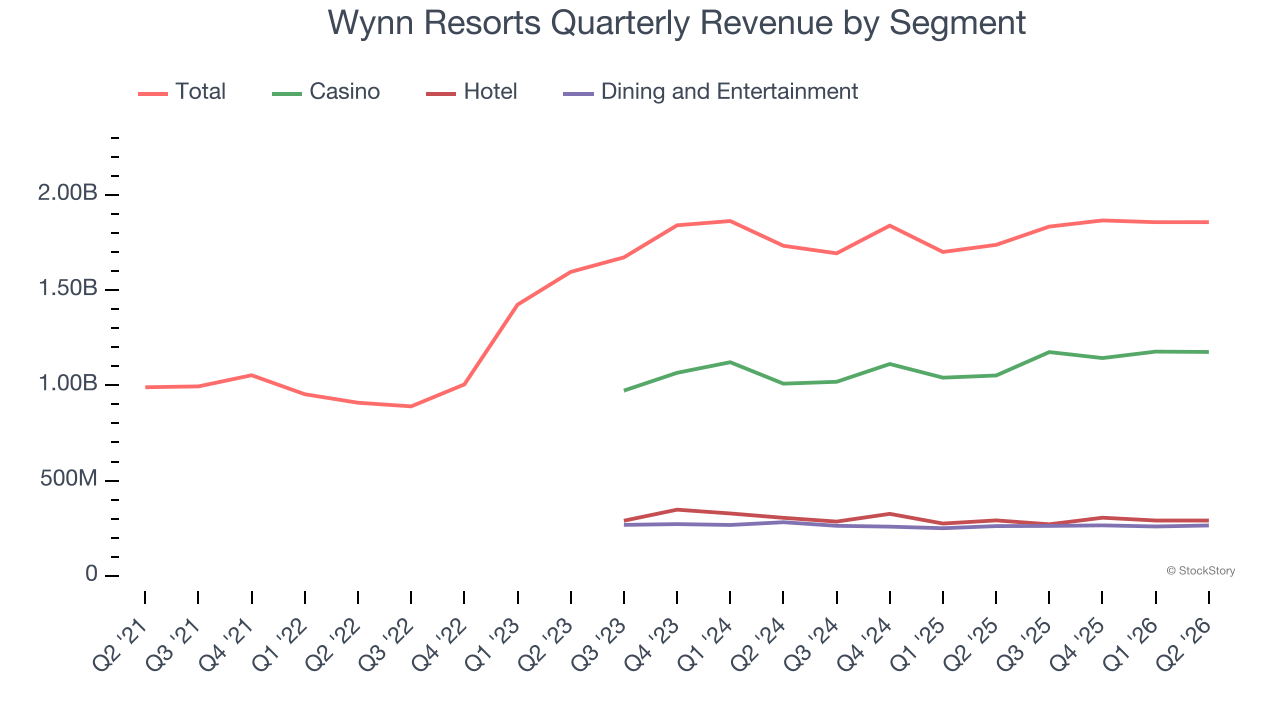
This quarter, Wynn Resorts reported year-on-year revenue growth of 6.9%, and its $1.86 billion of revenue exceeded Wall Street’s estimates by 1.4%.
Looking ahead, sell-side analysts expect revenue to grow 2.1% over the next 12 months, similar to its two-year rate. This projection is underwhelming and implies its newer products and services will not catalyze better top-line performance yet.
ONE MORE THING: The $21 AI Application Stock Wall Street Forgot. While Wall Street obsesses over who’s building AI, one company is already using it to print money. And nobody’s paying attention.
AI chip stocks trade at ridiculous valuations. This company processes a trillion consumer signals monthly using AI and trades at a third of the price. The gap won’t last. The institutions will figure it out. You need to see this first. Read the FREE Report Before They Notice.
Operating Margin
Operating margin is an important measure of profitability as it shows the portion of revenue left after accounting for all core expenses — everything from the cost of goods sold to advertising and wages. It’s also useful for comparing profitability across companies with different levels of debt and tax rates because it excludes interest and taxes.
Wynn Resorts’s operating margin has more or less stayed the same over the last 12 months , and we generally like to see margin increases due to economies of scale and cost efficiency over time.
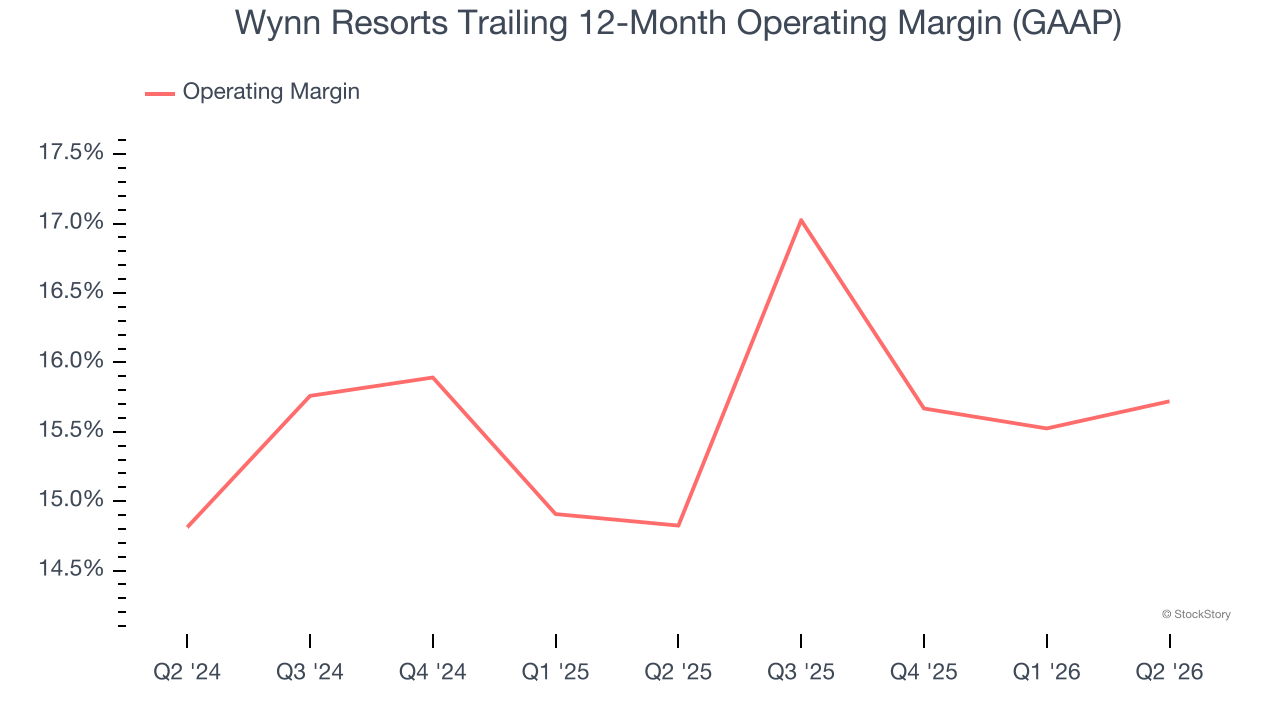
In Q2, Wynn Resorts generated an operating margin profit margin of 16%, in line with the same quarter last year. This indicates the company’s overall cost structure has been relatively stable.
Earnings Per Share
Revenue trends explain a company’s historical growth, but the long-term change in earnings per share (EPS) points to the profitability of that growth — for example, a company could inflate its sales through excessive spending on advertising and promotions.
Wynn Resorts’s full-year EPS flipped from negative to positive over the last five years. This is encouraging and shows it’s at a critical moment in its life.
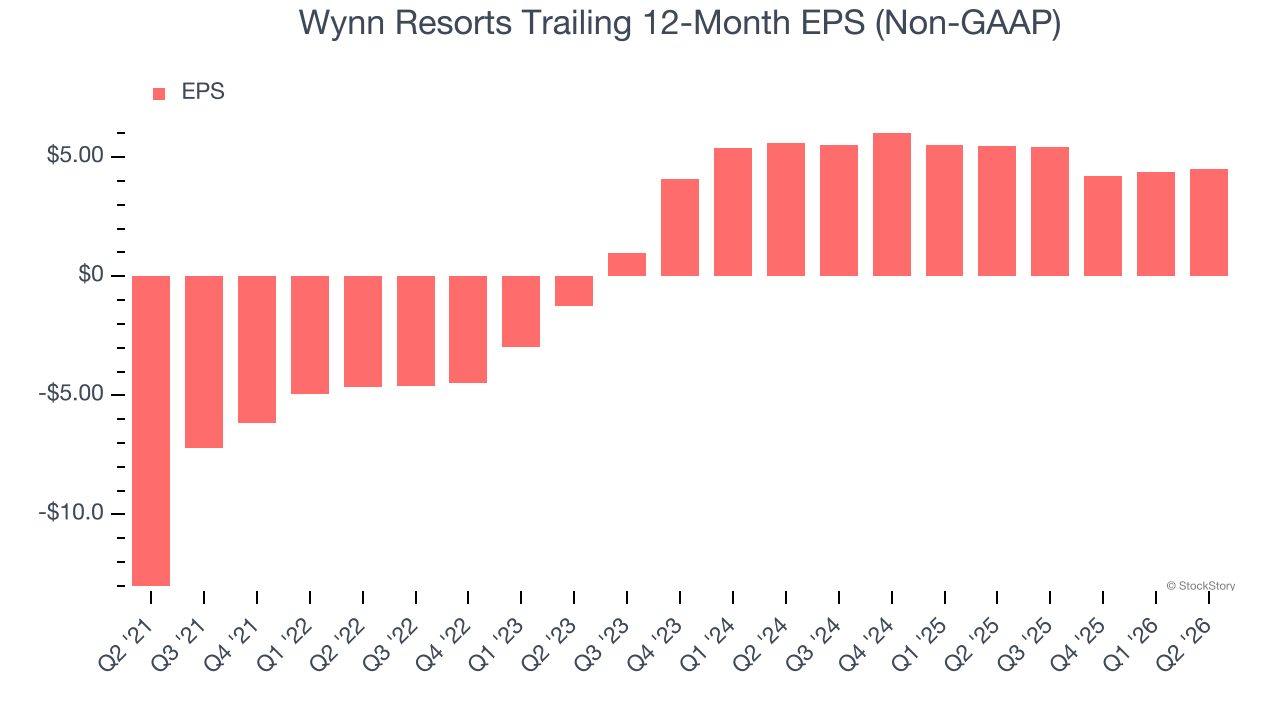
In Q2, Wynn Resorts reported adjusted EPS of $1.24, up from $1.09 in the same quarter last year. This print easily cleared analysts’ estimates, and shareholders should be content with the results. Over the next 12 months, Wall Street expects Wynn Resorts’s full-year EPS to shrink by 1.4% from $4.52 to $4.46.
Key Takeaways from Wynn Resorts’s Q2 Results
It was good to see Wynn Resorts beat analysts’ EPS expectations this quarter. We were also happy its revenue narrowly outperformed Wall Street’s estimates. Zooming out, we think this was a good print with some key areas of upside. The stock traded up 8.6% to $105.99 immediately after reporting.
Wynn Resorts may have had a good quarter, but does that mean you should invest right now? The latest quarter does matter, but not nearly as much as longer-term fundamentals and valuation, when deciding if the stock is a buy. We cover that in our actionable full research report which you can read here (it’s free).