Real estate technology company AGNT (NASDAQ: AGNT) reported Q2 CY2026 results exceeding the market’s revenue expectations, with sales up 10.7% year on year to $1.45 billion. Guidance for next quarter’s revenue was optimistic at $1.4 billion at the midpoint, 2.2% above analysts’ estimates. Its GAAP loss of $0.02 per share was significantly below analysts’ consensus estimates.
Is now the time to buy AGNT? Find out by accessing our full research report, it’s free.
AGNT (AGNT) Q2 CY2026 Highlights:
- Revenue: $1.45 billion vs analyst estimates of $1.4 billion (10.7% year-on-year growth, 3.3% beat)
- EPS (GAAP): -$0.02 vs analyst estimates of $0.02 (significant miss)
- Adjusted EBITDA: $25.7 million vs analyst estimates of $18.36 million (1.8% margin, 40% beat)
- The company reconfirmed its revenue guidance for the full year of $5 billion at the midpoint
- EBITDA guidance for the full year is $55 million at the midpoint, below analyst estimates of $63.38 million
- Operating Margin: 0.1%, in line with the same quarter last year
- Free Cash Flow Margin: 2.5%, similar to the same quarter last year
- Market Capitalization: $673.7 million
Company Overview
Founded in 2009, AGNT (NASDAQ: AGNT) is a real estate company known for its virtual, cloud-based approach to real estate brokerage.
Revenue Growth
A company’s long-term sales performance is one signal of its overall quality. Even a bad business can shine for one or two quarters, but a top-tier one grows for years. Over the last five years, AGNT grew its sales at a 12.5% compounded annual growth rate. Though this growth is acceptable on an absolute basis, we need to see more than just topline growth for the consumer discretionary sector, which can display significant earnings volatility. This means our bar for the sector is particularly high, reflecting the non-essential and hit-driven nature of the products and services offered. Additionally, five-year CAGR starts around Covid, when revenue was depressed then rebounded.
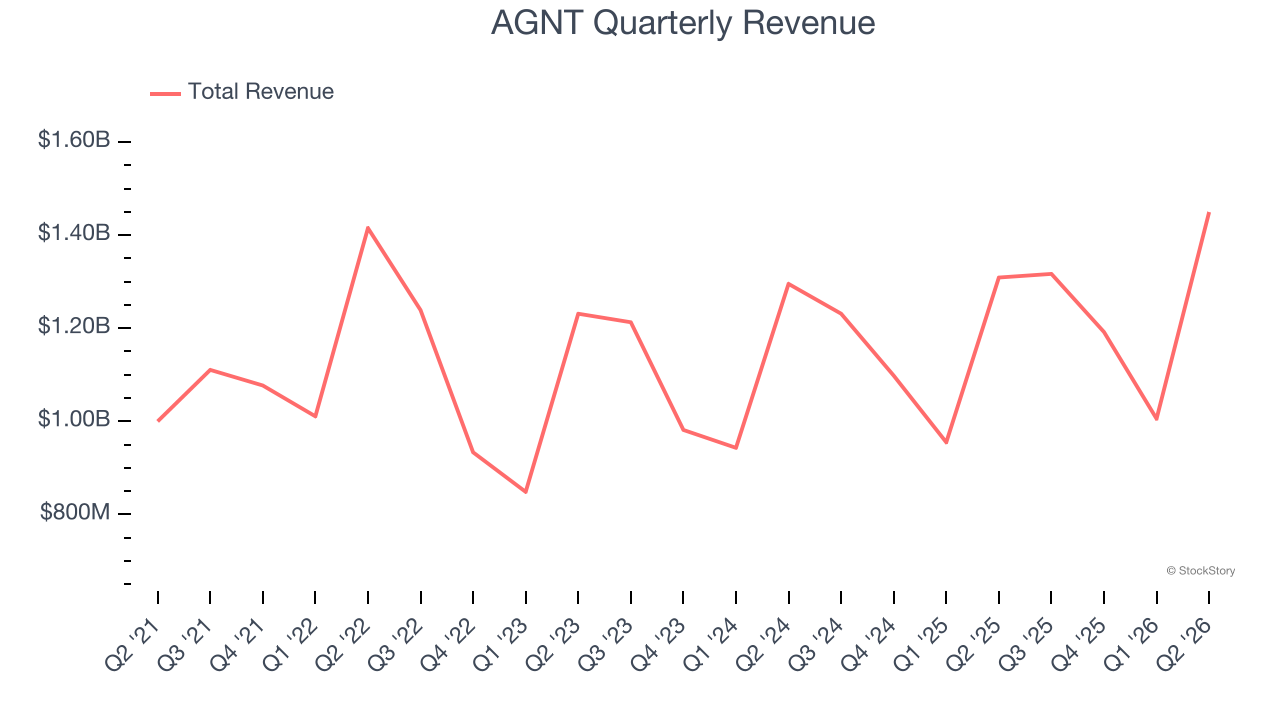
Long-term growth is the most important, but within consumer discretionary, product cycles are short and revenue can be hit-driven due to rapidly changing trends and consumer preferences. AGNT’s recent performance shows its demand has slowed as its annualized revenue growth of 5.8% over the last two years was below its five-year trend. We’re wary when companies in the sector see decelerations in revenue growth, as it could signal changing consumer tastes aided by low switching costs. 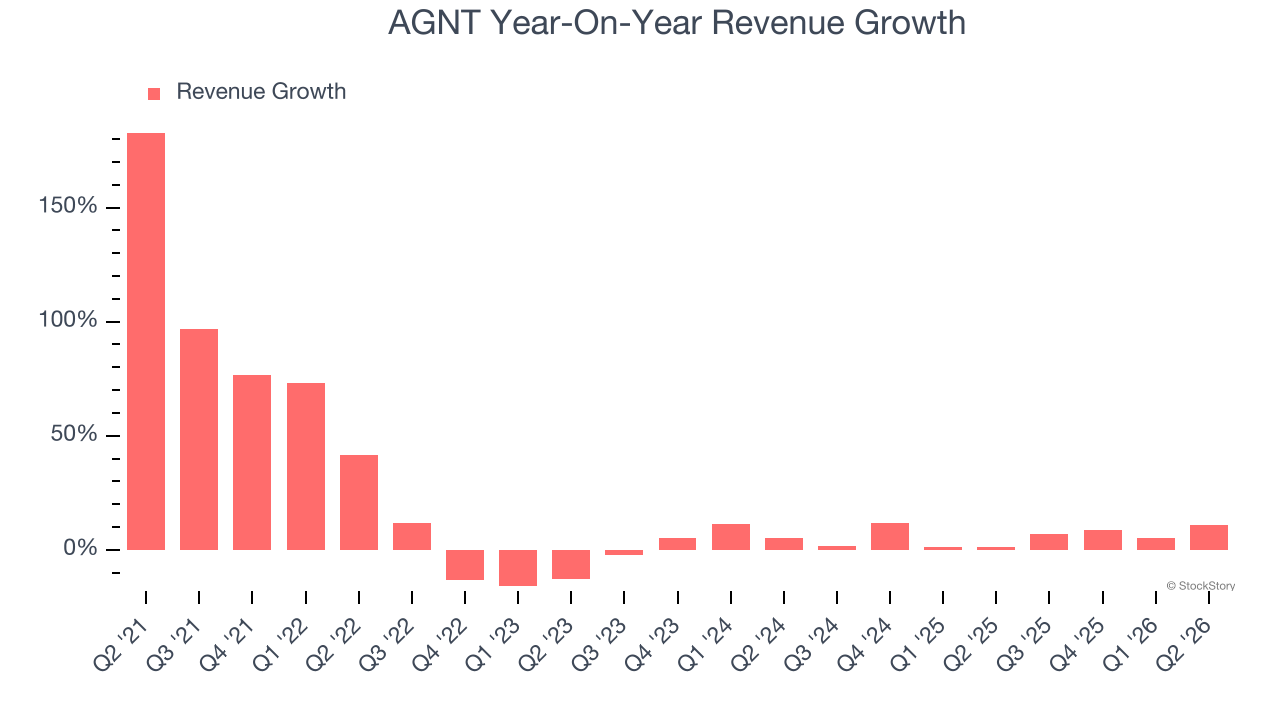
This quarter, AGNT reported year-on-year revenue growth of 10.7%, and its $1.45 billion of revenue exceeded Wall Street’s estimates by 3.3%. Company management is currently guiding for a 6.3% year-on-year increase in sales next quarter.
Looking further ahead, sell-side analysts expect revenue to grow 2.6% over the next 12 months, a deceleration versus the last two years. This projection is underwhelming and indicates its products and services will see some demand headwinds.
ONE MORE THING: 3 Hidden Platforms Growing 3X Faster than Amazon, Google, and PayPal. Amazon, Google, and Meta all followed the same playbook: Dominate an ignored market. Build an unbeatable moat. Scale until you’re unstoppable.
These three platforms are running that exact playbook right now. The early investors in Amazon made fortunes. The early investors in these could do the same. Get All 3 Stocks Here for FREE.
Operating Margin
AGNT’s operating margin has more or less stayed the same over the last 12 months . The company broke even over the last two years, inadequate for a consumer discretionary business. Its large expense base and inefficient cost structure were the main culprits behind this performance.
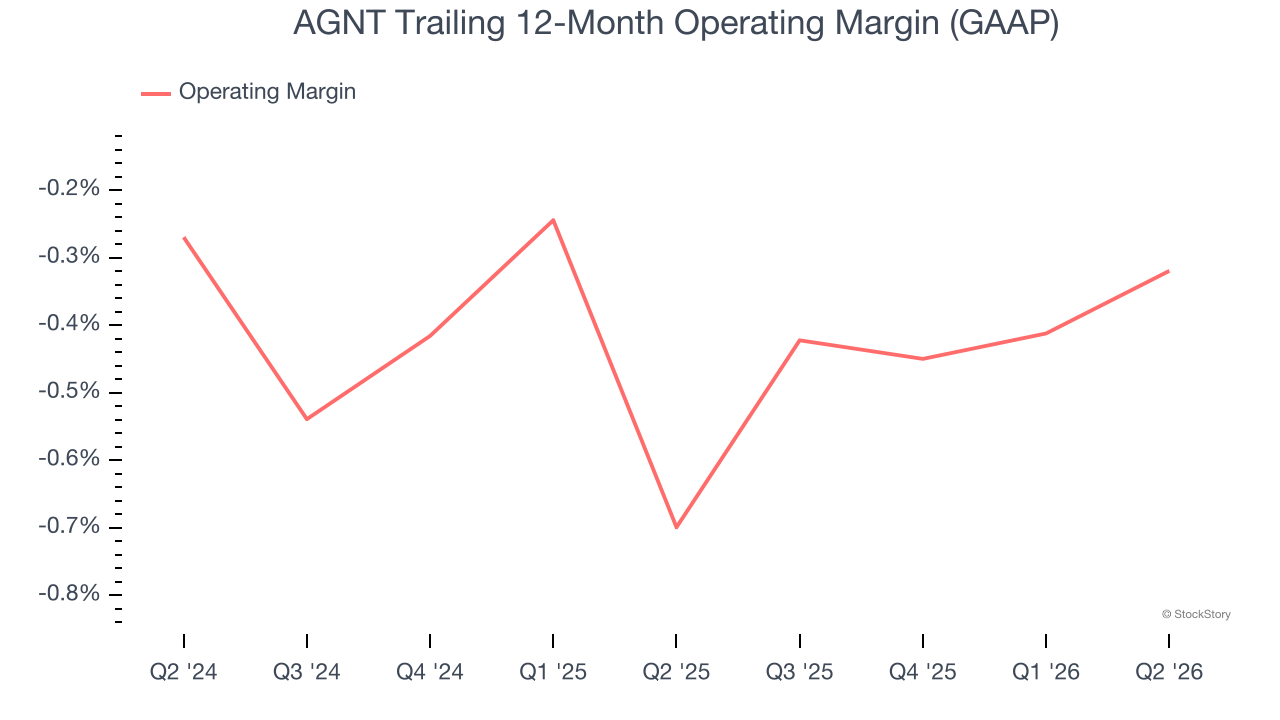
In Q2, AGNT’s breakeven margin was 0.1%, in line with the same quarter last year. This indicates the company’s overall cost structure has been relatively stable.
Earnings Per Share
We track the long-term change in earnings per share (EPS) for the same reason as long-term revenue growth. Compared to revenue, however, EPS highlights whether a company’s growth is profitable.
Sadly for AGNT, its EPS declined by 17.7% annually over the last five years while its revenue grew by 12.5%. This tells us the company became less profitable on a per-share basis as it expanded.
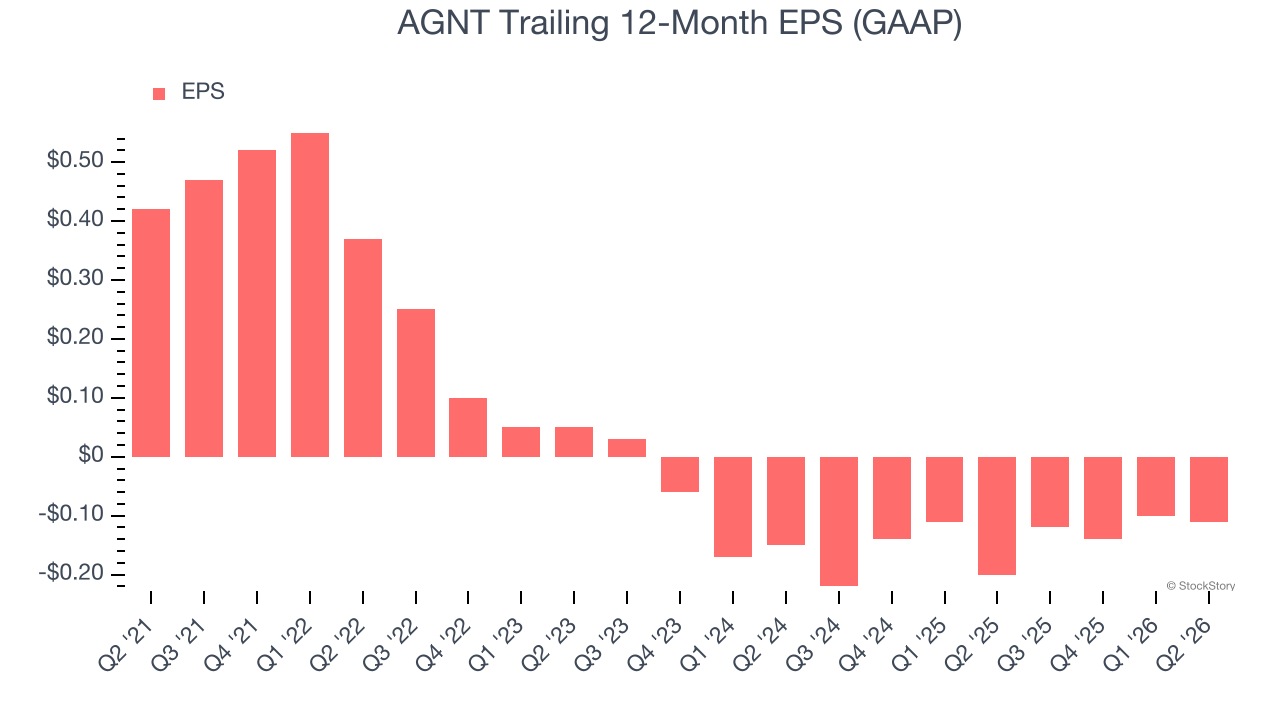
In Q2, AGNT reported EPS of negative $0.02, down from negative $0.01 in the same quarter last year. This print missed analysts’ estimates. Over the next 12 months, Wall Street is optimistic. Analysts forecast AGNT’s full-year EPS will flip from negative $0.11 to positive $0.10.
Key Takeaways from AGNT’s Q2 Results
We were impressed by how significantly AGNT blew past analysts’ EBITDA expectations this quarter. We were also glad its revenue guidance for next quarter exceeded Wall Street’s estimates. On the other hand, its full-year EBITDA guidance missed and its EPS fell short of Wall Street’s estimates. Overall, this quarter could have been better. The stock traded up 16.7% to $4.26 immediately after reporting.
So do we think AGNT is an attractive buy at the current price? We think that the latest quarter is only one piece of the longer-term business quality puzzle. Quality, when combined with valuation, can help determine if the stock is a buy. We cover that in our actionable full research report which you can read here (it’s free).