
Over the past six months, FTI Consulting’s shares (currently trading at $150.63) have posted a disappointing 13.8% loss, well below the S&P 500’s 10.9% gain. This was partly due to its softer quarterly results and may have investors wondering how to approach the situation.
Is there a buying opportunity in FTI Consulting, or does it present a risk to your portfolio? Get the full breakdown from our expert analysts, it’s free.
Why Is FTI Consulting Not Exciting?
Despite the more favorable entry price, we’re sitting this one out for now. Here are three reasons you should be careful with FCN, plus one stock we’d rather own.
1. Lackluster Revenue Growth
We at StockStory place the most emphasis on long-term growth, but within business services, a stretched historical view may miss recent innovations or disruptive industry trends. FTI Consulting’s recent performance shows its demand has slowed as its annualized revenue growth of 3.6% over the last two years was below its five-year trend. We’re wary when companies in the sector see decelerations in revenue growth, as it could signal changing consumer tastes aided by low switching costs. 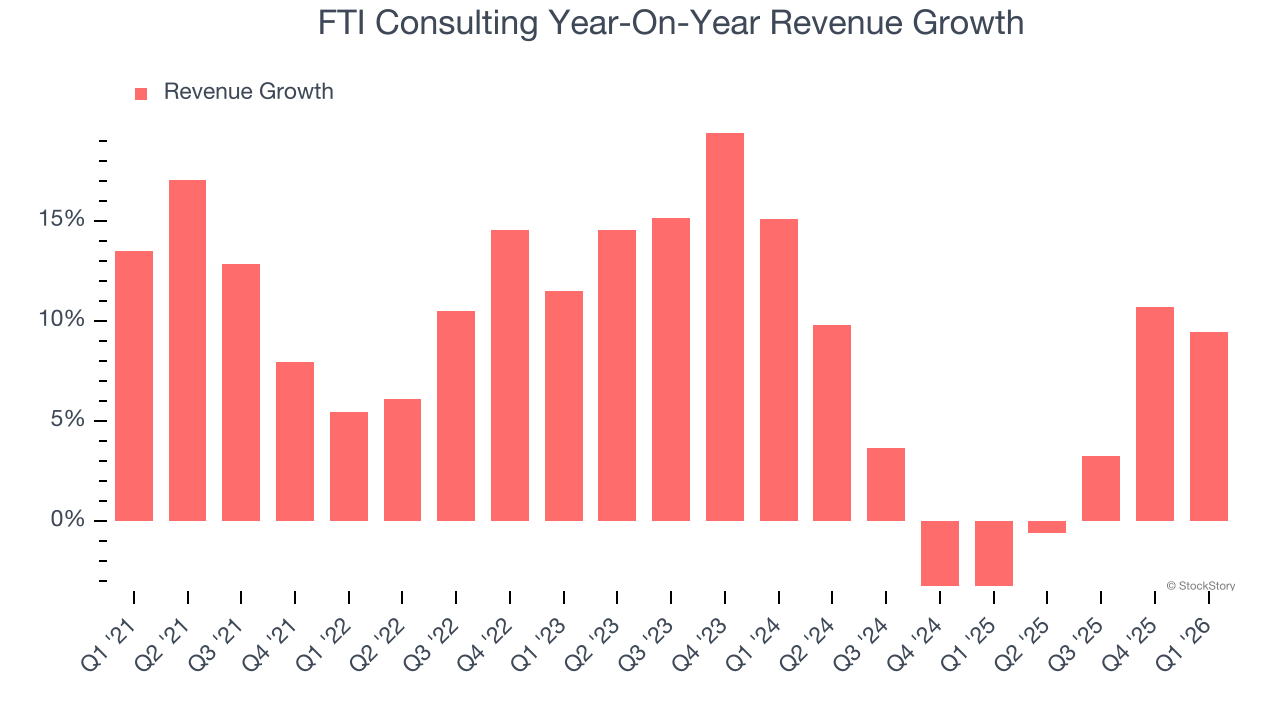
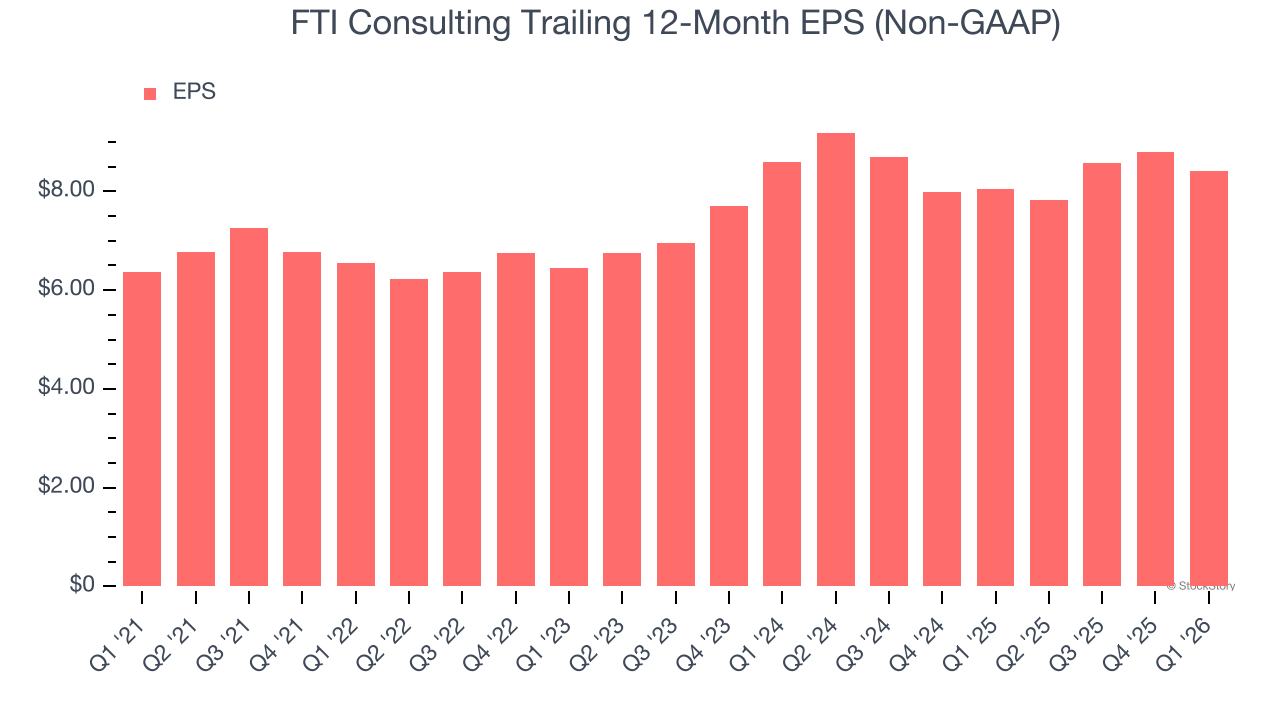
2. EPS Barely Growing
We track the long-term change in earnings per share (EPS) because it highlights whether a company’s growth is profitable.
FTI Consulting’s EPS grew at an unimpressive 5.7% compounded annual growth rate over the last five years, lower than its 8.8% annualized revenue growth. This tells us the company became less profitable on a per-share basis as it expanded.
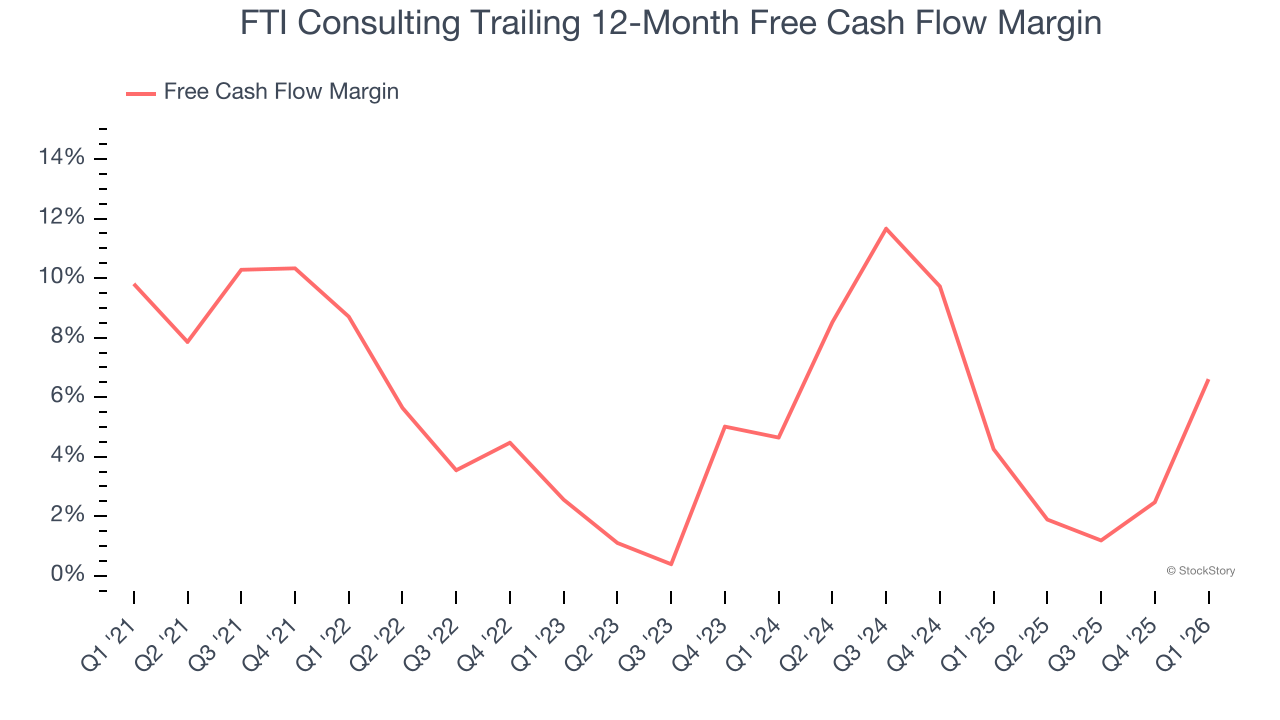
3. Free Cash Flow Margin Dropping
Free cash flow isn’t a prominently featured metric in company financials and earnings releases, but we think it’s telling because it accounts for all operating and capital expenses, making it tough to manipulate. Cash is king.
As you can see below, FTI Consulting’s margin dropped by 2.1 percentage points over the last five years. It may have ticked higher more recently, but shareholders are likely hoping for its margin to at least revert to its historical level. If the longer-term trend returns, it could signal increasing investment needs and capital intensity. FTI Consulting’s free cash flow margin for the trailing 12 months was 6.6%.
Final Judgment
FTI Consulting isn’t a terrible business, but it doesn’t pass our bar. Following the recent decline, the stock trades at $150.63 per share (or a forward price-to-sales ratio of 1.1×). The market typically values companies like FTI Consulting based on their anticipated profits for the next 12 months, but there aren’t enough published estimates to arrive at a reliable number. You should avoid this stock for now - better opportunities lie elsewhere. Let us point you toward an all-weather company that owns household favorite Taco Bell.
Stocks We Would Buy Instead of FTI Consulting
ALSO WORTH WATCHING: Top 5 Momentum Stocks. The best time to own a great stock is when the market is finally noticing it. These aren’t just high-quality businesses. Something is happening with them right now. Elite fundamentals meet near-term momentum — both boxes checked at the same time.
Find out which stocks our AI platform is flagging this week. See this week’s Strong Momentum stocks — FREE. Get Our Strong Momentum Stocks for Free HERE.
Stocks that have made our list include now familiar names such as Nvidia (+1,326% between June 2020 and June 2025) as well as under-the-radar businesses like the once-small-cap company Exlservice (+354% five-year return). Find your next big winner with StockStory today.