Oilfield services company RPC (NYSE: RES) reported Q1 CY2026 results exceeding the market’s revenue expectations, with sales up 36.6% year on year to $454.8 million. Its non-GAAP profit of $0.03 per share was in line with analysts’ consensus estimates.
Is now the time to buy RPC? Find out by accessing our full research report, it’s free.
RPC (RES) Q1 CY2026 Highlights:
- Revenue: $454.8 million vs analyst estimates of $400.3 million (36.6% year-on-year growth, 13.6% beat)
- Adjusted EPS: $0.03 vs analyst estimates of $0.03 (in line)
- Adjusted EBITDA: $53.52 million vs analyst estimates of $50.1 million (11.8% margin, 6.8% beat)
- Operating Margin: 0.6%, down from 3.7% in the same quarter last year
- Free Cash Flow was -$932,000, down from $7.60 million in the same quarter last year
- Market Capitalization: $1.61 billion
"During the first quarter we experienced modest revenue increases despite weather impacts to start the year. Our Technical Services segment revenues increased 7% sequentially. Within Technical Services, Cudd Energy Services' pressure pumping saw the largest percentage increase at 20% followed by Cudd Pressure Control's nitrogen service line which increased 13%. Thru Tubing Solutions' downhole tools increased 11% driven by higher activity supported by new technologies. Our Support Services segment revenues were flat sequentially, as the first quarter typically sees the biggest weather impact," stated Ben M. Palmer, RPC's President and Chief Executive Officer.
Company Overview
Operating primarily in the Permian Basin with 10 hydraulic fracturing fleets, RPC (NYSE: RES) provides specialized services and equipment like hydraulic fracturing, coiled tubing, and cementing to help oil and gas companies complete and maintain wells.
Revenue Growth
Cyclical industries such as Energy can make mediocre companies look great for a time, but a long-term view reveals which businesses can actually withstand and adapt to changing conditions. Luckily, RPC’s sales grew at an incredible 26.6% compounded annual growth rate over the last five years. Its growth beat the average energy upstream and integrated energy company and shows its offerings resonate with customers.
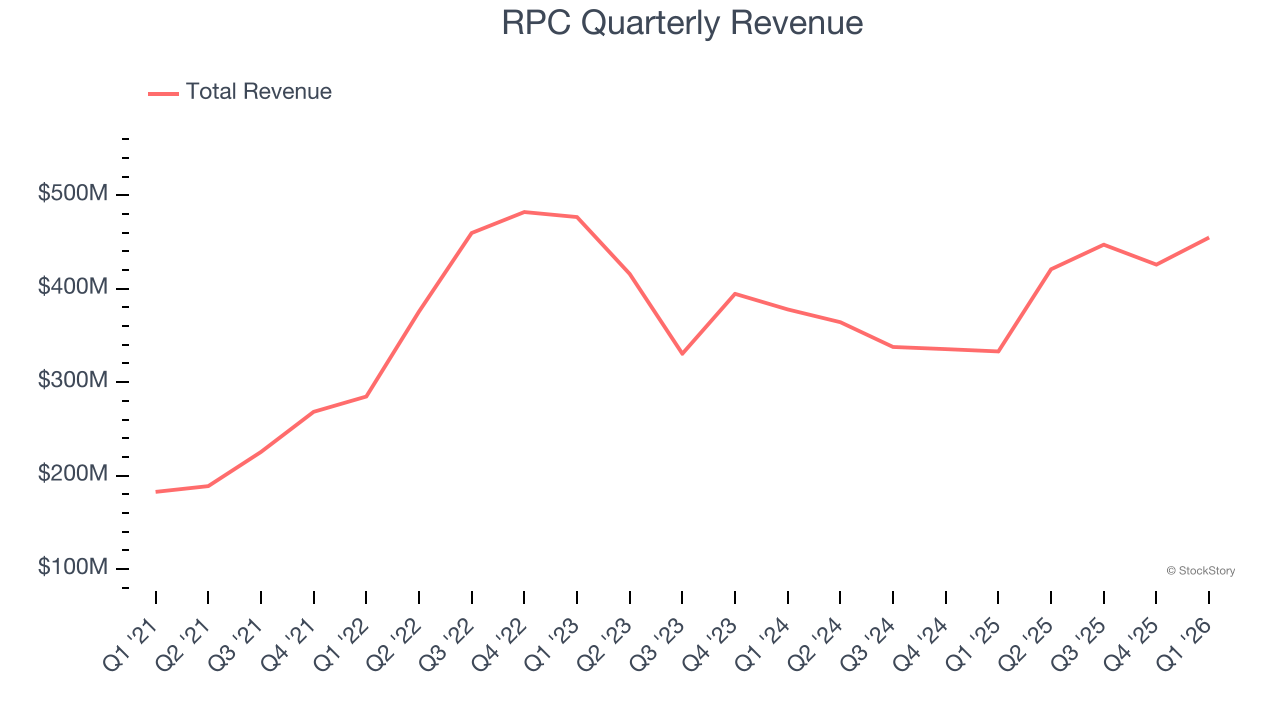
Within Energy, a singular timeframe, even if it’s quite long-term, only sheds light on how well a company rode the last commodity cycle. To better assess whether a company compounds through cycles, we validate our view with an even longer, ten-year view. RPC’s annualized revenue growth of 5.3% over the last ten years is below its five-year trend, but we still think the results suggest decent demand.
This quarter, RPC reported wonderful year-on-year revenue growth of 36.6%, and its $454.8 million of revenue exceeded Wall Street’s estimates by 13.6%.
ONE MORE THING: 3 Hidden Platforms Growing 3X Faster than Amazon, Google, and PayPal. Amazon, Google, and Meta all followed the same playbook: Dominate an ignored market. Build an unbeatable moat. Scale until you’re unstoppable.
These three platforms are running that exact playbook right now. The early investors in Amazon made fortunes. The early investors in these could do the same. Get All 3 Stocks Here for FREE.
Adjusted EBITDA Margin
RPC was profitable over the last five years but held back by its large cost base. Its average EBITDA margin of 18.3% was weak for an upstream and integrated energy business.
Analyzing the trend in its profitability, RPC’s EBITDA margin might fluctuated slightly but has generally stayed the same over the last year. This raises questions about the company’s expense base because its revenue growth should have given it leverage on its fixed costs, resulting in better economies of scale and profitability.
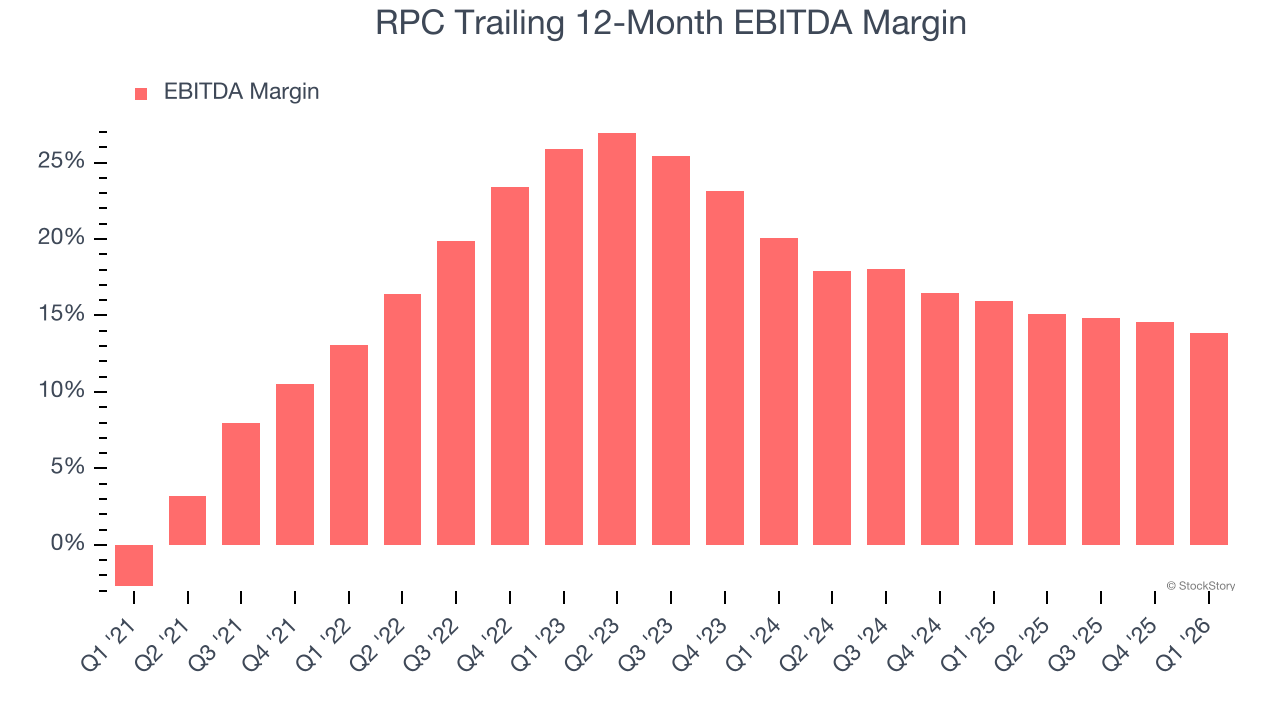
In Q1, RPC generated an EBITDA margin profit margin of 11.8%, down 2.9 percentage points year on year. This contraction shows it was less efficient because its expenses grew faster than its revenue. This adjusted EBITDA beat Wall Street’s estimates by 6.8%.
Cash Is King
As mentioned above, adjusted EBITDA ignores capital structure and drilling expenditure decisions. These are two huge aspects of an Energy producer, so in order to understand a comprehensive picture of business quality, an investor needs to account for these. Said differently, adjusted EBITDA margins could be solid but free cash flow is abysmal because decline rates of the asset are extreme and the drilling is expensive. Free cash flow tells you about not only the economics of the production that has happened but how much it costs to stay in business as well (further drilling or extraction).
RPC has shown mediocre cash profitability relative to peers over the last five years, giving the company fewer opportunities to return capital to shareholders. Its free cash flow margin averaged 5.9%, below what we’d expect for an upstream and integrated energy business.
Absolute FCF margin levels matter but so does stability of free cash flow. All else equal, we’d prefer a 25.0% average free cash flow margin that is quite steady no matter how commodity prices behave rather than extremely high margins when times are good and negative ones when they’re tough.
RPC’s ratio of quarterly free cash flow volatility to WTI crude price volatility over the past five years was 12 (lower is better), indicating that its cash generation is far more sensitive to commodity-price swings than most peers. This elevated volatility limits its access to capital in downturns and makes it unlikely to act as a consolidator when weaker competitors come under pressure.
You may be asking why we wait until the free cash flow line to perform this stability analysis versus commodity prices. Why not compare revenue or EBITDA to WTI in the case of RPC? Because what ultimately matters is not how much revenue or profit you earn when prices are high but how much cash you can generate when prices are low. Free cash flow is the superior metric because it includes everything from hedging prowess to growth and maintenance capex to management behavior during good times and bad.
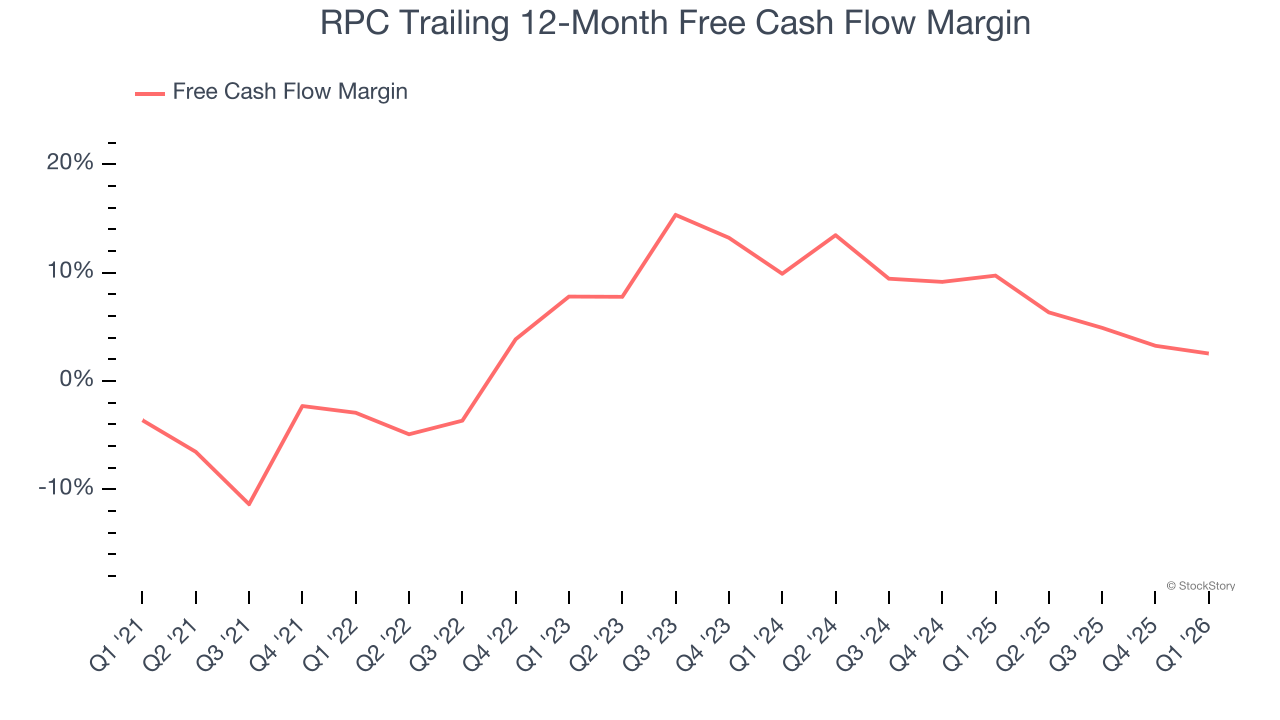
RPC broke even from a free cash flow perspective in Q1. The company’s cash profitability regressed as it was 2.5 percentage points lower than in the same quarter last year, prompting us to pay closer attention. Short-term fluctuations typically aren’t a big deal because investment needs can be seasonal, but we’ll be watching to see if the trend extrapolates into future quarters.
Key Takeaways from RPC’s Q1 Results
We were impressed by how significantly RPC blew past analysts’ revenue expectations this quarter. We were also glad its EPS was in line with Wall Street’s estimates. Zooming out, we think this was a solid print. The stock traded up 2% to $7.53 immediately following the results.
Indeed, RPC had a rock-solid quarterly earnings result, but is this stock a good investment here? The latest quarter does matter, but not nearly as much as longer-term fundamentals and valuation, when deciding if the stock is a buy. We cover that in our actionable full research report which you can read here (it’s free).