Oceaneering has been on fire lately. In the past six months alone, the company’s stock price has rocketed 57.4%, reaching $38.68 per share. This performance may have investors wondering how to approach the situation.
Is there a buying opportunity in Oceaneering, or does it present a risk to your portfolio? Check out our in-depth research report to see what our analysts have to say, it’s free.
Why Do We Think Oceaneering Will Underperform?
We’re glad investors have benefited from the price increase, but we're swiping left on Oceaneering for now. Here are three reasons there are better opportunities than OII and a stock we'd rather own.
1. Long-Term Revenue Growth Shows Momentum
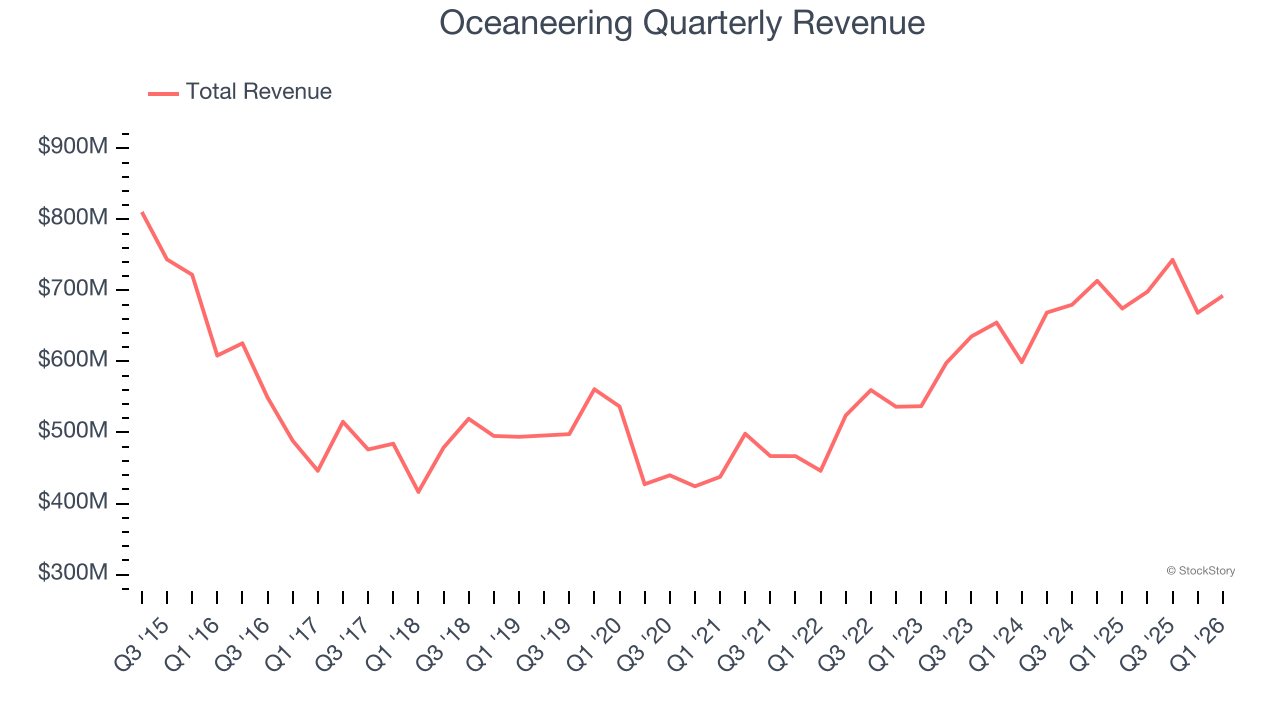
Cyclical sectors like Energy often flatter weaker operators during favorable price environments, but a longer-term lens separates those from businesses that can consistently perform across market cycles. Over the last five years, Oceaneering grew its sales at a decent 10.1% compounded annual growth rate. Its growth was slightly above the average energy upstream and integrated energy company and shows its offerings resonate with customers.
2. Low Gross Margin Reveals Weak Structural Profitability
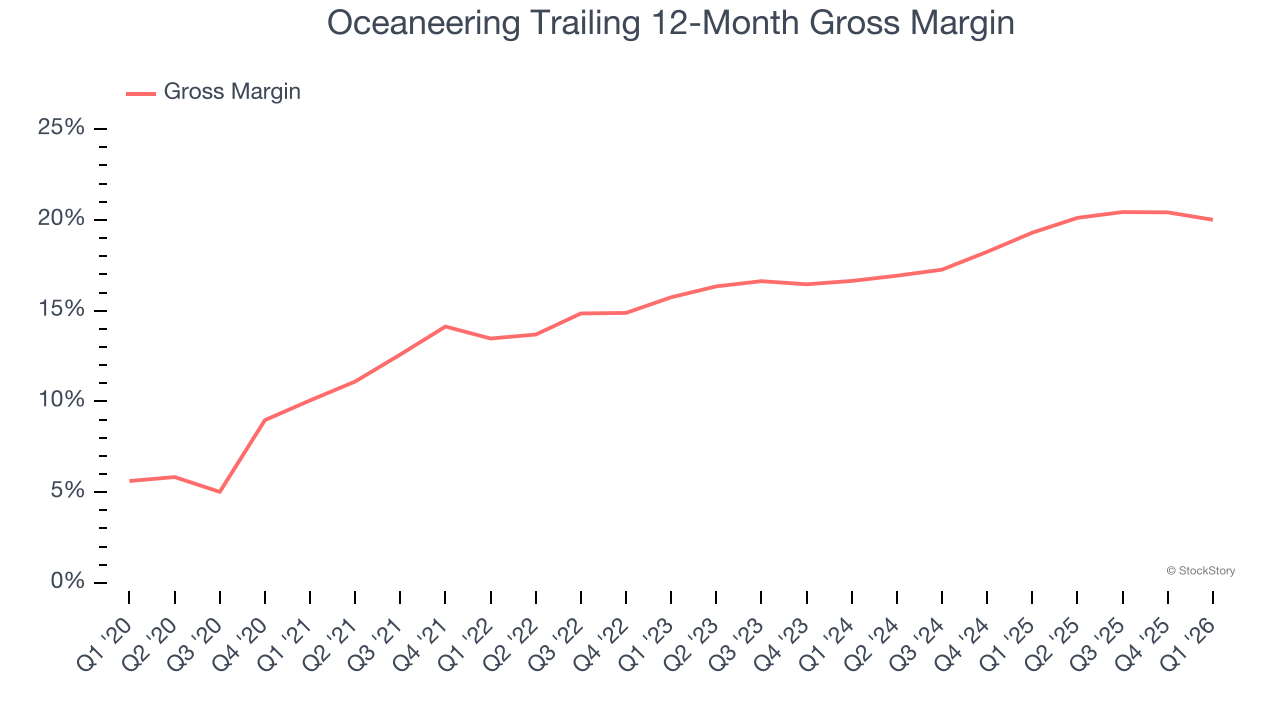
In a single quarter or year, gross margins in the sector can swing wildly due to commodity prices, hedging, or changes in labor costs. Over a multi-year period across different points in the cycle, gross margin differences can signal whether a company is a structurally-advantaged producer (“rock” quality, takeaway, operating costs) or not.
Oceaneering, which averaged 17.4% gross margin over the last five years, exhibiting bottom-tier unit economics in the sector. It means the company will struggle at higher commodity prices than peers with better gross margins.
3. Mediocre Free Cash Flow Margin Limits Reinvestment Potential
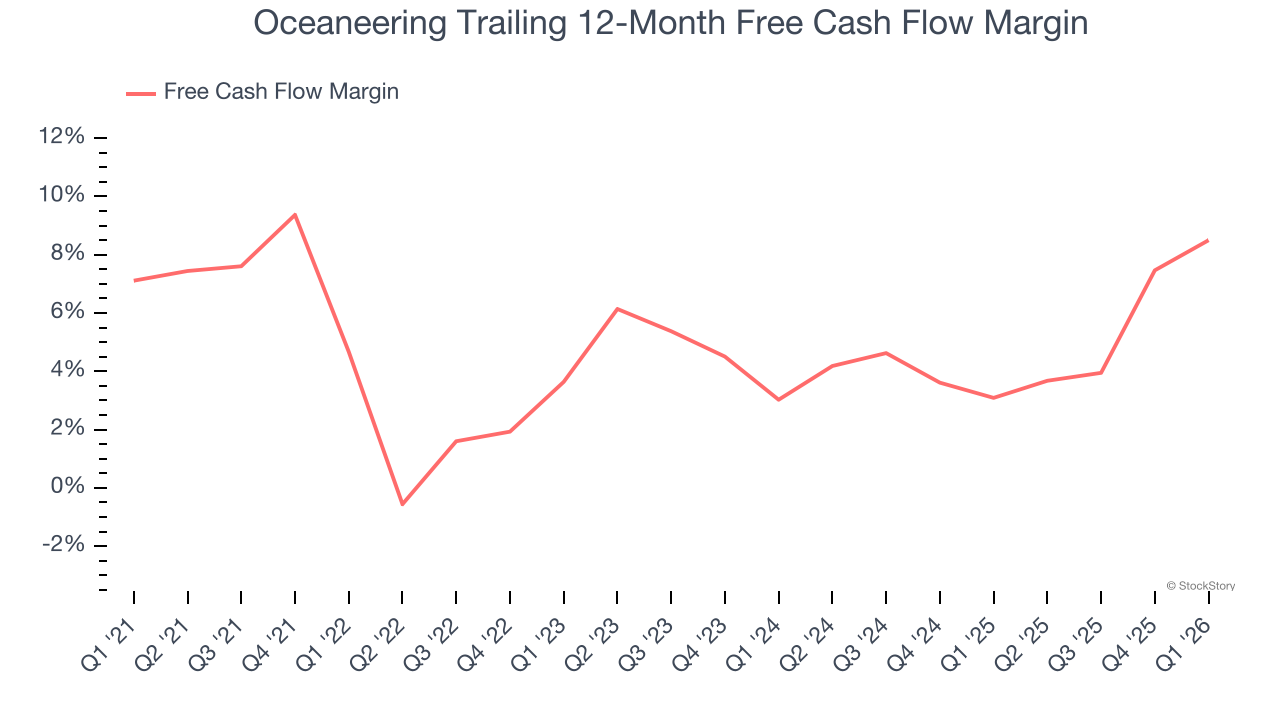
Free cash flow isn't a prominently featured metric in company financials and earnings releases, but we think it's telling because it accounts for all operating and capital expenses, making it tough to manipulate. Cash is king.
Oceaneering has shown weak cash profitability relative to peers over the last five years, giving the company fewer opportunities to return capital to shareholders. Its free cash flow margin averaged 4.7%, below what we’d expect for an upstream and integrated energy business.
Final Judgment
Oceaneering doesn’t pass our quality test. Following the recent surge, the stock trades at $38.68 per share (or a forward price-to-sales ratio of 1.3×). The market typically values companies like Oceaneering based on their anticipated profits for the next 12 months, but there aren’t enough published estimates to arrive at a reliable number. You should avoid this stock for now - better opportunities lie elsewhere. We’d suggest looking at an all-weather company that owns household favorite Taco Bell.
Stocks We Would Buy Instead of Oceaneering
ONE MORE THING: Top 6 Stocks for This Week. This market is separating quality stocks from expensive ones fast. AI taking down whole sectors with no warning. In a rotation this fast, you need more than a list of good companies.
Our AI system flagged Palantir before it ran 1,662%. AppLovin before it ran 753%. Nvidia before it ran 1,178%. Each week it produces 6 new names that pass the same tests. Get Our Top 6 Stocks for Free HERE.
Stocks that have made our list include now familiar names such as Nvidia (+1,326% between June 2020 and June 2025) as well as under-the-radar businesses like the once-small-cap company Exlservice (+354% five-year return). Find your next big winner with StockStory today.