

The past six months have been a windfall for Rush Street Interactive’s shareholders. The company’s stock price has jumped 49.3%, hitting $27.07 per share. This was partly due to its solid quarterly results, and the run-up might have investors contemplating their next move.
Is now the time to buy Rush Street Interactive, or should you be careful about including it in your portfolio? See what our analysts have to say in our full research report, it’s free.
Why Do We Think Rush Street Interactive Will Underperform?
Despite the momentum, we don't have much confidence in Rush Street Interactive. Here are three reasons you should be careful with RSI and a stock we'd rather own.
1. Long-Term Revenue Growth Disappoints
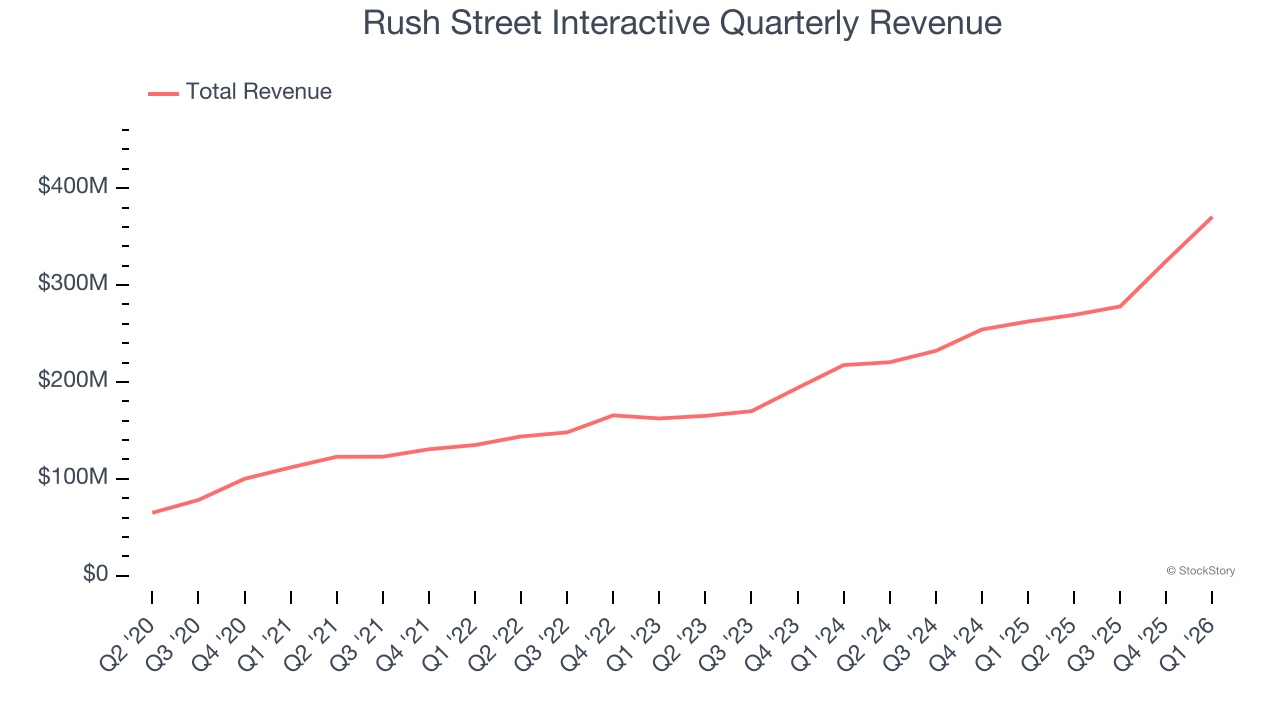
Examining a company’s long-term performance can provide clues about its quality. Any business can experience short-term success, but top-performing ones enjoy sustained growth for years. Over the last five years, Rush Street Interactive grew its sales at a 28.5% compounded annual growth rate. Although this growth is acceptable on an absolute basis, it fell slightly short of our standards for the consumer discretionary sector, which enjoys a number of secular tailwinds.
2. Weak Operating Margin Could Cause Trouble
Operating margin is a key measure of profitability. Think of it as net income - the bottom line - excluding the impact of taxes and interest on debt, which are less connected to business fundamentals.
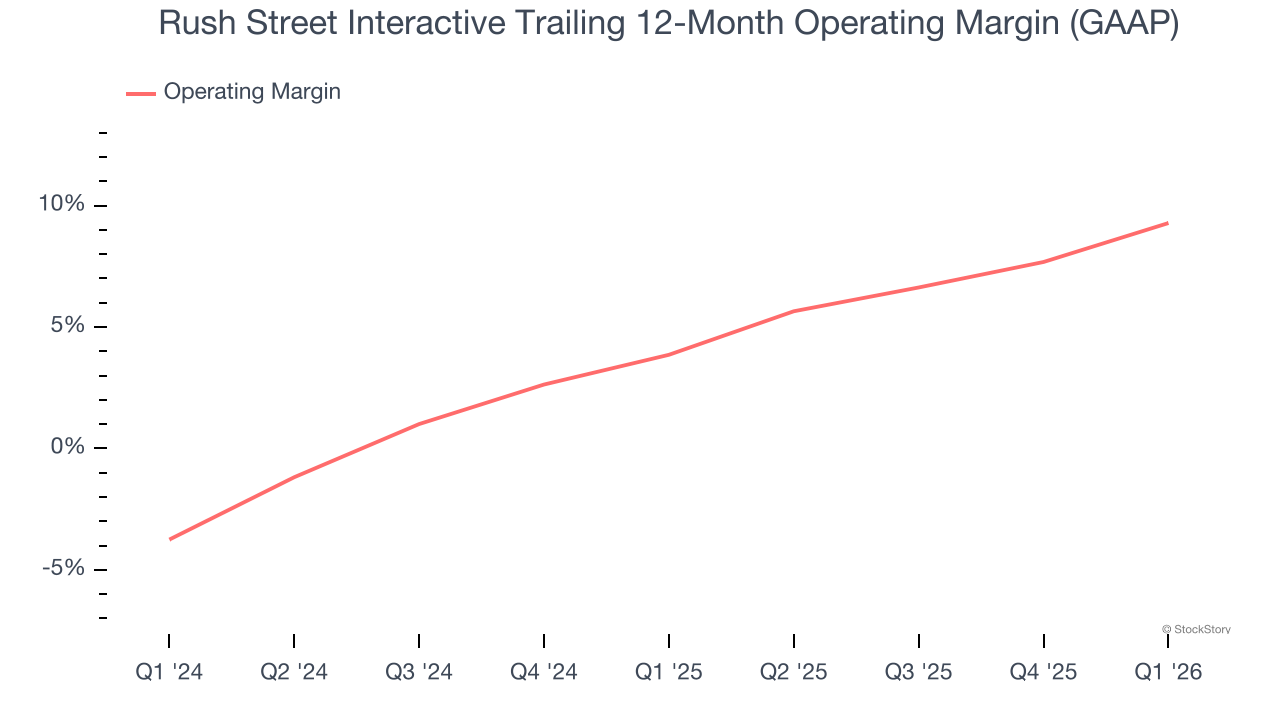
Rush Street Interactive’s operating margin has been trending up over the last 12 months and averaged 6.9% over the last two years. The company’s higher efficiency is a breath of fresh air, but its suboptimal cost structure means it still sports inadequate profitability for a consumer discretionary business.
3. Projected Free Cash Flow Gains to Pump Profits
If you’ve followed StockStory for a while, you know we emphasize free cash flow. Why, you ask? We believe that in the end, cash is king, and you can’t use accounting profits to pay the bills.
Over the next year, analysts predict Rush Street Interactive’s cash conversion will slightly improve. Their consensus estimates imply its free cash flow margin of 12.5% for the last 12 months will increase to 15%, giving it more flexibility for investments, share buybacks, and dividends.
Final Judgment
We see the value of companies helping consumers, but in the case of Rush Street Interactive, we’re out. After the recent surge, the stock trades at 40.6× forward P/E (or $27.07 per share). While this valuation is reasonable, we don’t see a big opportunity at the moment. There are superior stocks to buy right now. We’d recommend looking at one of our top digital advertising picks.
High-Quality Stocks for All Market Conditions
WHILE YOU’RE HERE: Top 9 Market-Beating Stocks. The best stocks don't just beat the market once. They do it again. And again. Robust revenue growth, rising free cash flow, returns on capital that leave their competition in the dust. The market has already rewarded these businesses.
But our AI platform says the party isn't over. Find out which 9 stocks made the cut this week - FREE. Get Our Top 9 Market-Beating Stocks for Free HERE.
Stocks that have made our list include now familiar names such as Nvidia (+1,326% between June 2020 and June 2025) as well as under-the-radar businesses like the once-micro-cap company Kadant (+351% five-year return). Find your next big winner with StockStory today.