
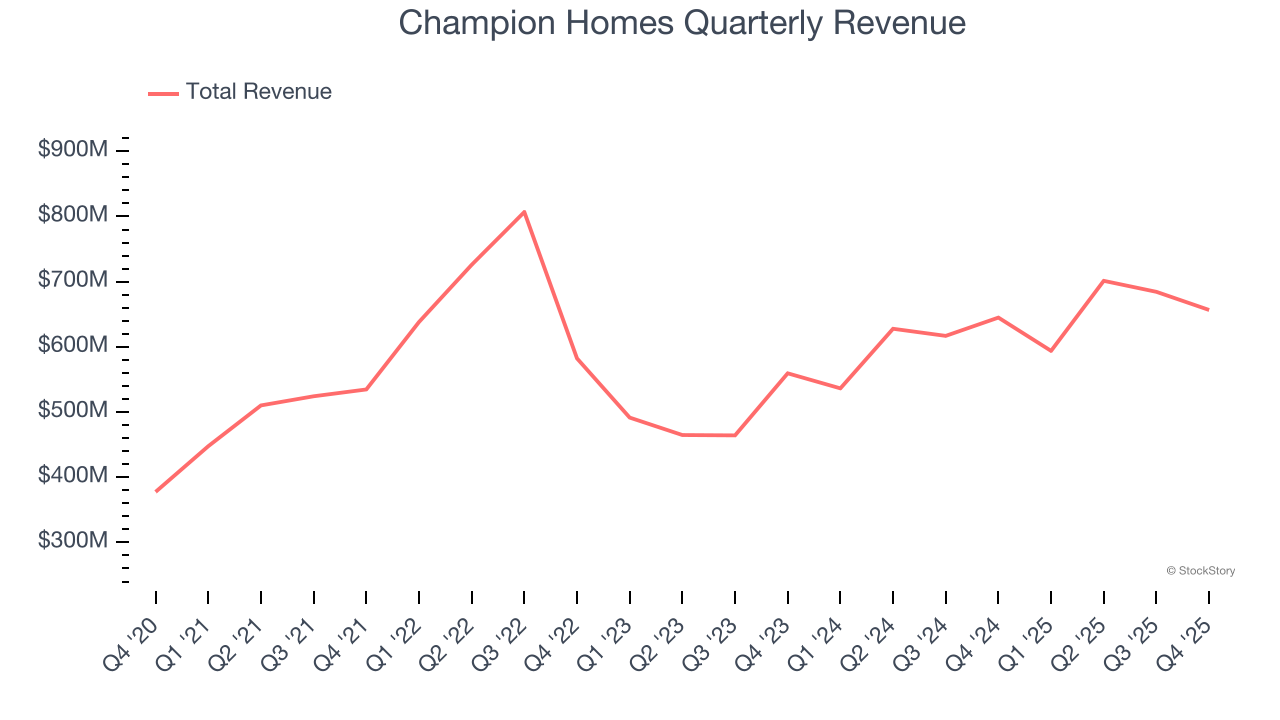
Modular home and building manufacturer Champion Homes (NYSE: SKY) met Wall Streets revenue expectations in Q4 CY2025, with sales up 1.8% year on year to $656.6 million. Its non-GAAP profit of $0.96 per share was 14.1% above analysts’ consensus estimates.
Is now the time to buy Champion Homes? Find out by accessing our full research report, it’s free.
Champion Homes (SKY) Q4 CY2025 Highlights:
- Revenue: $656.6 million vs analyst estimates of $655.9 million (1.8% year-on-year growth, in line)
- Adjusted EPS: $0.96 vs analyst estimates of $0.84 (14.1% beat)
- Adjusted EBITDA: $74.78 million vs analyst estimates of $68.97 million (11.4% margin, 8.4% beat)
- Operating Margin: 9.5%, down from 11.3% in the same quarter last year
- Free Cash Flow Margin: 14.1%, up from 5.7% in the same quarter last year
- Sales Volumes fell 2.6% year on year (14.1% in the same quarter last year)
- Market Capitalization: $4.24 billion
Company Overview
Founded in 1951, Champion Homes (NYSE: SKY) is a manufacturer of modular homes and buildings in North America.
Revenue Growth
Reviewing a company’s long-term sales performance reveals insights into its quality. Even a bad business can shine for one or two quarters, but a top-tier one grows for years. Thankfully, Champion Homes’s 15.6% annualized revenue growth over the last five years was incredible. Its growth beat the average industrials company and shows its offerings resonate with customers.
We at StockStory place the most emphasis on long-term growth, but within industrials, a half-decade historical view may miss cycles, industry trends, or a company capitalizing on catalysts such as a new contract win or a successful product line. Champion Homes’s annualized revenue growth of 15.4% over the last two years aligns with its five-year trend, suggesting its demand was predictably strong. 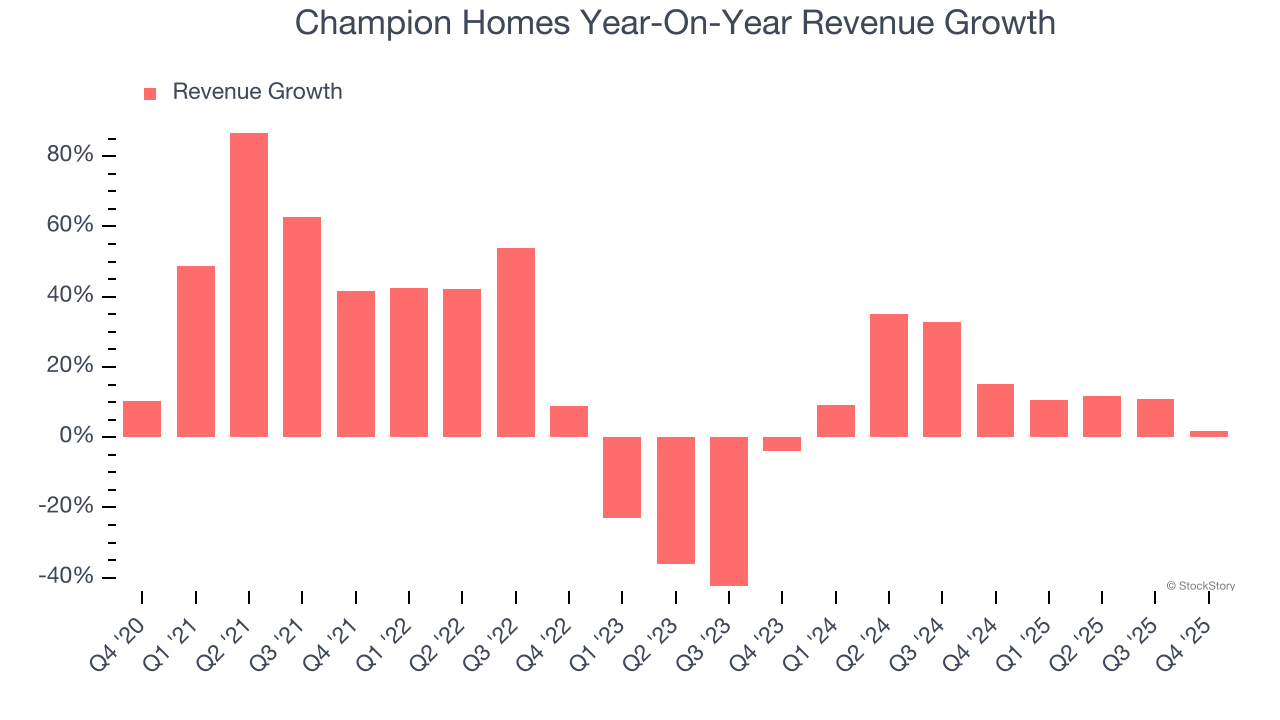
We can dig further into the company’s revenue dynamics by analyzing its number of units sold, which reached 6,270 in the latest quarter. Over the last two years, Champion Homes’s units sold averaged 13.6% year-on-year growth. Because this number is lower than its revenue growth, we can see the company benefited from price increases. 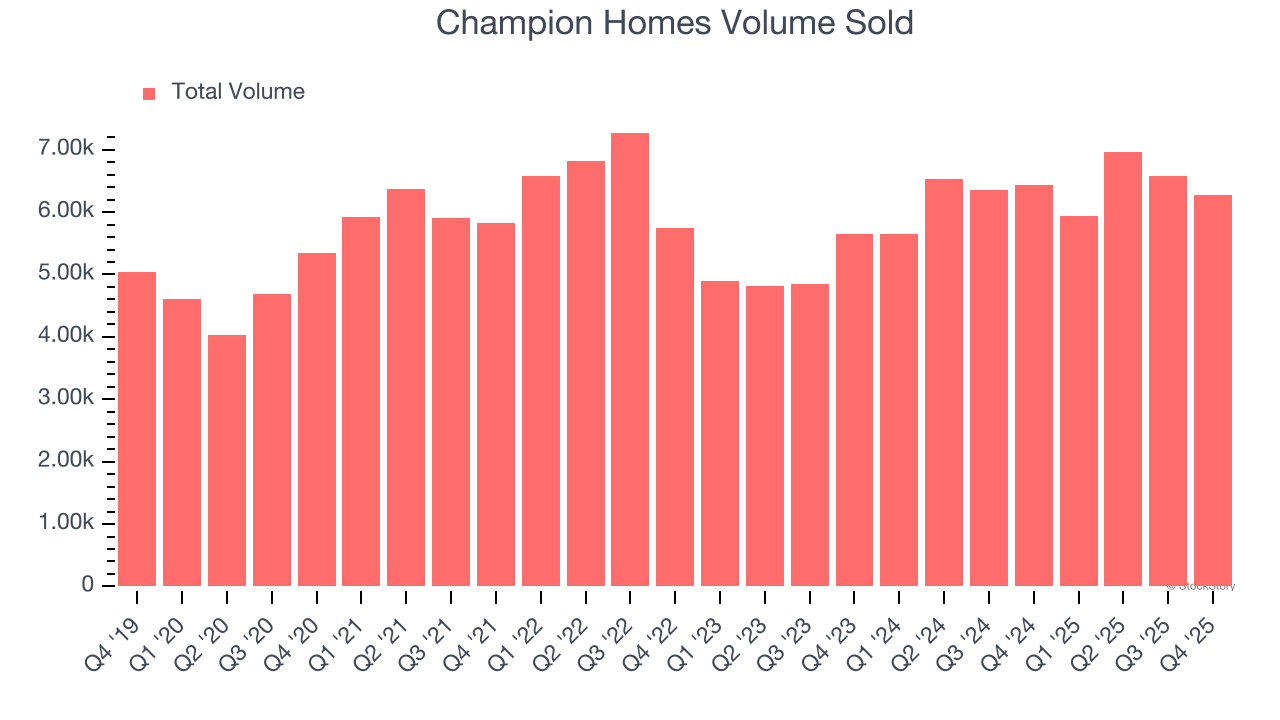
This quarter, Champion Homes grew its revenue by 1.8% year on year, and its $656.6 million of revenue was in line with Wall Street’s estimates.
Looking ahead, sell-side analysts expect revenue to grow 3.3% over the next 12 months, a deceleration versus the last two years. This projection doesn't excite us and suggests its products and services will see some demand headwinds.
Microsoft, Alphabet, Coca-Cola, Monster Beverage—all began as under-the-radar growth stories riding a massive trend. We’ve identified the next one: a profitable AI semiconductor play Wall Street is still overlooking. Go here for access to our full report.
Operating Margin
Operating margin is one of the best measures of profitability because it tells us how much money a company takes home after procuring and manufacturing its products, marketing and selling those products, and most importantly, keeping them relevant through research and development.
Champion Homes has been an efficient company over the last five years. It was one of the more profitable businesses in the industrials sector, boasting an average operating margin of 12.9%. This result was particularly impressive because of its low gross margin, which is mostly a factor of what it sells and takes huge shifts to move meaningfully. Companies have more control over their operating margins, and it’s a show of well-managed operations if they’re high when gross margins are low.
Looking at the trend in its profitability, Champion Homes’s operating margin decreased by 3.3 percentage points over the last five years. This raises questions about the company’s expense base because its revenue growth should have given it leverage on its fixed costs, resulting in better economies of scale and profitability.
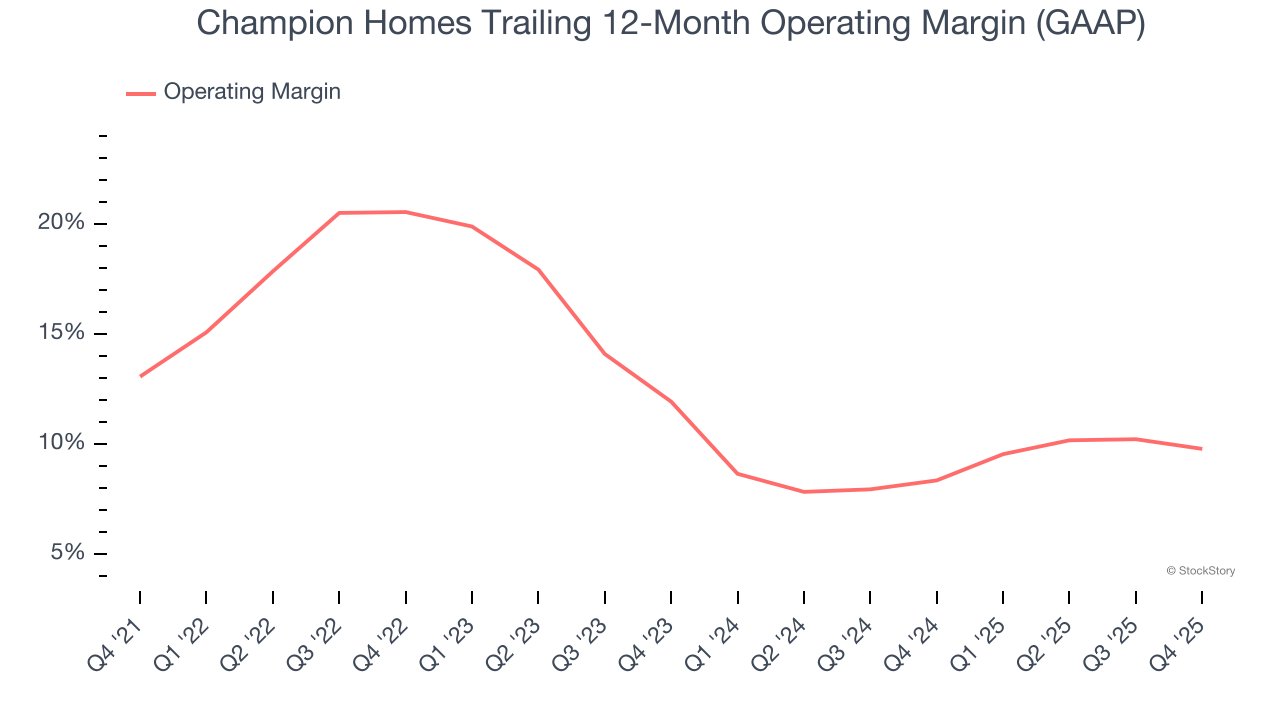
In Q4, Champion Homes generated an operating margin profit margin of 9.5%, down 1.8 percentage points year on year. Since Champion Homes’s gross margin decreased more than its operating margin, we can assume its recent inefficiencies were driven more by weaker leverage on its cost of sales rather than increased marketing, R&D, and administrative overhead expenses.
Earnings Per Share
Revenue trends explain a company’s historical growth, but the long-term change in earnings per share (EPS) points to the profitability of that growth – for example, a company could inflate its sales through excessive spending on advertising and promotions.
Champion Homes’s EPS grew at an astounding 29.4% compounded annual growth rate over the last five years, higher than its 15.6% annualized revenue growth. This tells us the company became more profitable on a per-share basis as it expanded.
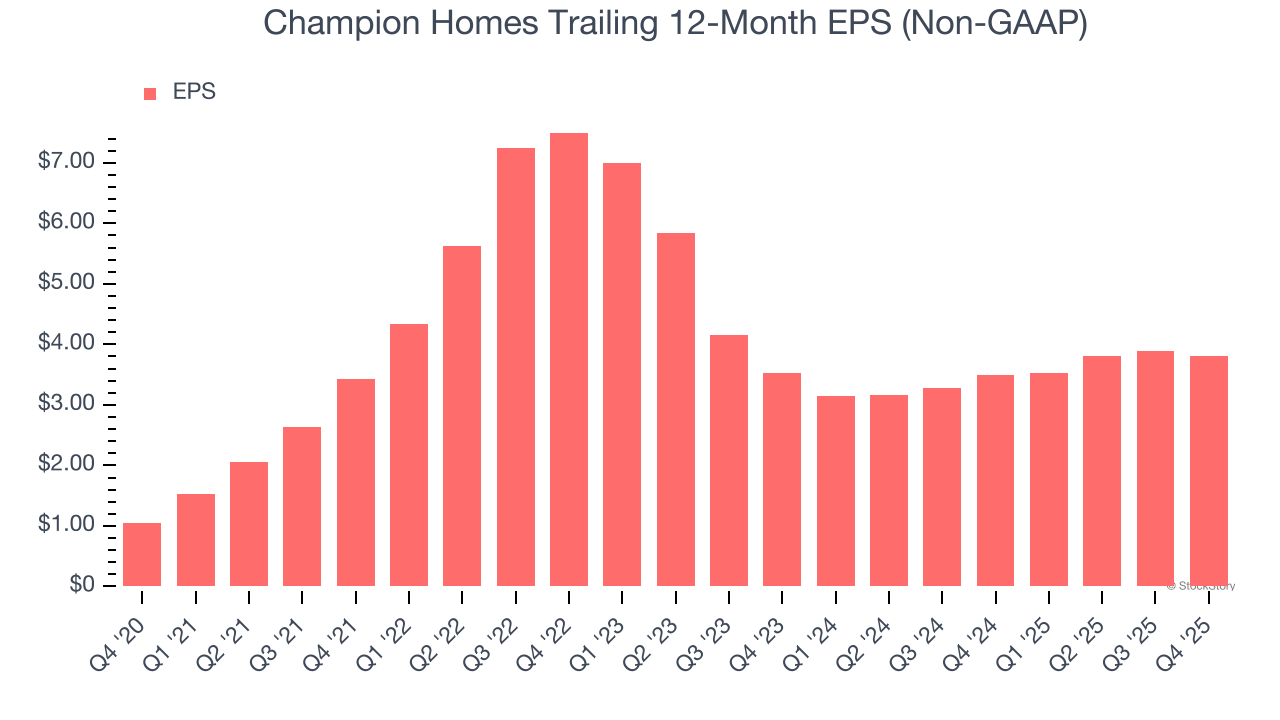
We can take a deeper look into Champion Homes’s earnings to better understand the drivers of its performance. A five-year view shows that Champion Homes has repurchased its stock, shrinking its share count by 1.3%. This tells us its EPS outperformed its revenue not because of increased operational efficiency but financial engineering, as buybacks boost per share earnings. 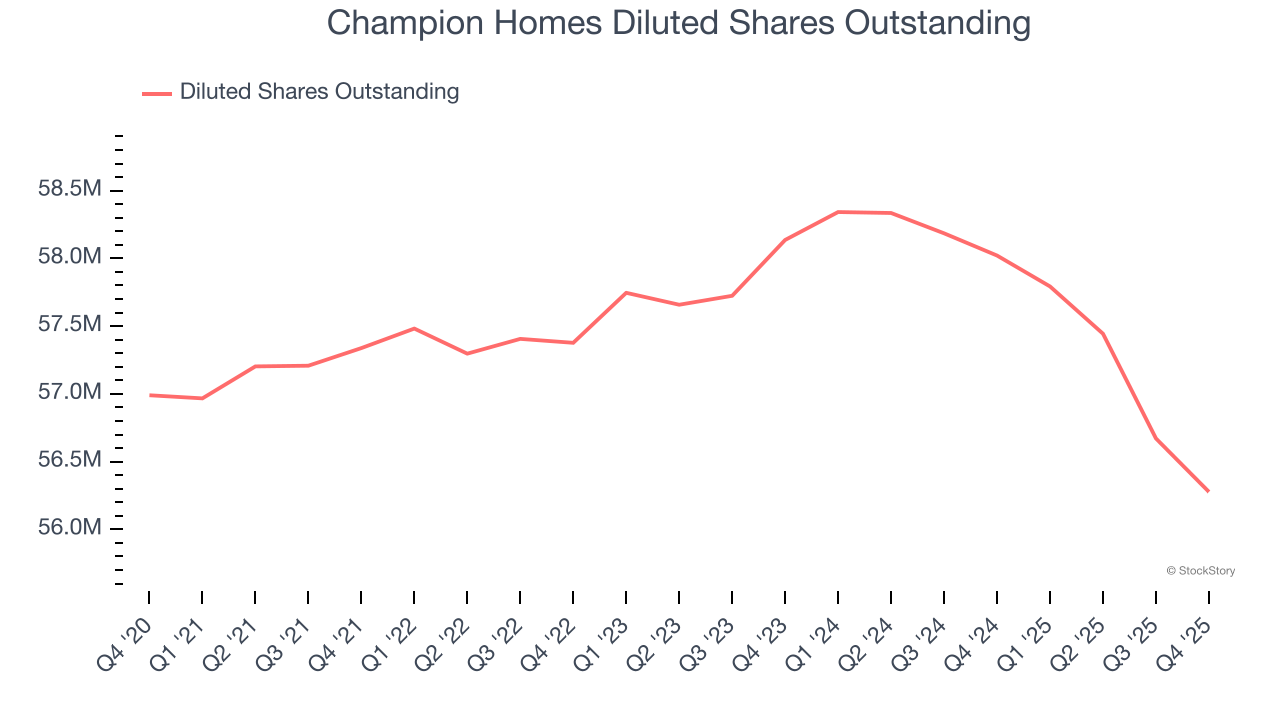
Like with revenue, we analyze EPS over a more recent period because it can provide insight into an emerging theme or development for the business.
For Champion Homes, its two-year annual EPS growth of 3.9% was lower than its five-year trend. We hope its growth can accelerate in the future.
In Q4, Champion Homes reported adjusted EPS of $0.96, down from $1.04 in the same quarter last year. Despite falling year on year, this print easily cleared analysts’ estimates. Over the next 12 months, Wall Street expects Champion Homes’s full-year EPS of $3.81 to shrink by 3.4%.
Key Takeaways from Champion Homes’s Q4 Results
We were impressed by how significantly Champion Homes blew past analysts’ EBITDA expectations this quarter. We were also glad its EPS outperformed Wall Street’s estimates. Zooming out, we think this quarter featured some important positives. The stock remained flat at $77.69 immediately after reporting.
Champion Homes put up rock-solid earnings, but one quarter doesn’t necessarily make the stock a buy. Let’s see if this is a good investment. If you’re making that decision, you should consider the bigger picture of valuation, business qualities, as well as the latest earnings. We cover that in our actionable full research report which you can read here (it’s free).