Children’s apparel manufacturer Carter’s (NYSE: CRI) beat Wall Street’s revenue expectations in Q4 CY2025, with sales up 7.6% year on year to $925.5 million. Its non-GAAP profit of $1.90 per share was 11.5% above analysts’ consensus estimates.
Is now the time to buy Carter's? Find out by accessing our full research report, it’s free.
Carter's (CRI) Q4 CY2025 Highlights:
- Revenue: $925.5 million vs analyst estimates of $917.8 million (7.6% year-on-year growth, 0.8% beat)
- Adjusted EPS: $1.90 vs analyst estimates of $1.70 (11.5% beat)
- Adjusted EBITDA: $105 million vs analyst estimates of $104.7 million (11.3% margin, in line)
- Adjusted EPS guidance for Q1 CY2026 is $0.05 at the midpoint, below analyst estimates of $0.36
- Operating Margin: 9.2%, in line with the same quarter last year
- Same-Store Sales rose 4.7% year on year (-3.4% in the same quarter last year)
- Market Capitalization: $1.53 billion
“Carter’s delivered improved fourth quarter results with each of our business segments posting sales growth over last year. We see momentum building behind our products and demand creation initiatives, which have driven an improvement in the rate of traffic, new customer acquisition, higher realized pricing, and increased penetration of the best portions of our product assortments. All of this gives us confidence that our strategies are gaining traction,” said Douglas C. Palladini, Chief Executive Officer & President.
Company Overview
Rumored to sell more than 10 products for every child born in the United States, Carter's (NYSE: CRI) is an American designer and marketer of children's apparel.
Revenue Growth
Examining a company’s long-term performance can provide clues about its quality. Any business can put up a good quarter or two, but many enduring ones grow for years. Unfortunately, Carter's struggled to consistently increase demand as its $2.9 billion of sales for the trailing 12 months was close to its revenue five years ago. This was below our standards and suggests it’s a low quality business.
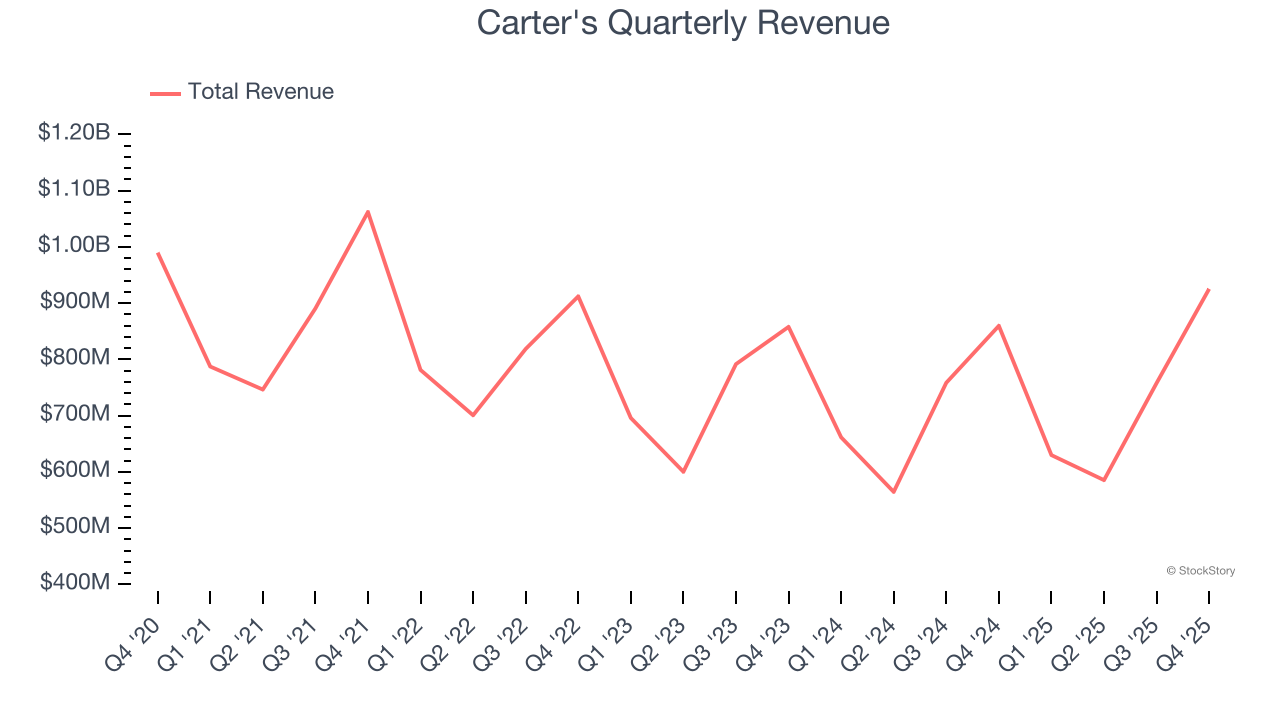
Long-term growth is the most important, but within consumer discretionary, product cycles are short and revenue can be hit-driven due to rapidly changing trends and consumer preferences. Just like its five-year trend, Carter’s revenue over the last two years was flat, suggesting it is in a slump. 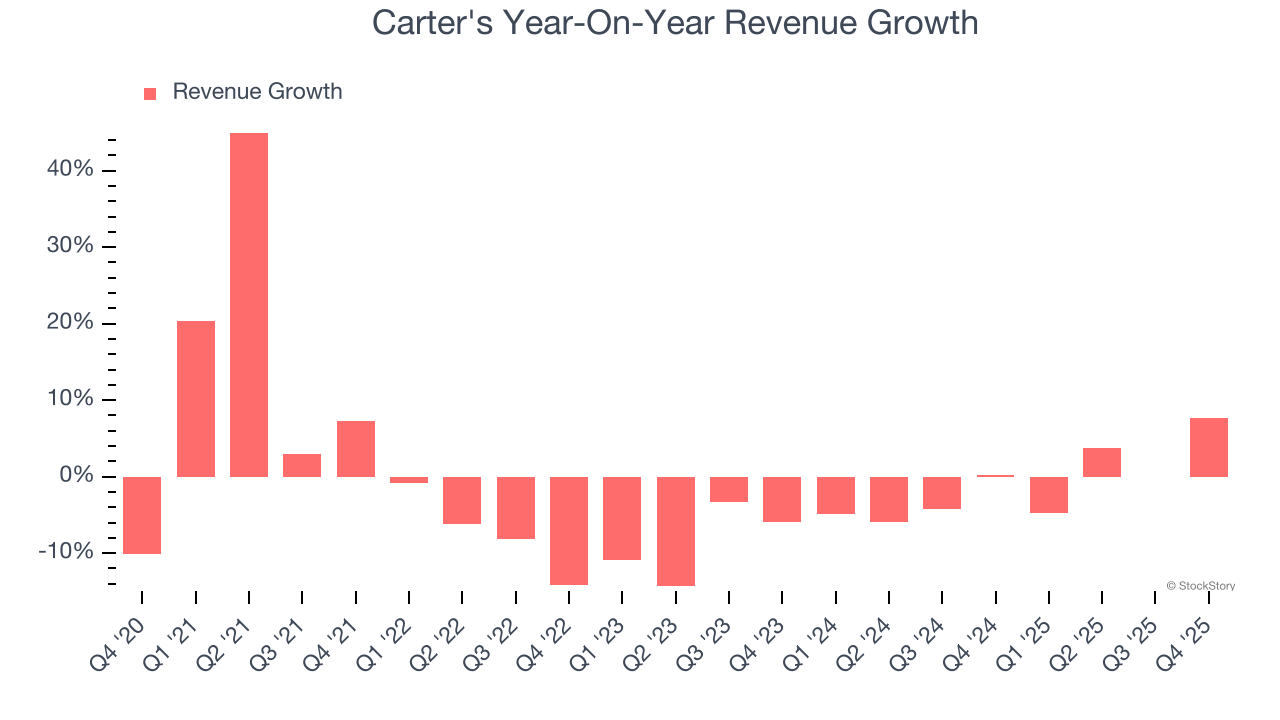
We can dig further into the company’s revenue dynamics by analyzing its same-store sales, which show how much revenue its established locations generate. Over the last two years, Carter’s same-store sales were flat. This number doesn’t surprise us as it’s in line with its revenue growth. 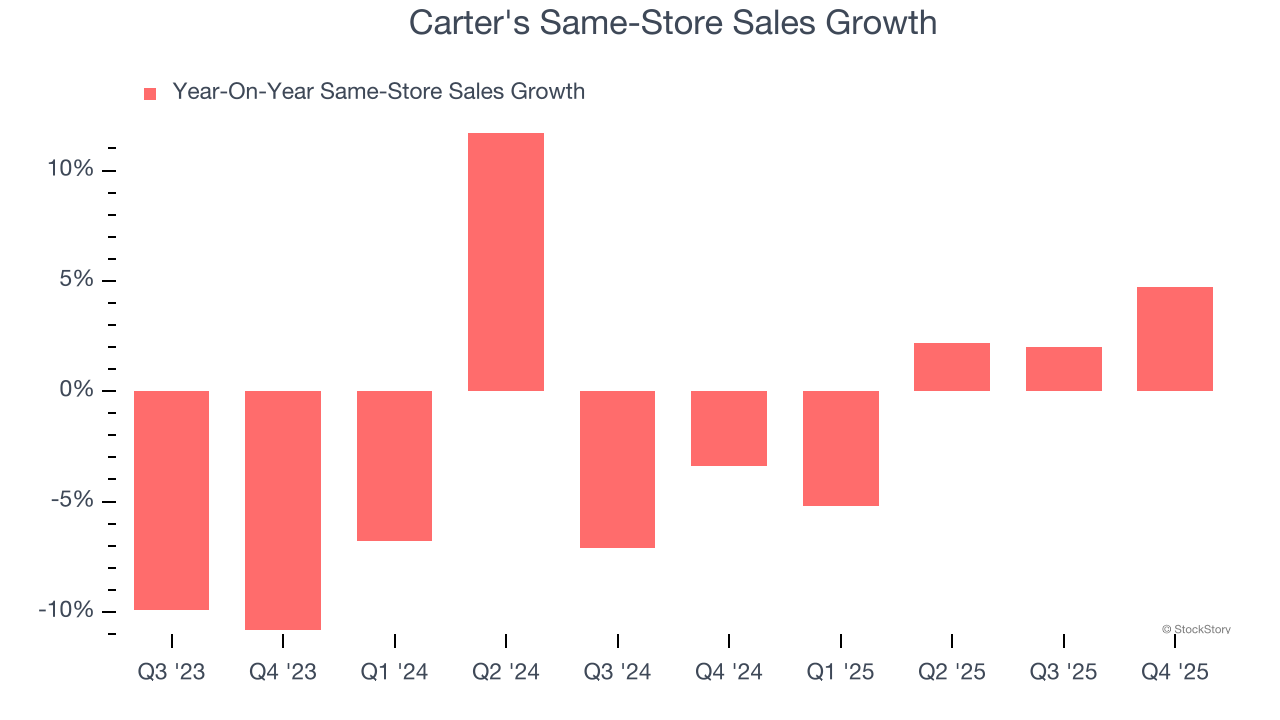
This quarter, Carter's reported year-on-year revenue growth of 7.6%, and its $925.5 million of revenue exceeded Wall Street’s estimates by 0.8%.
Looking ahead, sell-side analysts expect revenue to remain flat over the next 12 months. This projection is underwhelming and indicates its newer products and services will not catalyze better top-line performance yet.
Software is eating the world and there is virtually no industry left that has been untouched by it. That drives increasing demand for tools helping software developers do their jobs, whether it be monitoring critical cloud infrastructure, integrating audio and video functionality, or ensuring smooth content streaming. Click here to access a free report on our 3 favorite stocks to play this generational megatrend.
Operating Margin
Carter’s operating margin has been trending down over the last 12 months and averaged 6.9% over the last two years. The company’s profitability was mediocre for a consumer discretionary business and shows it couldn’t pass its higher operating expenses onto its customers.
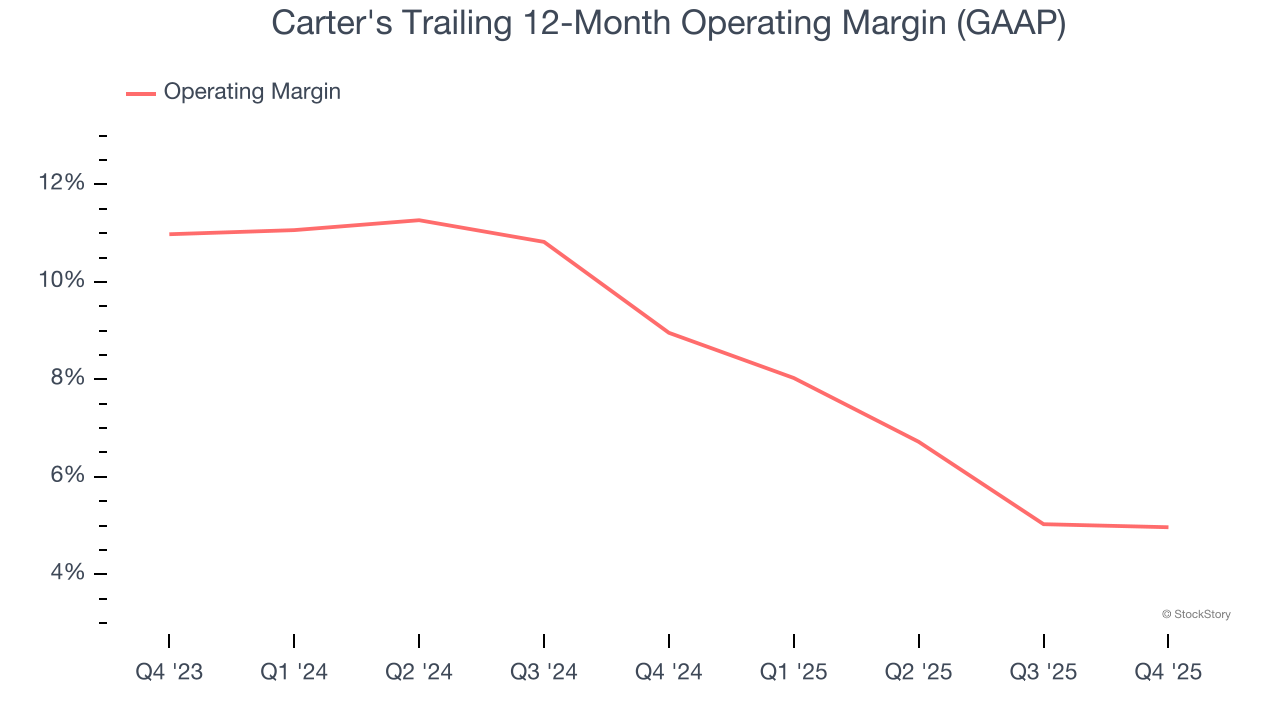
This quarter, Carter's generated an operating margin profit margin of 9.2%, in line with the same quarter last year. This indicates the company’s overall cost structure has been relatively stable.
Earnings Per Share
We track the long-term change in earnings per share (EPS) for the same reason as long-term revenue growth. Compared to revenue, however, EPS highlights whether a company’s growth is profitable.
Sadly for Carter's, its EPS declined by 3.5% annually over the last five years while its revenue was flat. This tells us the company struggled because its fixed cost base made it difficult to adjust to choppy demand.
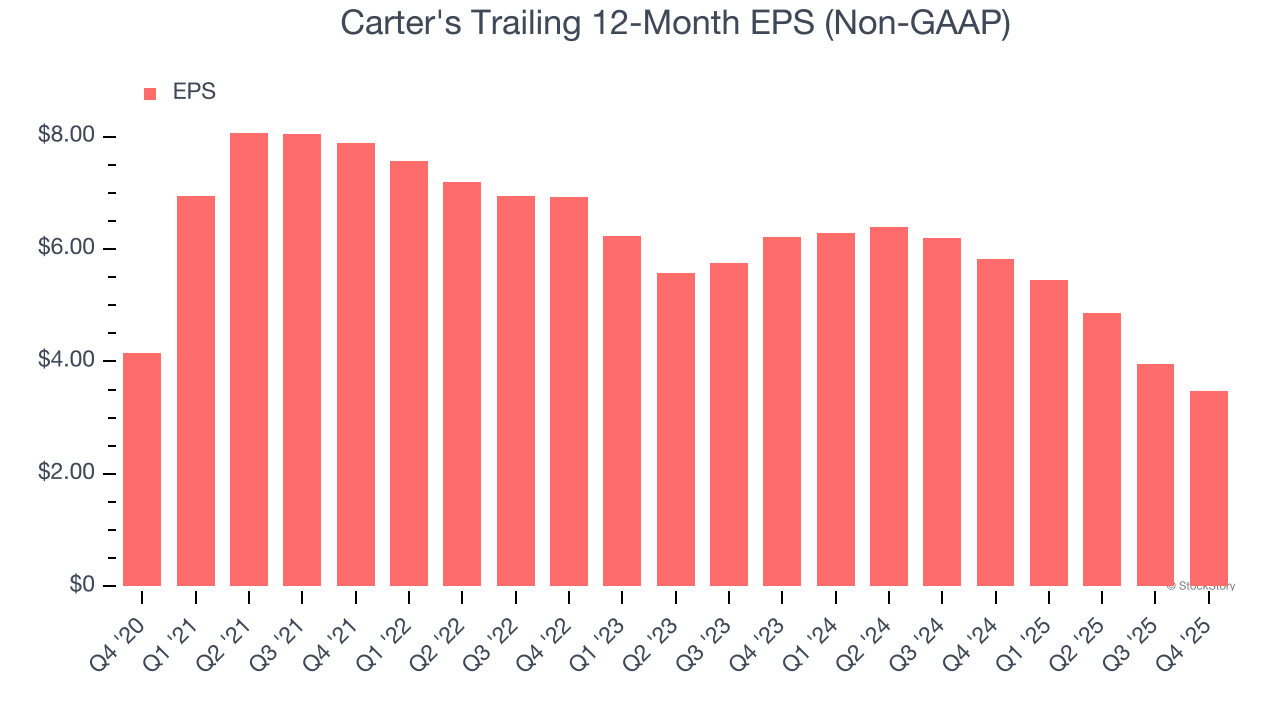
In Q4, Carter's reported adjusted EPS of $1.90, down from $2.39 in the same quarter last year. Despite falling year on year, this print easily cleared analysts’ estimates. Over the next 12 months, Wall Street expects Carter’s full-year EPS of $3.47 to shrink by 18.1%.
Key Takeaways from Carter’s Q4 Results
It was good to see Carter's beat analysts’ EPS expectations this quarter. We were also happy its revenue narrowly outperformed Wall Street’s estimates. On the other hand, its EPS guidance for next quarter missed. Overall, this quarter could have been better. The stock traded down 9.1% to $38.23 immediately following the results.
Carter’s earnings report left more to be desired. Let’s look forward to see if this quarter has created an opportunity to buy the stock. The latest quarter does matter, but not nearly as much as longer-term fundamentals and valuation, when deciding if the stock is a buy. We cover that in our actionable full research report which you can read here (it’s free).