Industrial equipment and engineered products manufacturer Albany (NYSE: AIN) reported Q4 CY2025 results beating Wall Street’s revenue expectations, with sales up 12% year on year to $321.2 million. Its non-GAAP profit of $0.65 per share was 7.4% below analysts’ consensus estimates.
Is now the time to buy Albany? Find out by accessing our full research report, it’s free.
Albany (AIN) Q4 CY2025 Highlights:
- Revenue: $321.2 million vs analyst estimates of $276.8 million (12% year-on-year growth, 16% beat)
- Adjusted EPS: $0.65 vs analyst expectations of $0.70 (7.4% miss)
- Adjusted EBITDA: $57.3 million vs analyst estimates of $60.36 million (17.8% margin, 5.1% miss)
- Operating Margin: 9.3%, in line with the same quarter last year
- Free Cash Flow Margin: 16%, down from 21% in the same quarter last year
- Market Capitalization: $1.66 billion
Gunnar Kleveland, Albany International’s President and Chief Executive Officer said, “We are underway with the previously announced strategic review of our structures assembly business and its associated production site in Salt Lake City, and have engaged an advisor to help guide this transaction. This action will position the remaining Aerospace portfolio to align more closely with our strategic priorities and to pursue growth opportunities where our differentiated technologies provide a clear competitive advantage and stronger returns.”
Company Overview
Founded in 1895, Albany (NYSE: AIN) is a global textiles and materials processing company, specializing in machine clothing for paper mills and engineered composite structures for aerospace and other industries.
Revenue Growth
Reviewing a company’s long-term sales performance reveals insights into its quality. Any business can put up a good quarter or two, but many enduring ones grow for years. Regrettably, Albany’s sales grew at a tepid 5.6% compounded annual growth rate over the last five years. This was below our standard for the industrials sector and is a tough starting point for our analysis.
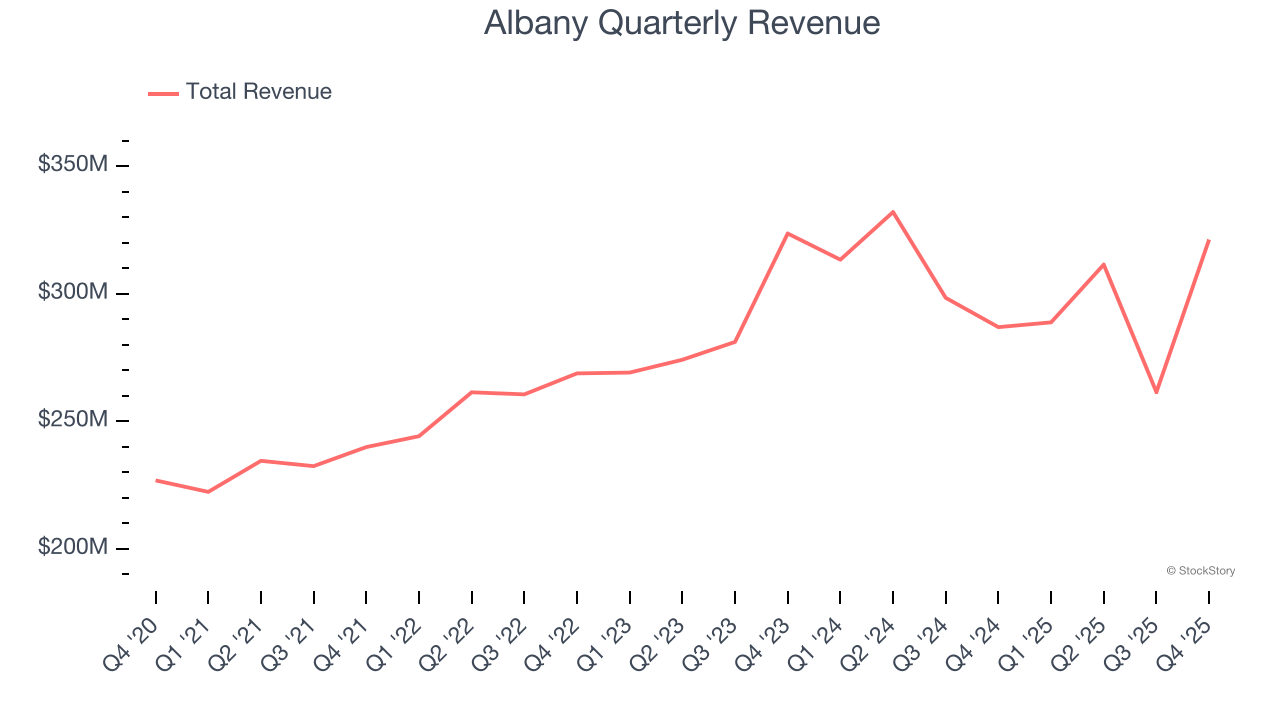
Long-term growth is the most important, but within industrials, a half-decade historical view may miss new industry trends or demand cycles. Albany’s recent performance shows its demand has slowed as its annualized revenue growth of 1.5% over the last two years was below its five-year trend. We’re wary when companies in the sector see decelerations in revenue growth, as it could signal changing consumer tastes aided by low switching costs. 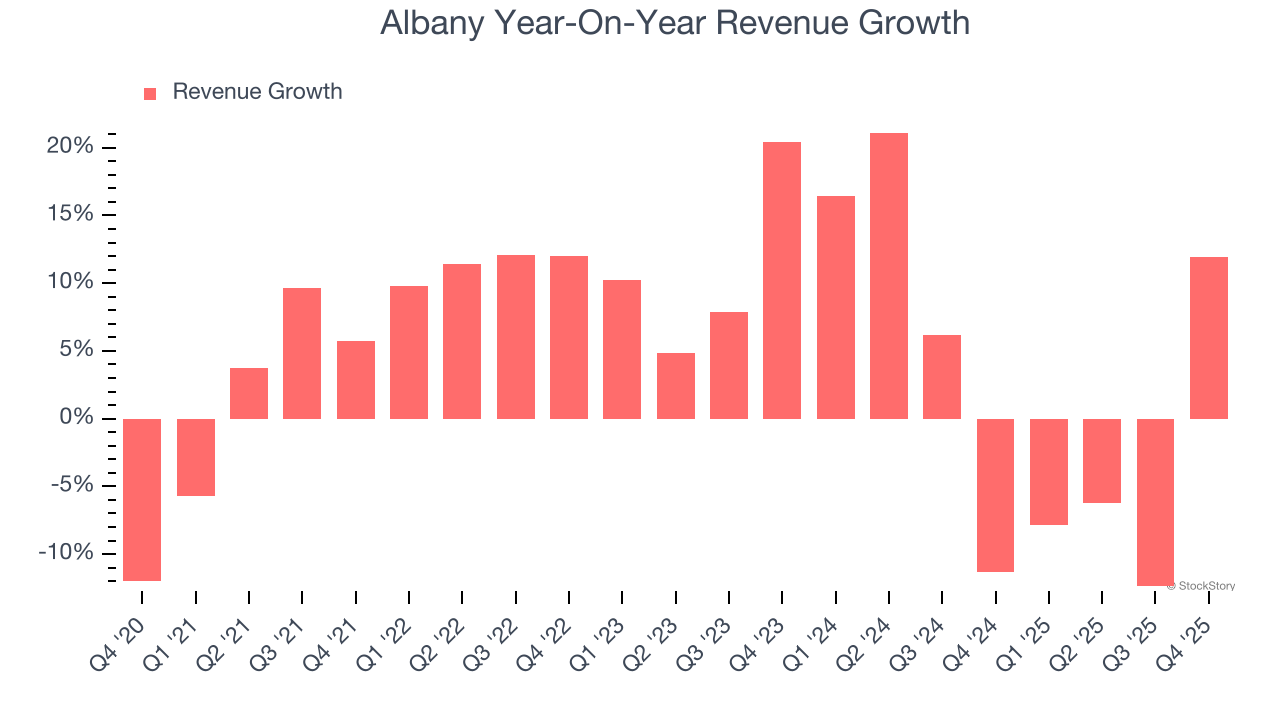
Albany also breaks out the revenue for its most important segments, Machine Clothing and Engineered Composites, which are 55.3% and 44.7% of revenue. Over the last two years, Albany’s Machine Clothing revenue (paper manufacturing belts) averaged 4.8% year-on-year declines while its Engineered Composites revenue (aerospace components) averaged 4.3% declines. 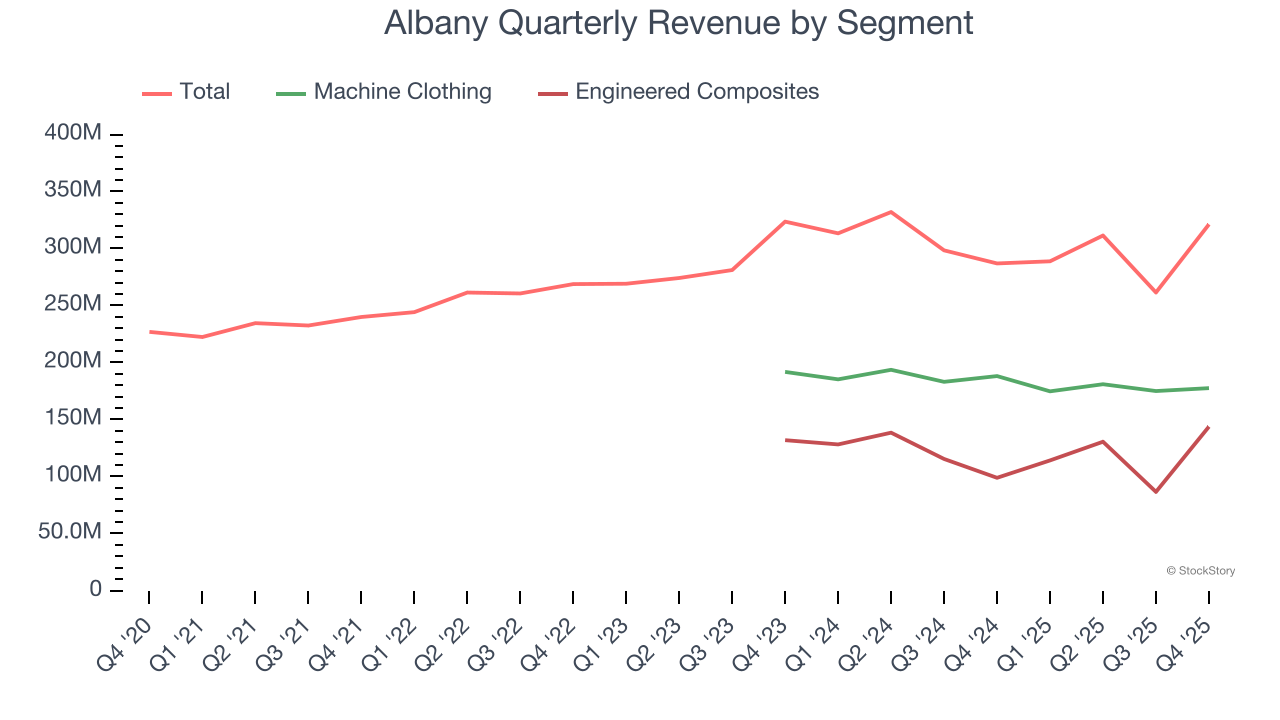
This quarter, Albany reported year-on-year revenue growth of 12%, and its $321.2 million of revenue exceeded Wall Street’s estimates by 16%.
Looking ahead, sell-side analysts expect revenue to decline by 11.1% over the next 12 months, a deceleration versus the last two years. This projection doesn't excite us and implies its products and services will see some demand headwinds.
Software is eating the world and there is virtually no industry left that has been untouched by it. That drives increasing demand for tools helping software developers do their jobs, whether it be monitoring critical cloud infrastructure, integrating audio and video functionality, or ensuring smooth content streaming. Click here to access a free report on our 3 favorite stocks to play this generational megatrend.
Operating Margin
Albany has managed its cost base well over the last five years. It demonstrated solid profitability for an industrials business, producing an average operating margin of 11.3%. This result isn’t too surprising as its gross margin gives it a favorable starting point.
Looking at the trend in its profitability, Albany’s operating margin decreased by 22.2 percentage points over the last five years. This raises questions about the company’s expense base because its revenue growth should have given it leverage on its fixed costs, resulting in better economies of scale and profitability.
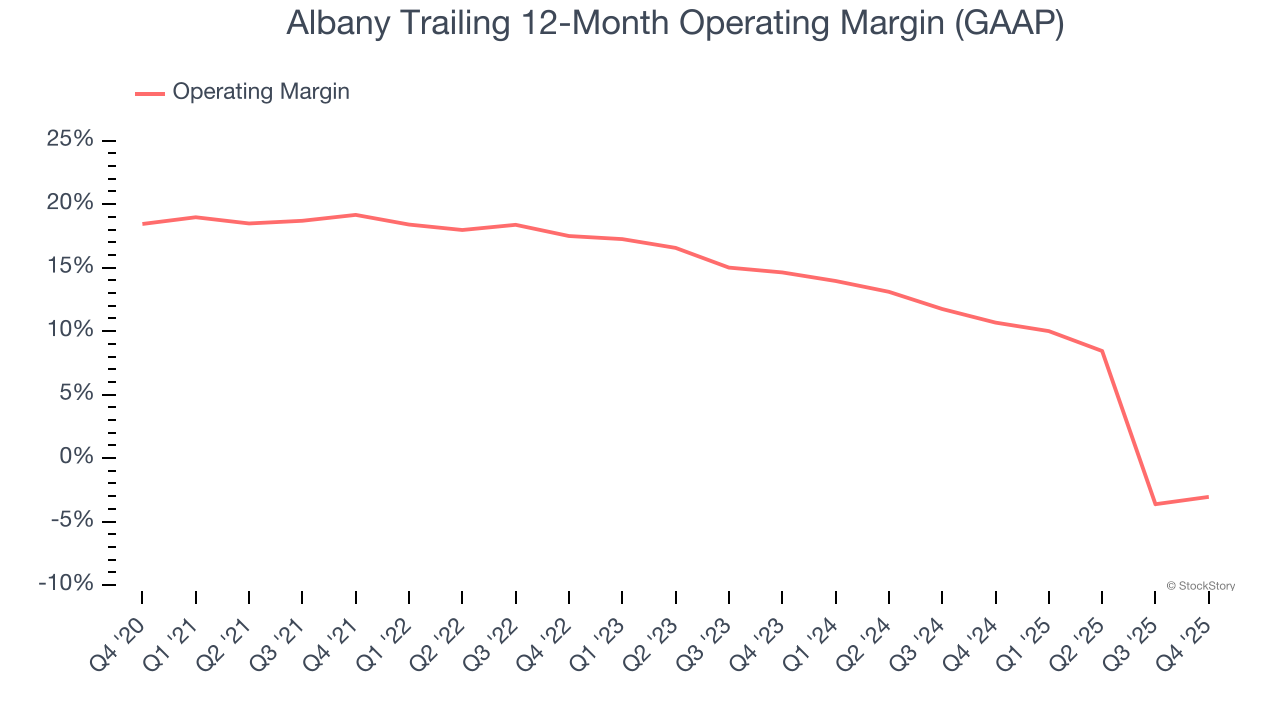
In Q4, Albany generated an operating margin profit margin of 9.3%, in line with the same quarter last year. This indicates the company’s cost structure has recently been stable.
Earnings Per Share
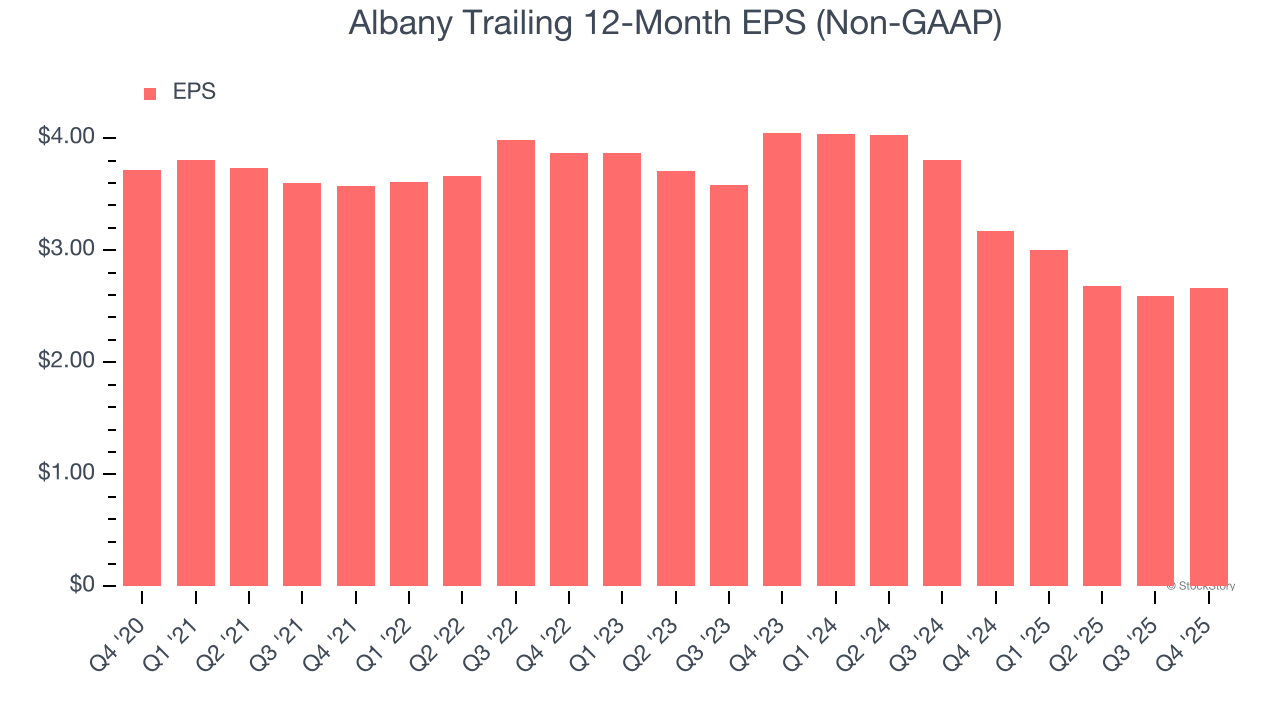
Revenue trends explain a company’s historical growth, but the long-term change in earnings per share (EPS) points to the profitability of that growth – for example, a company could inflate its sales through excessive spending on advertising and promotions.
Sadly for Albany, its EPS declined by 6.5% annually over the last five years while its revenue grew by 5.6%. This tells us the company became less profitable on a per-share basis as it expanded due to non-fundamental factors such as interest expenses and taxes.
We can take a deeper look into Albany’s earnings to better understand the drivers of its performance. As we mentioned earlier, Albany’s operating margin was flat this quarter but declined by 22.2 percentage points over the last five years. This was the most relevant factor (aside from the revenue impact) behind its lower earnings; interest expenses and taxes can also affect EPS but don’t tell us as much about a company’s fundamentals.
Like with revenue, we analyze EPS over a shorter period to see if we are missing a change in the business.
For Albany, its two-year annual EPS declines of 19% show it’s continued to underperform. These results were bad no matter how you slice the data.
In Q4, Albany reported adjusted EPS of $0.65, up from $0.58 in the same quarter last year. Despite growing year on year, this print missed analysts’ estimates. Over the next 12 months, Wall Street expects Albany’s full-year EPS of $2.66 to grow 7.5%.
Key Takeaways from Albany’s Q4 Results
We were impressed by how significantly Albany blew past analysts’ revenue expectations this quarter. On the other hand, its EBITDA missed and its EPS fell short of Wall Street’s estimates. Overall, this was a mixed quarter. The stock traded up 2.1% to $59.23 immediately after reporting.
So do we think Albany is an attractive buy at the current price? If you’re making that decision, you should consider the bigger picture of valuation, business qualities, as well as the latest earnings. We cover that in our actionable full research report which you can read here (it’s free).