Freight transportation company Union Pacific (NYSE: UNP) fell short of the markets revenue expectations in Q4 CY2025, with sales flat year on year at $6.09 billion. Its non-GAAP profit of $2.86 per share was in line with analysts’ consensus estimates.
Is now the time to buy Union Pacific? Find out by accessing our full research report, it’s free.
Union Pacific (UNP) Q4 CY2025 Highlights:
- Revenue: $6.09 billion vs analyst estimates of $6.12 billion (flat year on year, 0.5% miss)
- Adjusted EPS: $2.86 vs analyst estimates of $2.87 (in line)
- Operating Margin: 39.5%, down from 41.3% in the same quarter last year
- Free Cash Flow Margin: 20.1%, up from 15.6% in the same quarter last year
- Market Capitalization: $137 billion
Company Overview
Part of the transcontinental railroad project, Union Pacific (NYSE: UNP) is a freight transportation company that operates a major railroad network.
Revenue Growth
A company’s long-term performance is an indicator of its overall quality. Even a bad business can shine for one or two quarters, but a top-tier one grows for years. Over the last five years, Union Pacific grew its sales at a tepid 4.6% compounded annual growth rate. This was below our standard for the industrials sector and is a poor baseline for our analysis.
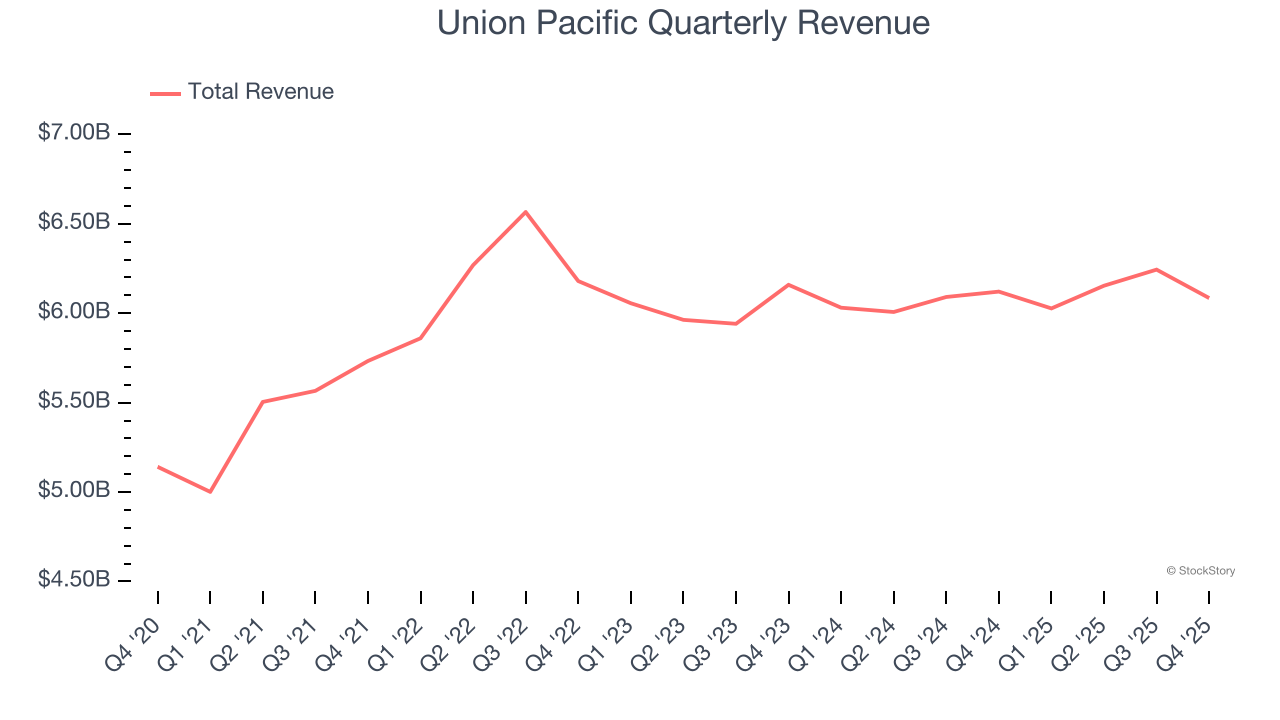
We at StockStory place the most emphasis on long-term growth, but within industrials, a half-decade historical view may miss cycles, industry trends, or a company capitalizing on catalysts such as a new contract win or a successful product line. Union Pacific’s recent performance shows its demand has slowed as its revenue was flat over the last two years. We also note many other Rail Transportation businesses have faced declining sales because of cyclical headwinds. While Union Pacific’s growth wasn’t the best, it did do better than its peers. 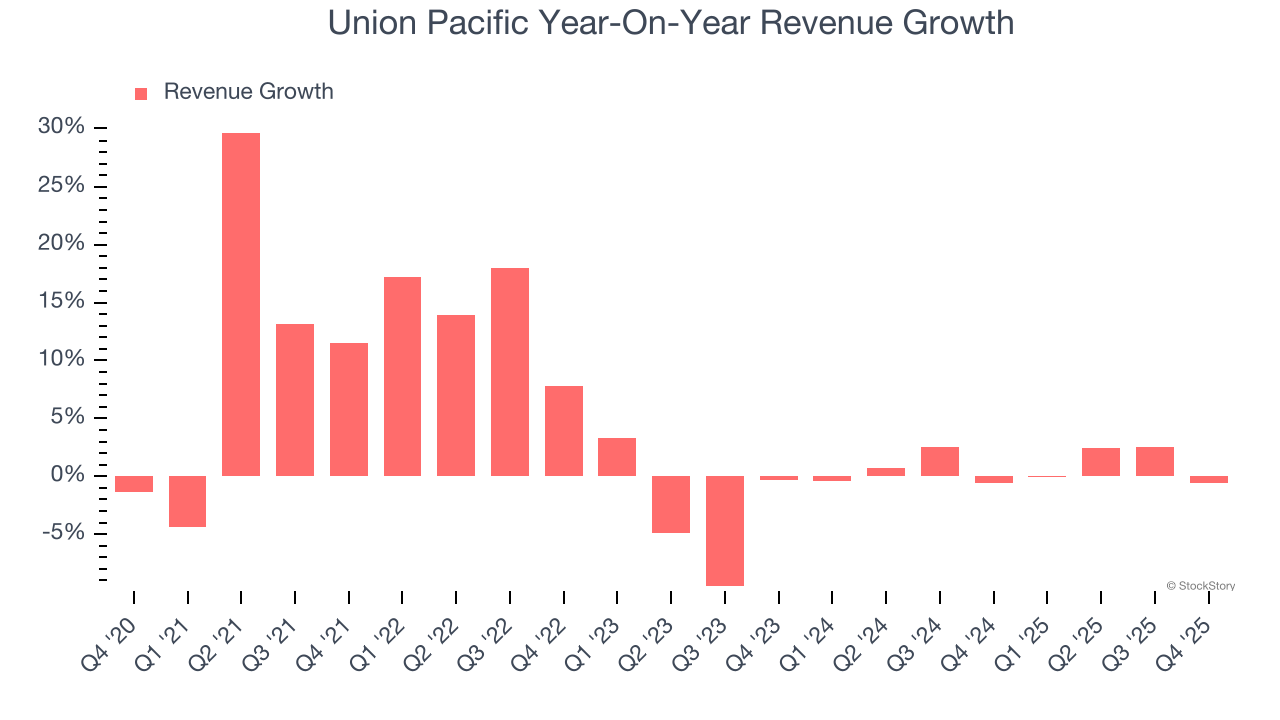
This quarter, Union Pacific missed Wall Street’s estimates and reported a rather uninspiring 0.6% year-on-year revenue decline, generating $6.09 billion of revenue.
Looking ahead, sell-side analysts expect revenue to grow 3.4% over the next 12 months. Although this projection implies its newer products and services will fuel better top-line performance, it is still below average for the sector.
Microsoft, Alphabet, Coca-Cola, Monster Beverage—all began as under-the-radar growth stories riding a massive trend. We’ve identified the next one: a profitable AI semiconductor play Wall Street is still overlooking. Go here for access to our full report.
Operating Margin
Operating margin is a key measure of profitability. Think of it as net income - the bottom line - excluding the impact of taxes and interest on debt, which are less connected to business fundamentals.
Union Pacific has been a well-oiled machine over the last five years. It demonstrated elite profitability for an industrials business, boasting an average operating margin of 40.1%. This result isn’t surprising as its high gross margin gives it a favorable starting point.
Looking at the trend in its profitability, Union Pacific’s operating margin decreased by 2.7 percentage points over the last five years. Many Rail Transportation companies also saw their margins fall (along with revenue, as mentioned above) because the cycle turned in the wrong direction. We hope Union Pacific can emerge from this a stronger company, as the silver lining of a downturn is that market share can be won and efficiencies found.
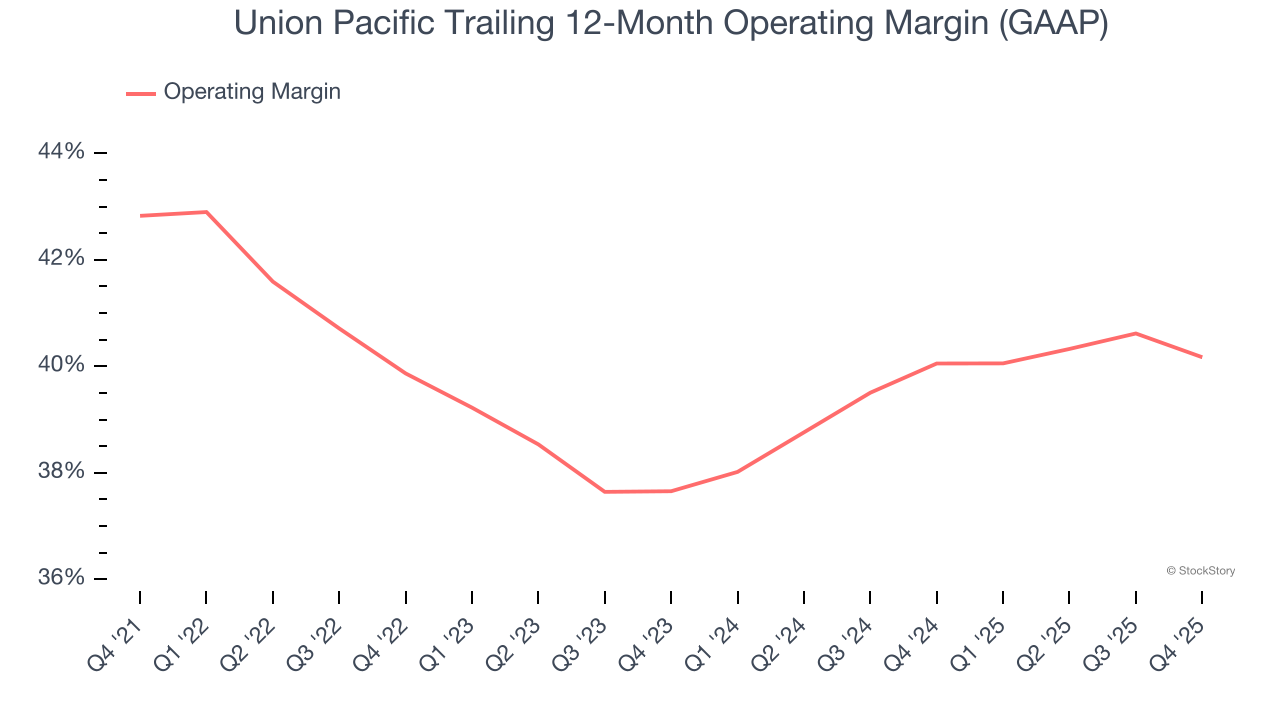
In Q4, Union Pacific generated an operating margin profit margin of 39.5%, down 1.8 percentage points year on year. Since Union Pacific’s gross margin decreased more than its operating margin, we can assume its recent inefficiencies were driven more by weaker leverage on its cost of sales rather than increased marketing, R&D, and administrative overhead expenses.
Earnings Per Share
Revenue trends explain a company’s historical growth, but the long-term change in earnings per share (EPS) points to the profitability of that growth – for example, a company could inflate its sales through excessive spending on advertising and promotions.
Union Pacific’s EPS grew at an unimpressive 7.3% compounded annual growth rate over the last five years. This performance was better than its flat revenue but doesn’t tell us much about its business quality because its operating margin didn’t improve.
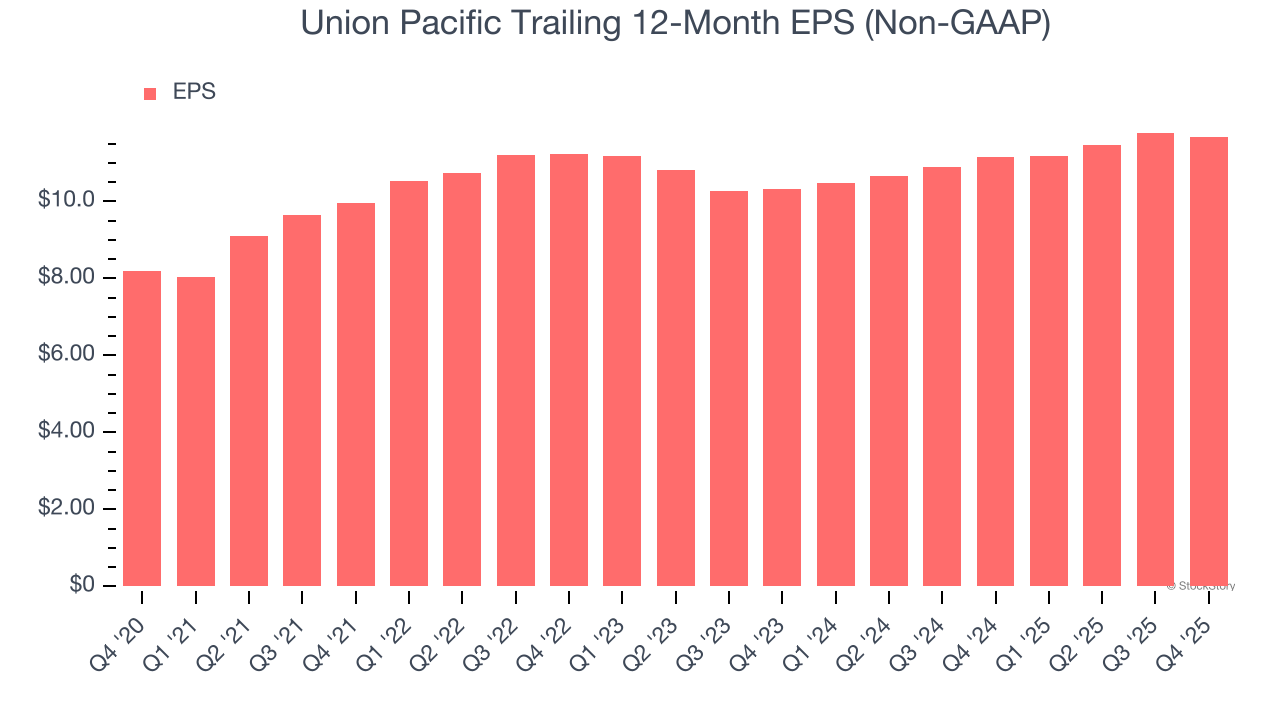
Diving into the nuances of Union Pacific’s earnings can give us a better understanding of its performance. A five-year view shows that Union Pacific has repurchased its stock, shrinking its share count by 12%. This tells us its EPS outperformed its revenue not because of increased operational efficiency but financial engineering, as buybacks boost per share earnings. 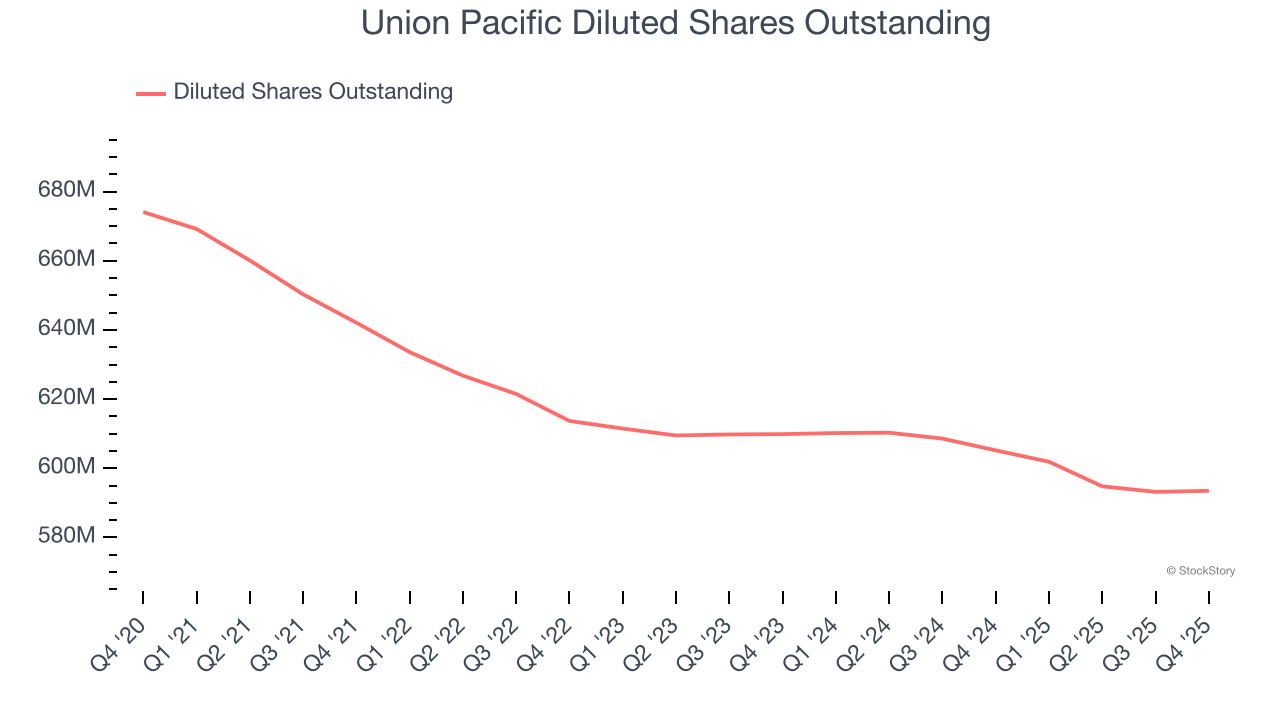
Like with revenue, we analyze EPS over a more recent period because it can provide insight into an emerging theme or development for the business.
For Union Pacific, its two-year annual EPS growth of 6.3% was lower than its five-year trend. We hope its growth can accelerate in the future.
In Q4, Union Pacific reported adjusted EPS of $2.86, down from $2.98 in the same quarter last year. This print was close to analysts’ estimates. Over the next 12 months, Wall Street expects Union Pacific’s full-year EPS of $11.67 to grow 7.4%.
Key Takeaways from Union Pacific’s Q4 Results
Revenue missed, operating margin was down year-on-year, and EPS was only in line. This quarter didn't have many resounding positives. The stock remained flat at $228.98 immediately following the results.
The latest quarter from Union Pacific’s wasn’t that good. One earnings report doesn’t define a company’s quality, though, so let’s explore whether the stock is a buy at the current price. We think that the latest quarter is only one piece of the longer-term business quality puzzle. Quality, when combined with valuation, can help determine if the stock is a buy. We cover that in our actionable full research report which you can read here (it’s free).