Paint and coating manufacturer Sherwin-Williams (NYSE: SHW) met Wall Street’s revenue expectations in Q2 CY2025, but sales were flat year on year at $6.31 billion. On the other hand, next quarter’s revenue guidance of $6.16 billion was less impressive, coming in 2.2% below analysts’ estimates. Its non-GAAP profit of $3.38 per share was 11.2% below analysts’ consensus estimates.
Is now the time to buy Sherwin-Williams? Find out by accessing our full research report, it’s free.
Sherwin-Williams (SHW) Q2 CY2025 Highlights:
- Revenue: $6.31 billion vs analyst estimates of $6.29 billion (flat year on year, in line)
- Adjusted EPS: $3.38 vs analyst expectations of $3.81 (11.2% miss)
- Adjusted EBITDA: $937 million vs analyst estimates of $1.45 billion (14.8% margin, 35.3% miss)
- Revenue Guidance for Q3 CY2025 is $6.16 billion at the midpoint, below analyst estimates of $6.30 billion
- Management lowered its full-year Adjusted EPS guidance to $11.35 at the midpoint, a 4.2% decrease
- Operating Margin: 17.5%, down from 20% in the same quarter last year
- Market Capitalization: $85.35 billion
Company Overview
Widely known for its success in the paint industry, Sherwin-Williams (NYSE: SHW) is a manufacturer of paints, coatings, and related products.
Revenue Growth
A company’s long-term sales performance can indicate its overall quality. Even a bad business can shine for one or two quarters, but a top-tier one grows for years. Regrettably, Sherwin-Williams’s sales grew at a tepid 5.4% compounded annual growth rate over the last five years. This fell short of our benchmark for the industrials sector and is a poor baseline for our analysis.
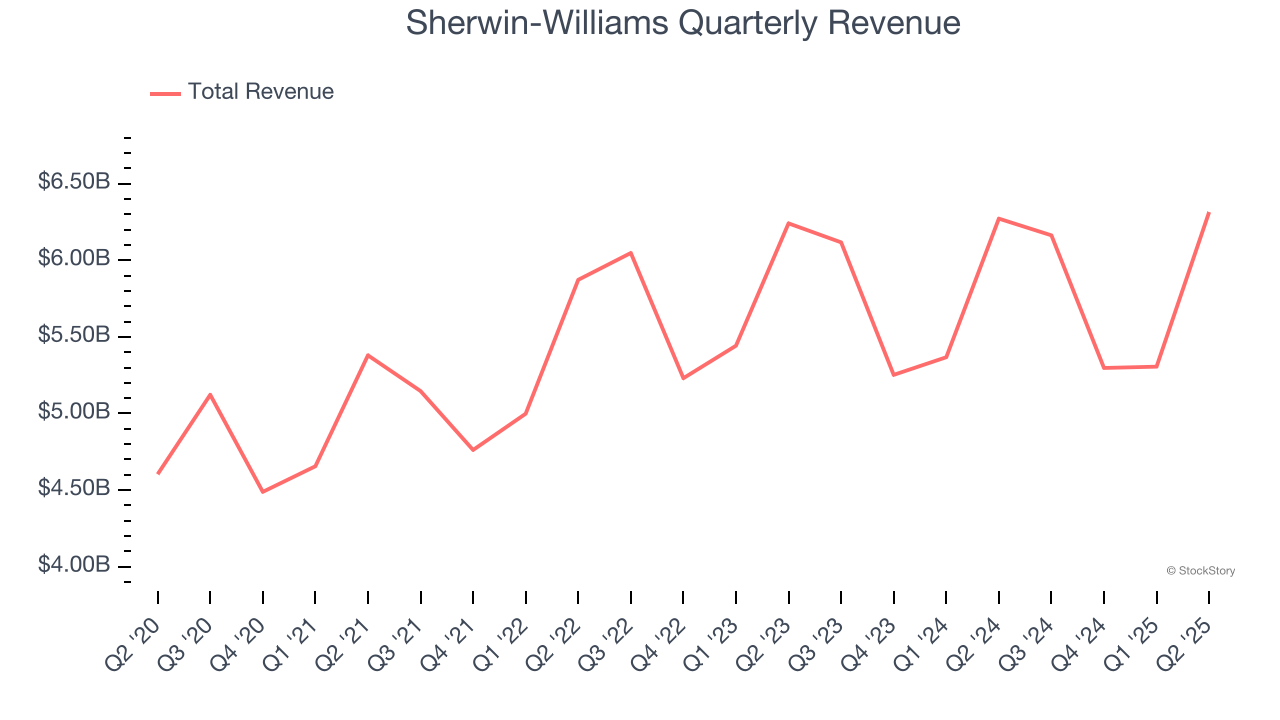
We at StockStory place the most emphasis on long-term growth, but within industrials, a half-decade historical view may miss cycles, industry trends, or a company capitalizing on catalysts such as a new contract win or a successful product line. Sherwin-Williams’s recent performance shows its demand has slowed as its revenue was flat over the last two years. 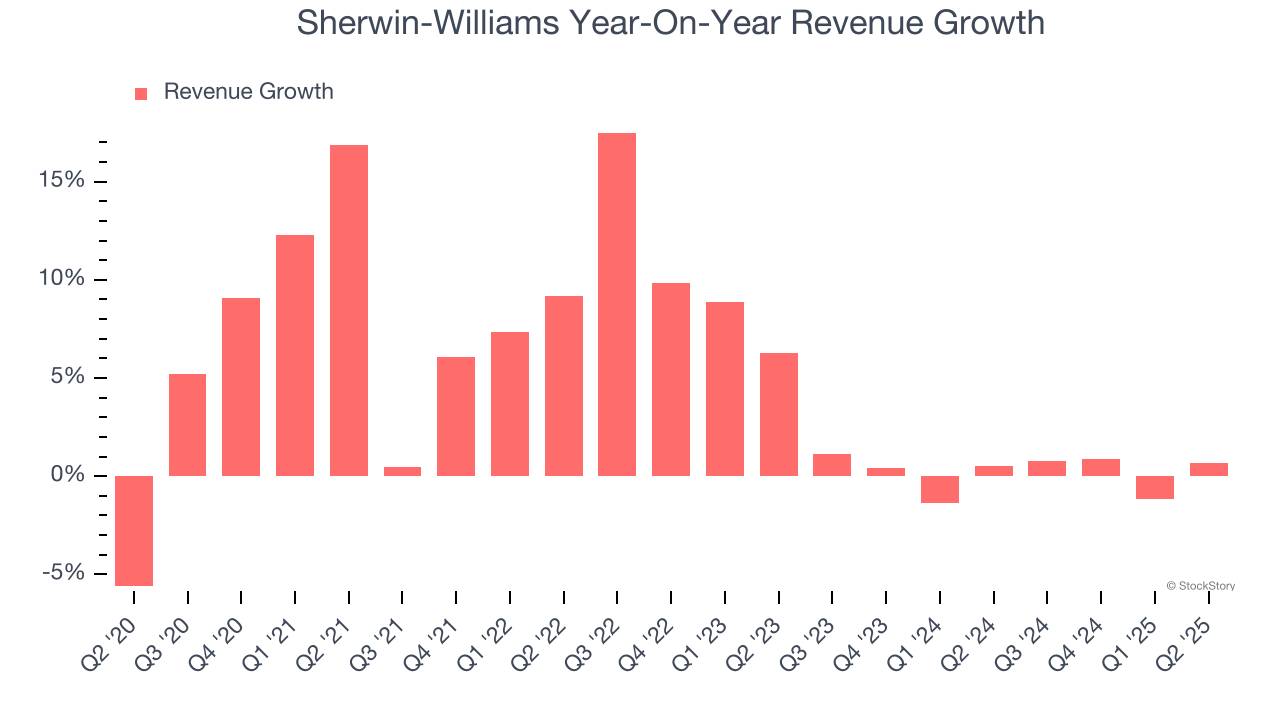
This quarter, Sherwin-Williams’s $6.31 billion of revenue was flat year on year and in line with Wall Street’s estimates. Company management is currently guiding for flat sales next quarter.
Looking further ahead, sell-side analysts expect revenue to grow 3.5% over the next 12 months. Although this projection indicates its newer products and services will spur better top-line performance, it is still below average for the sector.
Software is eating the world and there is virtually no industry left that has been untouched by it. That drives increasing demand for tools helping software developers do their jobs, whether it be monitoring critical cloud infrastructure, integrating audio and video functionality, or ensuring smooth content streaming. Click here to access a free report on our 3 favorite stocks to play this generational megatrend.
Operating Margin
Operating margin is one of the best measures of profitability because it tells us how much money a company takes home after procuring and manufacturing its products, marketing and selling those products, and most importantly, keeping them relevant through research and development.
Sherwin-Williams’s operating margin might fluctuated slightly over the last 12 months but has remained more or less the same, averaging 14.9% over the last five years. This profitability was top-notch for an industrials business, showing it’s an well-run company with an efficient cost structure. This result isn’t surprising as its high gross margin gives it a favorable starting point.
Analyzing the trend in its profitability, Sherwin-Williams’s operating margin might fluctuated slightly but has generally stayed the same over the last five years. This raises questions about the company’s expense base because its revenue growth should have given it leverage on its fixed costs, resulting in better economies of scale and profitability.
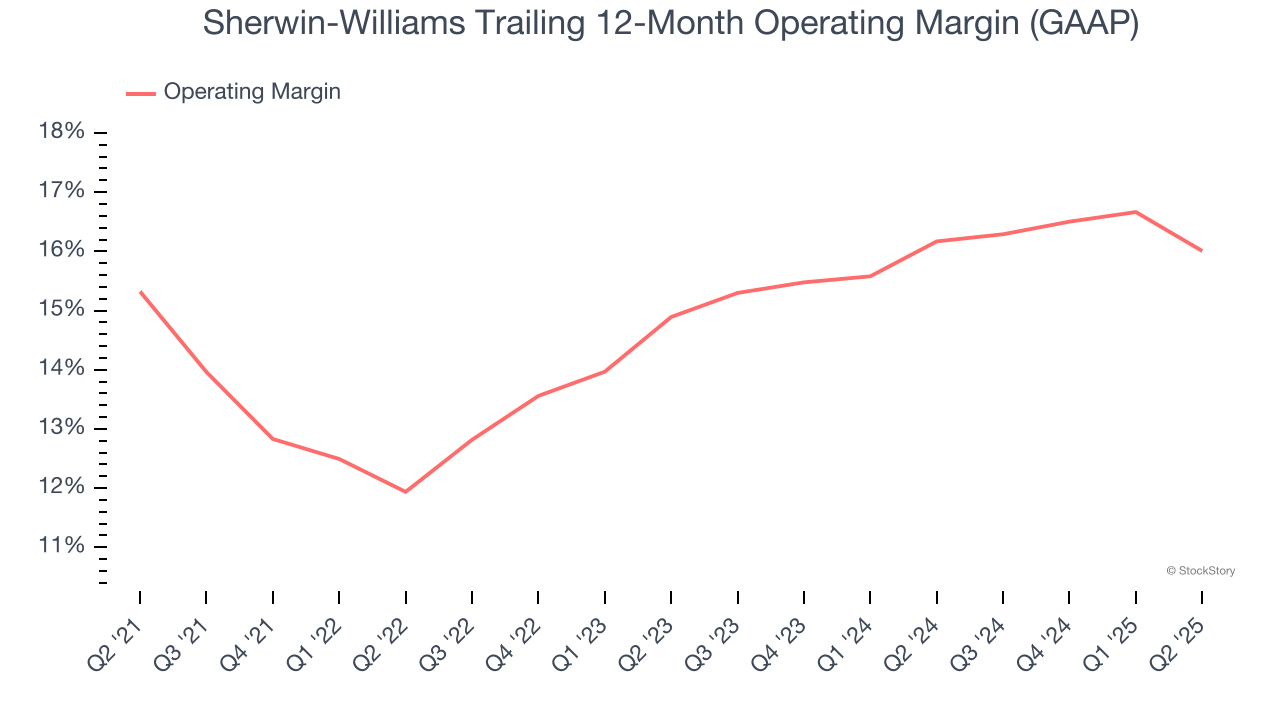
This quarter, Sherwin-Williams generated an operating margin profit margin of 17.5%, down 2.4 percentage points year on year. Since Sherwin-Williams’s operating margin decreased more than its gross margin, we can assume it was less efficient because expenses such as marketing, R&D, and administrative overhead increased.
Earnings Per Share
Revenue trends explain a company’s historical growth, but the long-term change in earnings per share (EPS) points to the profitability of that growth – for example, a company could inflate its sales through excessive spending on advertising and promotions.
Sherwin-Williams’s EPS grew at a decent 8.5% compounded annual growth rate over the last five years, higher than its 5.4% annualized revenue growth. However, this alone doesn’t tell us much about its business quality because its operating margin didn’t improve.
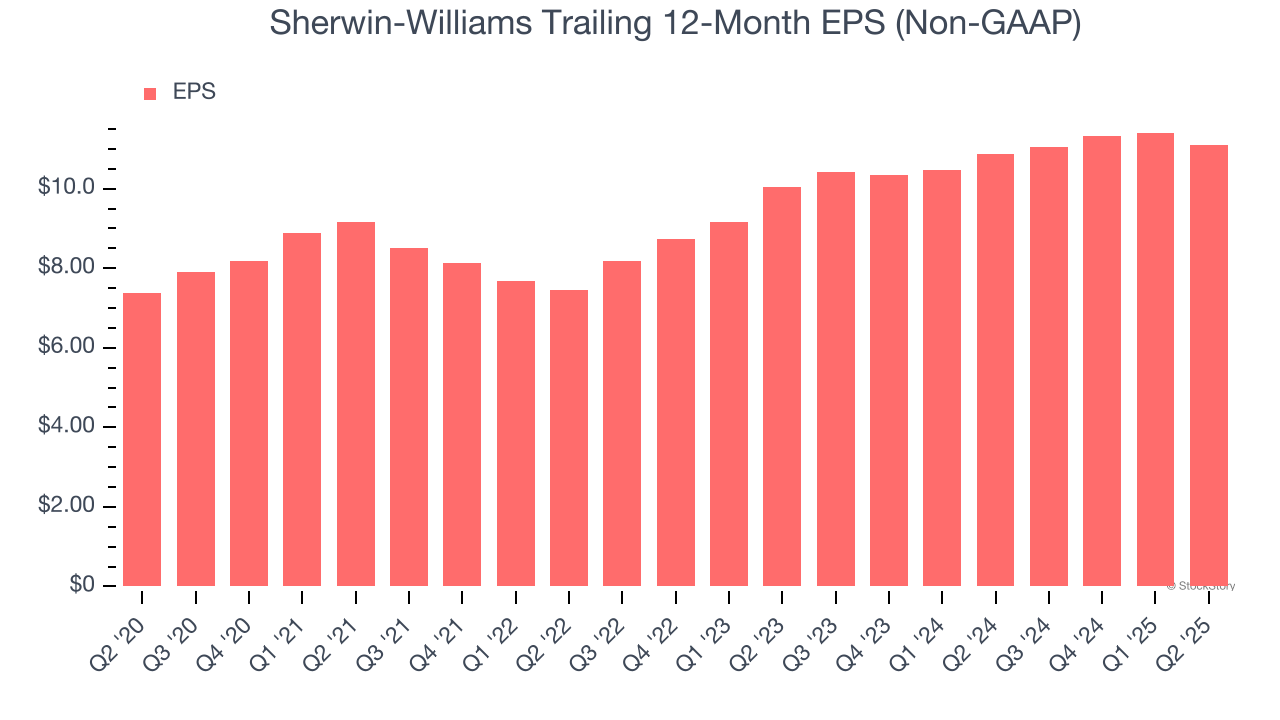
We can take a deeper look into Sherwin-Williams’s earnings quality to better understand the drivers of its performance. A five-year view shows that Sherwin-Williams has repurchased its stock, shrinking its share count by 8.9%. This tells us its EPS outperformed its revenue not because of increased operational efficiency but financial engineering, as buybacks boost per share earnings. 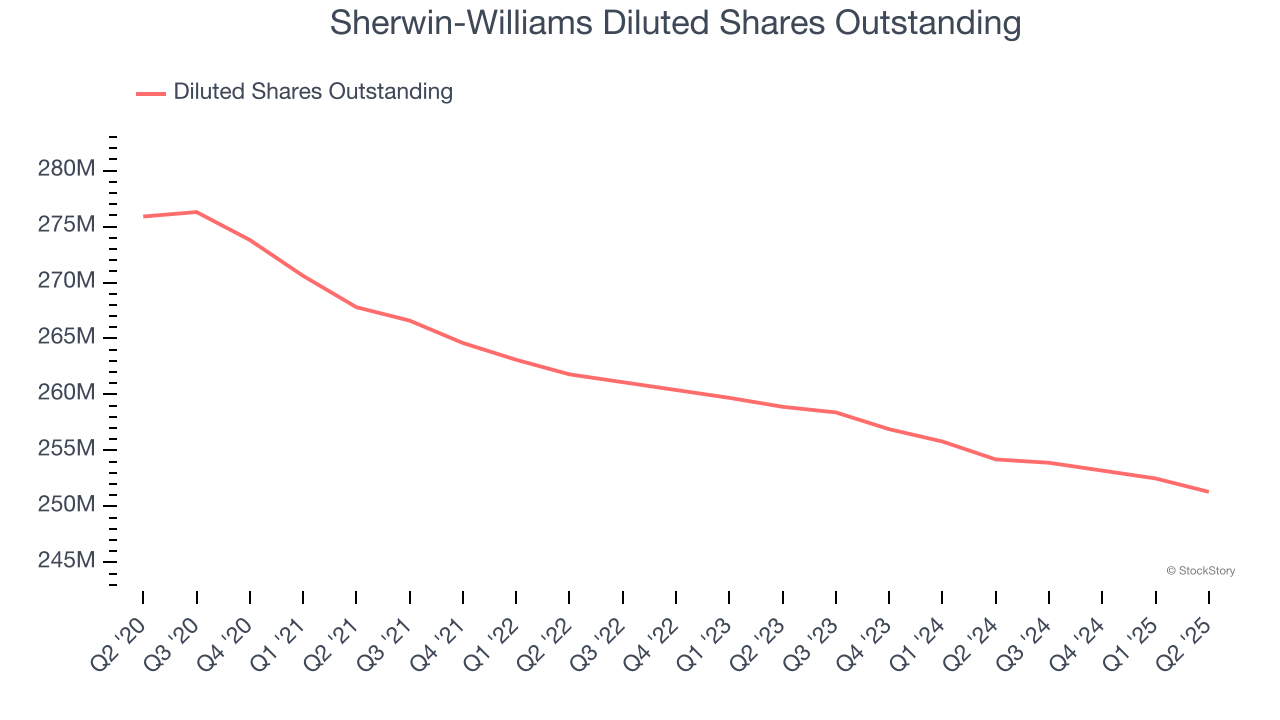
Like with revenue, we analyze EPS over a shorter period to see if we are missing a change in the business.
For Sherwin-Williams, its two-year annual EPS growth of 5% was lower than its five-year trend. We hope its growth can accelerate in the future.
In Q2, Sherwin-Williams reported EPS at $3.38, down from $3.70 in the same quarter last year. This print missed analysts’ estimates, but we care more about long-term EPS growth than short-term movements. Over the next 12 months, Wall Street expects Sherwin-Williams’s full-year EPS of $11.09 to grow 13.3%.
Key Takeaways from Sherwin-Williams’s Q2 Results
We struggled to find many positives in these results. Its full-year EPS guidance missed and its EBITDA fell short of Wall Street’s estimates. Overall, this was a softer quarter. The stock traded down 3.5% to $329.99 immediately following the results.
Sherwin-Williams didn’t show it’s best hand this quarter, but does that create an opportunity to buy the stock right now? The latest quarter does matter, but not nearly as much as longer-term fundamentals and valuation, when deciding if the stock is a buy. We cover that in our actionable full research report which you can read here, it’s free.