


Multi-industry consumer and professional products manufacturer Griffon Corporation (NYSE: GFF) missed Wall Street’s revenue expectations in Q1 CY2025, with sales falling 9.1% year on year to $611.7 million. Its non-GAAP profit of $1.23 per share was 12.5% above analysts’ consensus estimates.
Is now the time to buy Griffon? Find out by accessing our full research report, it’s free.
Griffon (GFF) Q1 CY2025 Highlights:
- Revenue: $611.7 million vs analyst estimates of $618.2 million (9.1% year-on-year decline, 1% miss)
- Adjusted EPS: $1.23 vs analyst estimates of $1.09 (12.5% beat)
- Adjusted EBITDA: $118.5 million vs analyst estimates of $112.7 million (19.4% margin, 5.2% beat)
- Operating Margin: 16.5%, in line with the same quarter last year
- Free Cash Flow was -$14.44 million, down from $20.5 million in the same quarter last year
- Market Capitalization: $3.23 billion
“I am pleased to report that the performance of both of our segments for the first half was in-line with our expectations,” said Ronald J. Kramer, Chairman and CEO of Griffon.
Company Overview
Initially in the defense industry, Griffon (NYSE: GFF) is a now diversified company specializing in home improvement, professional equipment, and building products.
Sales Growth
A company’s long-term sales performance can indicate its overall quality. Any business can put up a good quarter or two, but the best consistently grow over the long haul. Over the last five years, Griffon grew its sales at a sluggish 2.4% compounded annual growth rate. This was below our standards and is a poor baseline for our analysis.
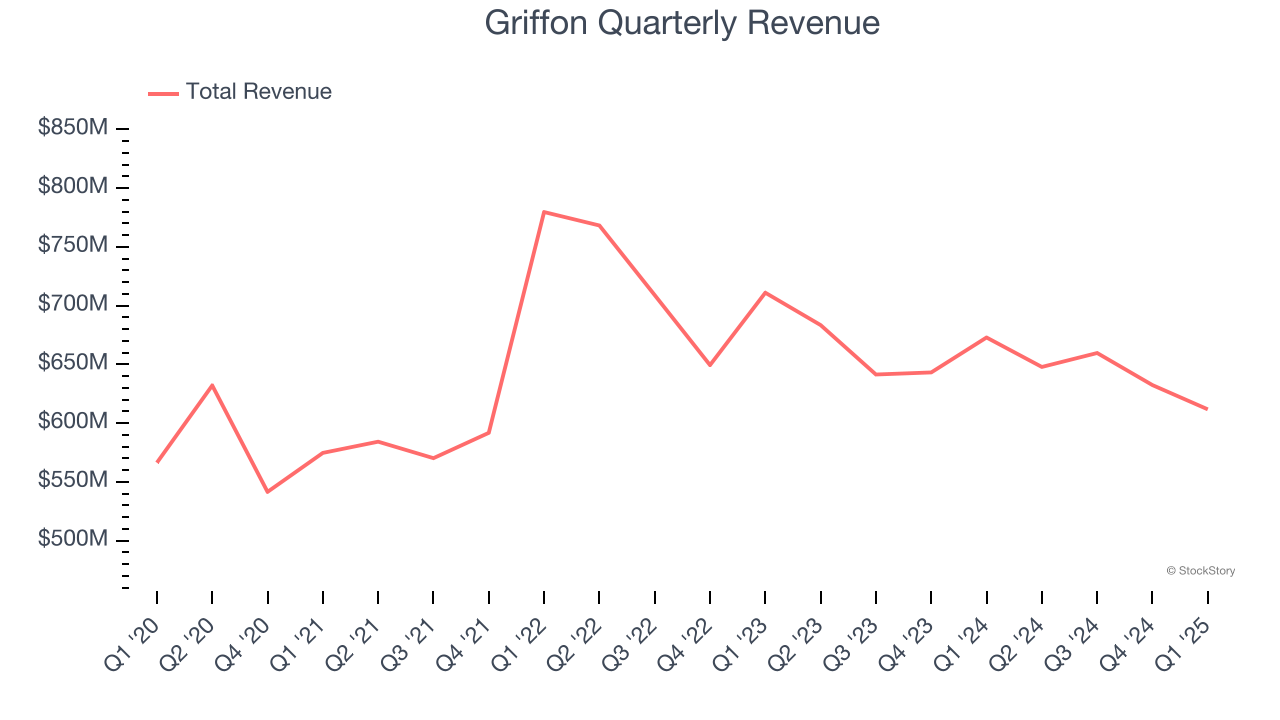
We at StockStory place the most emphasis on long-term growth, but within industrials, a half-decade historical view may miss cycles, industry trends, or a company capitalizing on catalysts such as a new contract win or a successful product line. Griffon’s performance shows it grew in the past but relinquished its gains over the last two years, as its revenue fell by 5.2% annually. 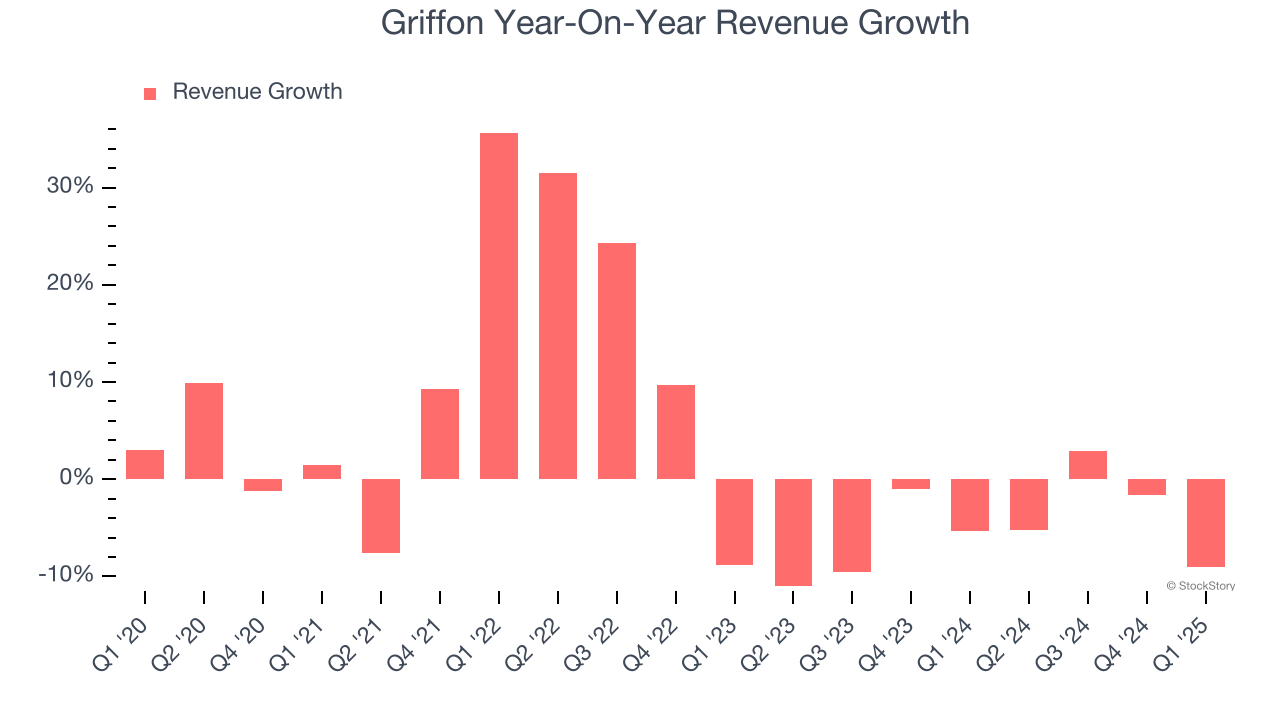
Griffon also breaks out the revenue for its most important segments, and , which are 60.2% and 39.8% of revenue. Over the last two years, Griffon’s revenue averaged 6.1% year-on-year declines while its revenue averaged 13.3% declines.
This quarter, Griffon missed Wall Street’s estimates and reported a rather uninspiring 9.1% year-on-year revenue decline, generating $611.7 million of revenue.
Looking ahead, sell-side analysts expect revenue to grow 4.7% over the next 12 months. Although this projection implies its newer products and services will catalyze better top-line performance, it is still below the sector average.
Software is eating the world and there is virtually no industry left that has been untouched by it. That drives increasing demand for tools helping software developers do their jobs, whether it be monitoring critical cloud infrastructure, integrating audio and video functionality, or ensuring smooth content streaming. Click here to access a free report on our 3 favorite stocks to play this generational megatrend.
Operating Margin
Operating margin is one of the best measures of profitability because it tells us how much money a company takes home after procuring and manufacturing its products, marketing and selling those products, and most importantly, keeping them relevant through research and development.
Griffon has been an efficient company over the last five years. It was one of the more profitable businesses in the industrials sector, boasting an average operating margin of 13.5%. This result isn’t too surprising as its gross margin gives it a favorable starting point.
Looking at the trend in its profitability, Griffon’s operating margin rose by 7.8 percentage points over the last five years, as its sales growth gave it operating leverage.
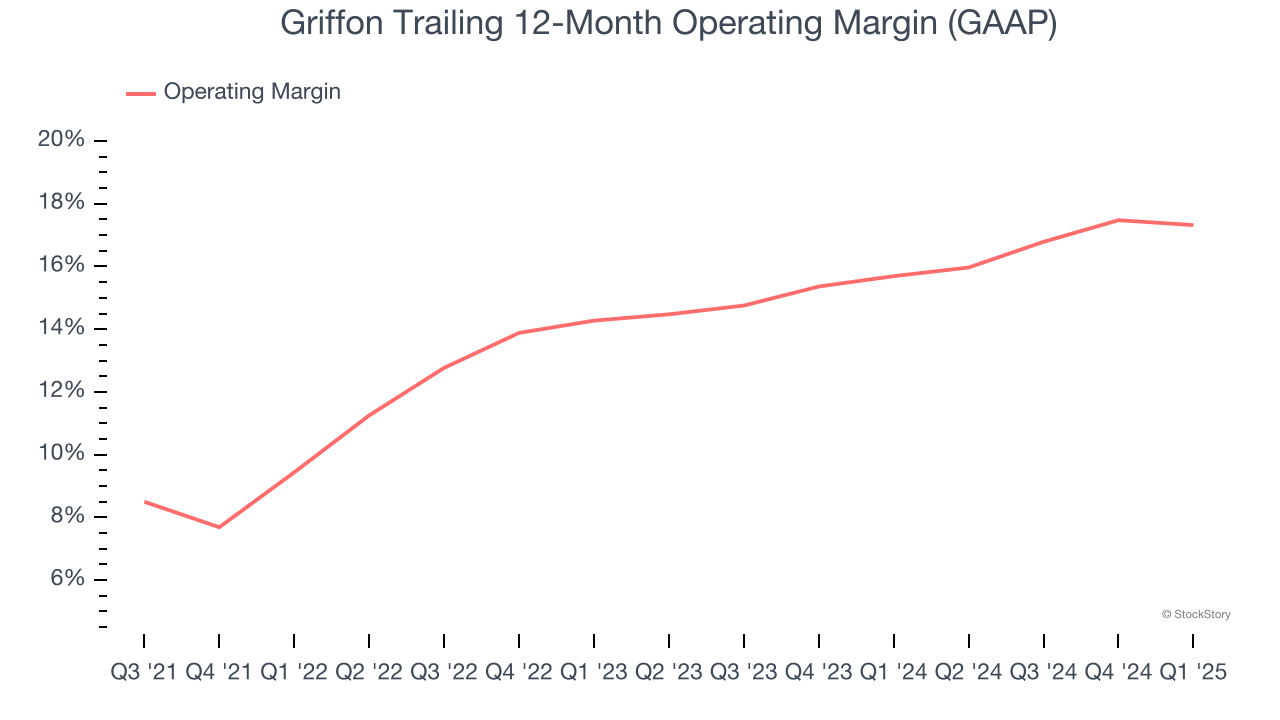
In Q1, Griffon generated an operating profit margin of 16.5%, in line with the same quarter last year. This indicates the company’s cost structure has recently been stable.
Earnings Per Share
We track the long-term change in earnings per share (EPS) for the same reason as long-term revenue growth. Compared to revenue, however, EPS highlights whether a company’s growth is profitable.
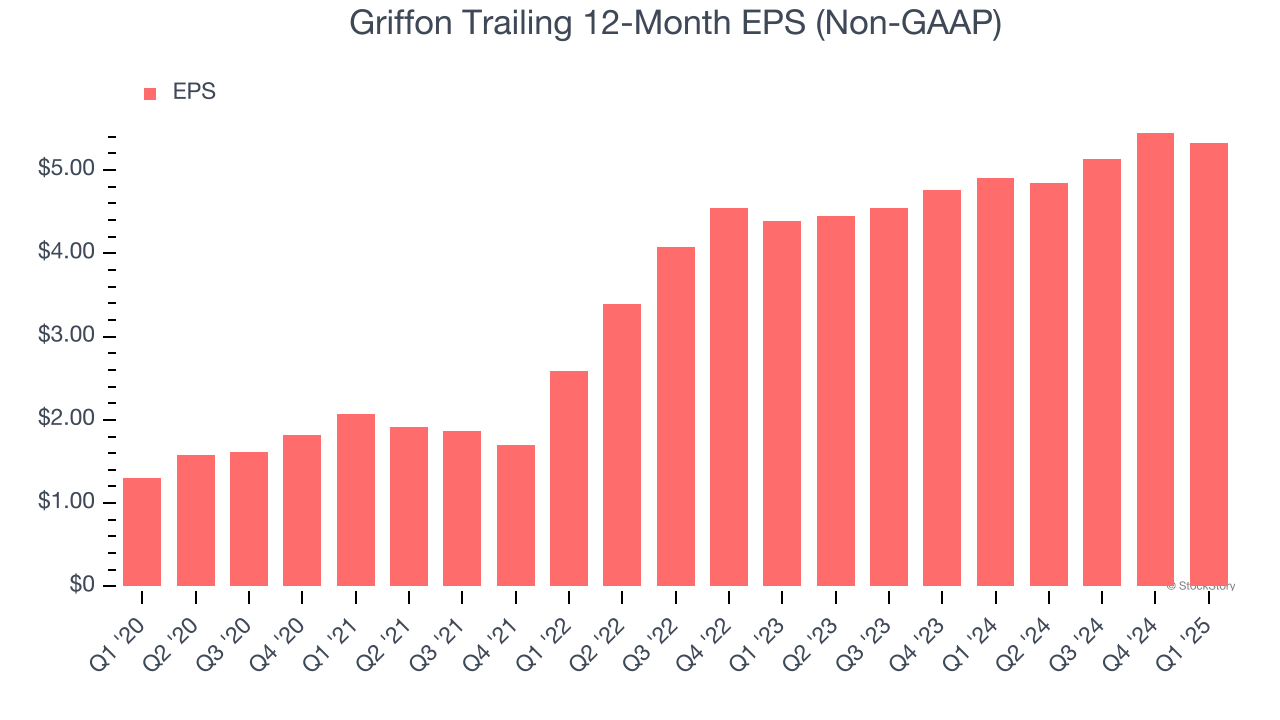
Griffon’s EPS grew at an astounding 32.6% compounded annual growth rate over the last five years, higher than its 2.4% annualized revenue growth. This tells us the company became more profitable on a per-share basis as it expanded.
Diving into Griffon’s quality of earnings can give us a better understanding of its performance. As we mentioned earlier, Griffon’s operating margin was flat this quarter but expanded by 7.8 percentage points over the last five years. This was the most relevant factor (aside from the revenue impact) behind its higher earnings; taxes and interest expenses can also affect EPS but don’t tell us as much about a company’s fundamentals.
Like with revenue, we analyze EPS over a more recent period because it can provide insight into an emerging theme or development for the business.
For Griffon, its two-year annual EPS growth of 10.2% was lower than its five-year trend. We still think its growth was good and hope it can accelerate in the future.
In Q1, Griffon reported EPS at $1.23, down from $1.35 in the same quarter last year. Despite falling year on year, this print easily cleared analysts’ estimates. Over the next 12 months, Wall Street expects Griffon’s full-year EPS of $5.33 to grow 12.4%.
Key Takeaways from Griffon’s Q1 Results
We enjoyed seeing Griffon beat analysts’ EPS and EBITDA expectations this quarter. On the other hand, its revenue slightly missed. Overall, this print had some key positives. The stock traded up 2.1% to $69.20 immediately following the results.
Griffon put up rock-solid earnings, but one quarter doesn’t necessarily make the stock a buy. Let’s see if this is a good investment. What happened in the latest quarter matters, but not as much as longer-term business quality and valuation, when deciding whether to invest in this stock. We cover that in our actionable full research report which you can read here, it’s free.


