Civil infrastructure construction company Sterling Infrastructure (NASDAQ: STRL) beat Wall Street’s revenue expectations in Q1 CY2025, but sales fell by 2.1% year on year to $430.9 million. The company’s full-year revenue guidance of $2.1 billion at the midpoint came in 4.1% above analysts’ estimates. Its non-GAAP profit of $1.63 per share was 12.6% above analysts’ consensus estimates.
Is now the time to buy Sterling? Find out by accessing our full research report, it’s free.
Sterling (STRL) Q1 CY2025 Highlights:
- Revenue: $430.9 million vs analyst estimates of $409.1 million (2.1% year-on-year decline, 5.4% beat)
- Adjusted EPS: $1.63 vs analyst estimates of $1.45 (12.6% beat)
- Adjusted EBITDA: $80.3 million vs analyst estimates of $75.39 million (18.6% margin, 6.5% beat)
- The company lifted its revenue guidance for the full year to $2.1 billion at the midpoint from $2.08 billion, a 1.2% increase
- Management raised its full-year Adjusted EPS guidance to $8.65 at the midpoint, a 6.1% increase
- EBITDA guidance for the full year is $421 million at the midpoint, above analyst estimates of $399.9 million
- Operating Margin: 13%, up from 9.6% in the same quarter last year
- Free Cash Flow Margin: 15.5%, up from 6.2% in the same quarter last year
- Market Capitalization: $5.04 billion
"Sterling is off to a great start in 2025, as we grew our first quarter adjusted net income by 28% to deliver adjusted diluted EPS of $1.63," stated Joe Cutillo, Sterling's Chief Executive Officer.
Company Overview
Involved in the construction of a major highway, the Grand Parkway in Houston, TX, Sterling Infrastructure (NASDAQ: STRL) provides civil infrastructure construction.
Sales Growth
A company’s long-term sales performance is one signal of its overall quality. Any business can experience short-term success, but top-performing ones enjoy sustained growth for years. Luckily, Sterling’s sales grew at an impressive 11.9% compounded annual growth rate over the last five years. Its growth surpassed the average industrials company and shows its offerings resonate with customers, a great starting point for our analysis.
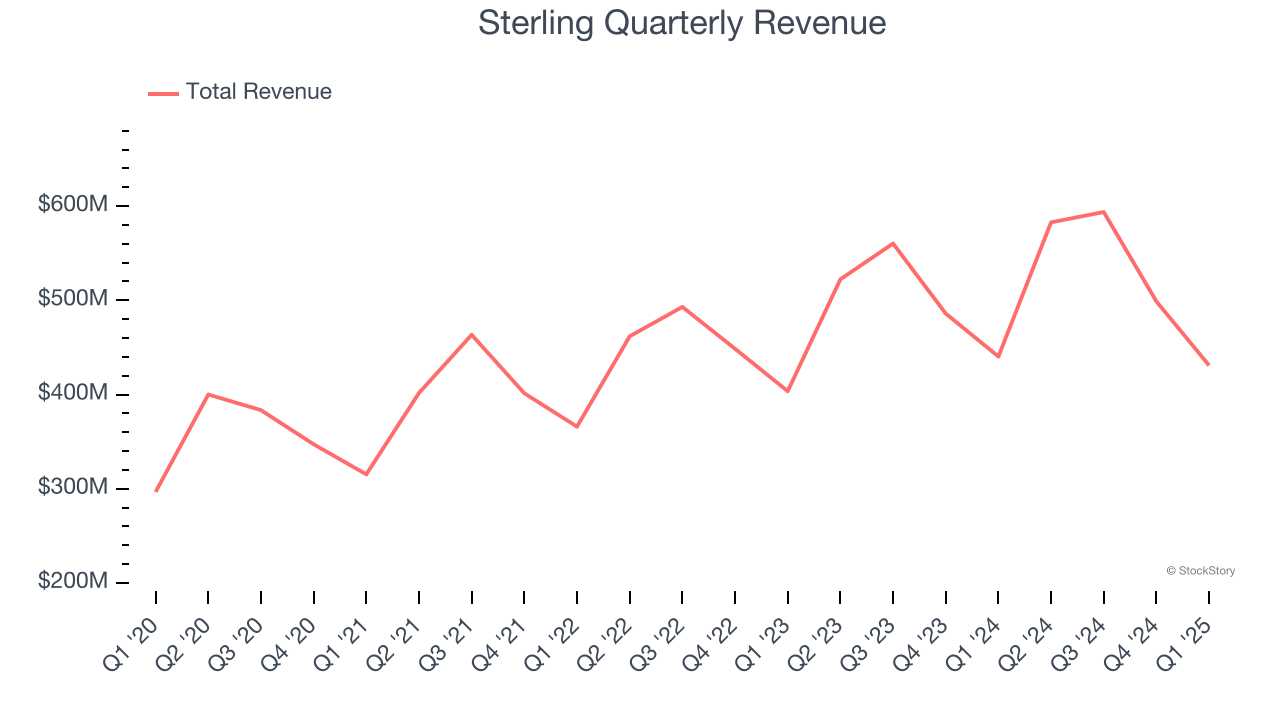
We at StockStory place the most emphasis on long-term growth, but within industrials, a half-decade historical view may miss cycles, industry trends, or a company capitalizing on catalysts such as a new contract win or a successful product line. Sterling’s annualized revenue growth of 8% over the last two years is below its five-year trend, but we still think the results were respectable. 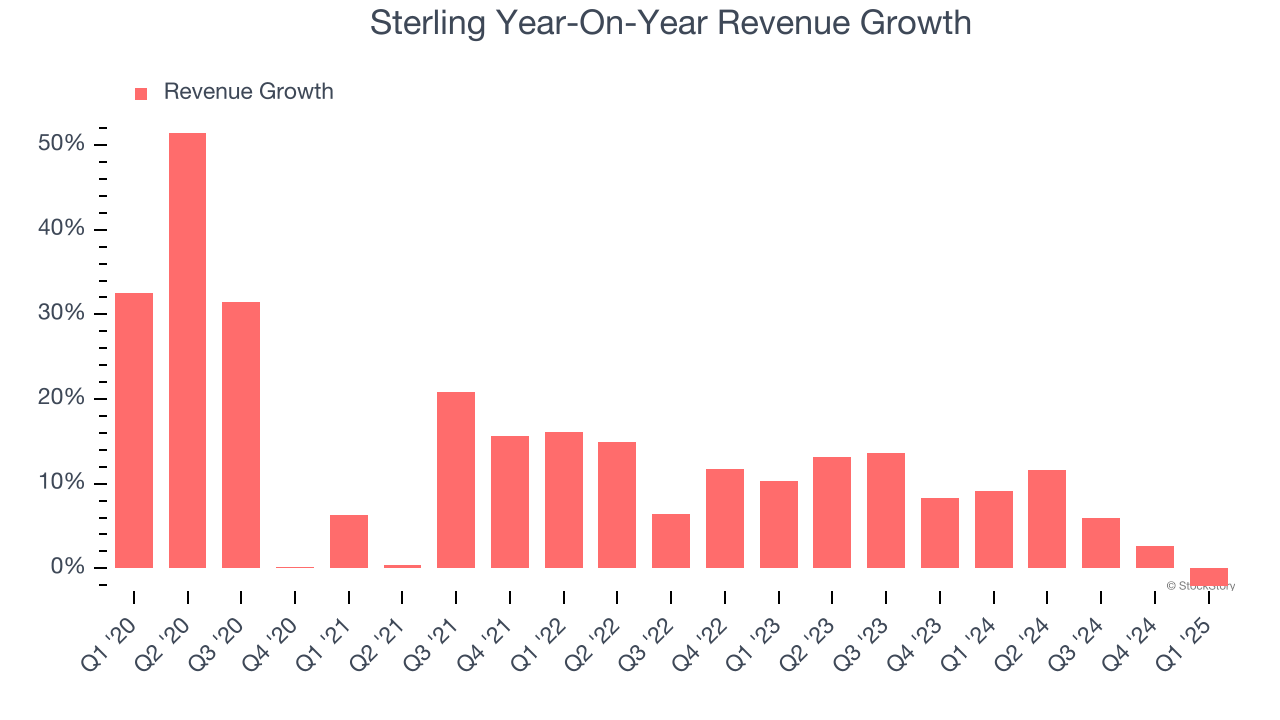
This quarter, Sterling’s revenue fell by 2.1% year on year to $430.9 million but beat Wall Street’s estimates by 5.4%.
Looking ahead, sell-side analysts expect revenue to decline by 3.3% over the next 12 months, a deceleration versus the last two years. This projection is underwhelming and implies its products and services will see some demand headwinds. At least the company is tracking well in other measures of financial health.
Software is eating the world and there is virtually no industry left that has been untouched by it. That drives increasing demand for tools helping software developers do their jobs, whether it be monitoring critical cloud infrastructure, integrating audio and video functionality, or ensuring smooth content streaming. Click here to access a free report on our 3 favorite stocks to play this generational megatrend.
Operating Margin
Operating margin is an important measure of profitability as it shows the portion of revenue left after accounting for all core expenses – everything from the cost of goods sold to advertising and wages. It’s also useful for comparing profitability across companies with different levels of debt and tax rates because it excludes interest and taxes.
Sterling has done a decent job managing its cost base over the last five years. The company has produced an average operating margin of 9.8%, higher than the broader industrials sector.
Looking at the trend in its profitability, Sterling’s operating margin rose by 5.8 percentage points over the last five years, as its sales growth gave it immense operating leverage. Its expansion shows it’s one of the better Engineering and Design Services companies as most peers saw their margins plummet.
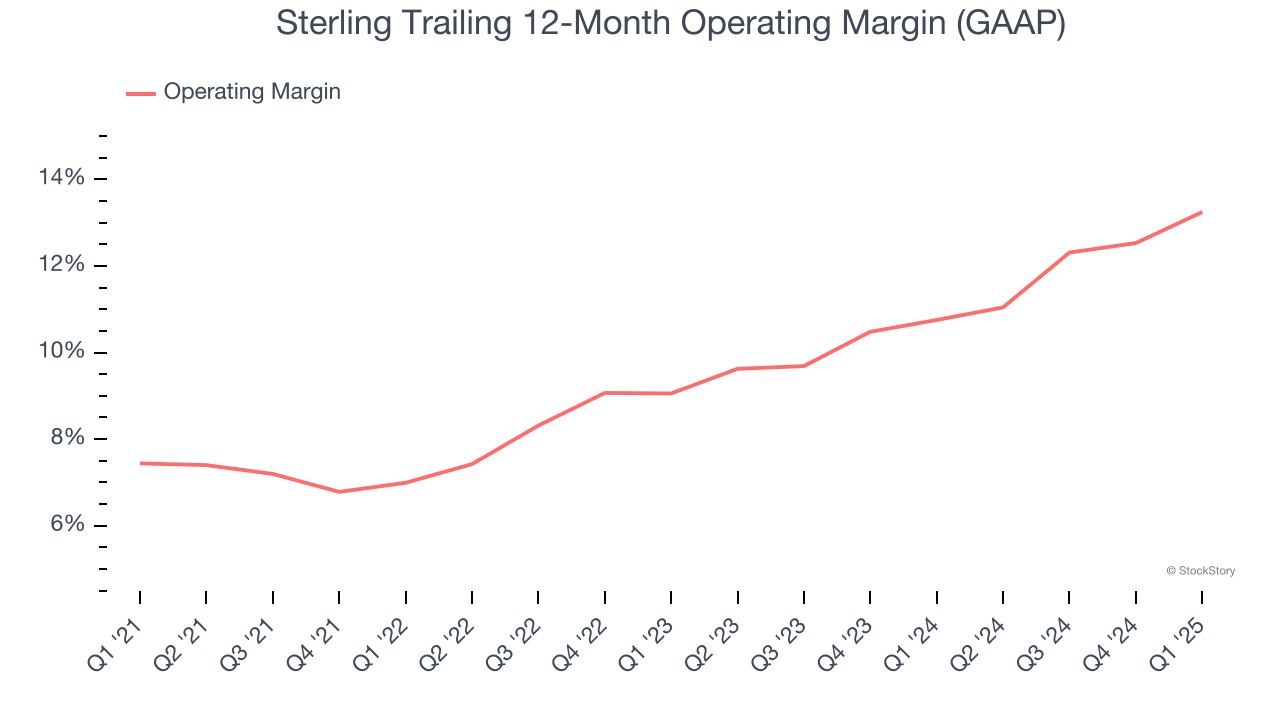
This quarter, Sterling generated an operating profit margin of 13%, up 3.4 percentage points year on year. Since its gross margin expanded more than its operating margin, we can infer that leverage on its cost of sales was the primary driver behind the recently higher efficiency.
Earnings Per Share
Revenue trends explain a company’s historical growth, but the long-term change in earnings per share (EPS) points to the profitability of that growth – for example, a company could inflate its sales through excessive spending on advertising and promotions.
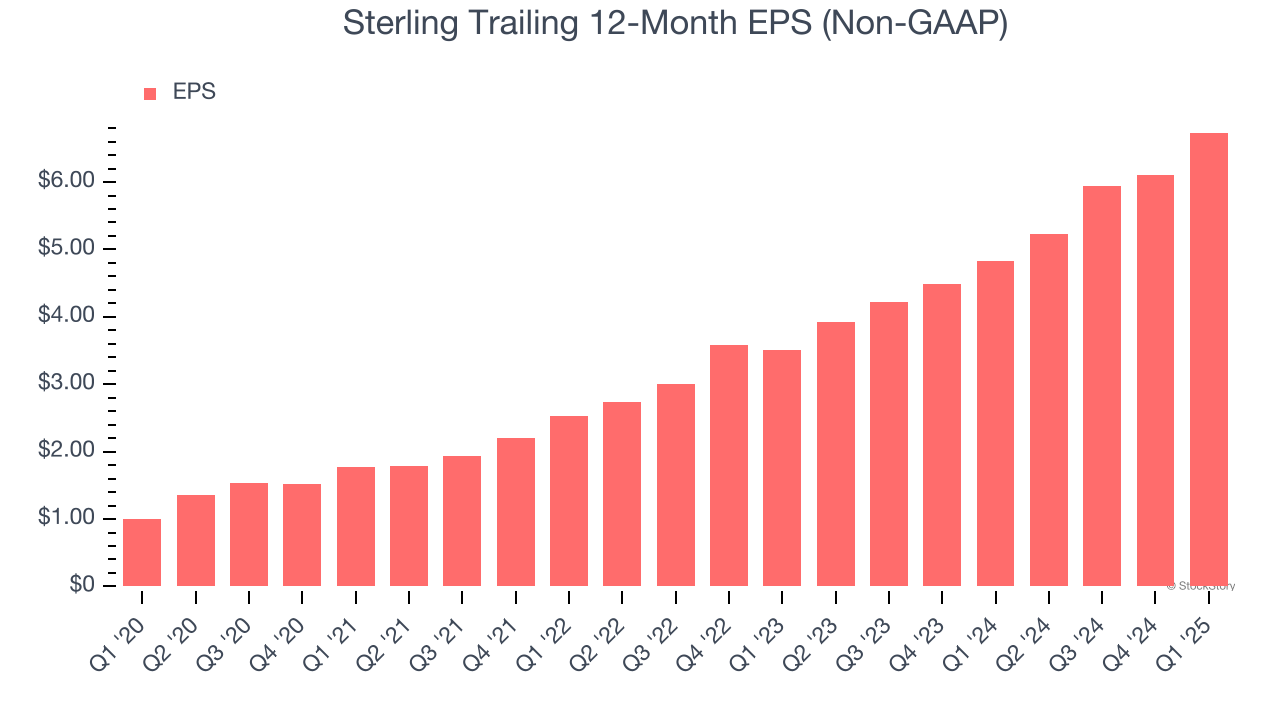
Sterling’s EPS grew at an astounding 46.4% compounded annual growth rate over the last five years, higher than its 11.9% annualized revenue growth. This tells us the company became more profitable on a per-share basis as it expanded.
We can take a deeper look into Sterling’s earnings to better understand the drivers of its performance. As we mentioned earlier, Sterling’s operating margin expanded by 5.8 percentage points over the last five years. This was the most relevant factor (aside from the revenue impact) behind its higher earnings; taxes and interest expenses can also affect EPS but don’t tell us as much about a company’s fundamentals.
Like with revenue, we analyze EPS over a more recent period because it can provide insight into an emerging theme or development for the business.
For Sterling, its two-year annual EPS growth of 38.4% was lower than its five-year trend. We still think its growth was good and hope it can accelerate in the future.
In Q1, Sterling reported EPS at $1.63, up from $1.00 in the same quarter last year. This print easily cleared analysts’ estimates, and shareholders should be content with the results. Over the next 12 months, Wall Street expects Sterling’s full-year EPS of $6.73 to grow 19.1%.
Key Takeaways from Sterling’s Q1 Results
We were impressed by how significantly Sterling blew past analysts’ revenue, EPS, and EBITDA expectations this quarter. We were also glad it lifted its full-year guidance for each metric, trumping Wall Street’s estimates. Zooming out, we think this was a good print with some key areas of upside. The stock traded up 5.3% to $175 immediately after reporting.
Sterling put up rock-solid earnings, but one quarter doesn’t necessarily make the stock a buy. Let’s see if this is a good investment. We think that the latest quarter is only one piece of the longer-term business quality puzzle. Quality, when combined with valuation, can help determine if the stock is a buy. We cover that in our actionable full research report which you can read here, it’s free.