
Modular flooring manufacturer Interface (NASDAQ: TILE) met Wall Street’s revenue expectations in Q1 CY2025, with sales up 2.6% year on year to $297.4 million. The company expects next quarter’s revenue to be around $360 million, coming in 1.9% above analysts’ estimates. Its non-GAAP profit of $0.25 per share was 19% above analysts’ consensus estimates.
Is now the time to buy Interface? Find out by accessing our full research report, it’s free.
Interface (TILE) Q1 CY2025 Highlights:
- Revenue: $297.4 million vs analyst estimates of $296.5 million (2.6% year-on-year growth, in line)
- Adjusted EPS: $0.25 vs analyst estimates of $0.21 (19% beat)
- Adjusted EBITDA: $37 million vs analyst estimates of $34.95 million (12.4% margin, 5.9% beat)
- The company slightly lifted its revenue guidance for the full year to $1.35 billion at the midpoint from $1.34 billion
- Operating Margin: 7.8%, in line with the same quarter last year
- Free Cash Flow Margin: 1.4%, down from 3% in the same quarter last year
- Market Capitalization: $1.10 billion
“We delivered a solid start to the year, with currency-neutral net sales growth of 4% year-over-year. Strong momentum continued in the Americas, where net sales grew 6% and currency-neutral orders were up 10%, partially offset by a softer macro environment in EAAA. Global billings in both Healthcare and Education grew double digits demonstrating the power of our strategy that continues to diversify and strengthen our business,” commented Laurel Hurd, CEO of Interface.
Company Overview
Pioneering carbon-neutral flooring since its founding in 1973, Interface (NASDAQ: TILE) is a global manufacturer of modular carpet tiles, luxury vinyl tile (LVT), and rubber flooring that specializes in carbon-neutral and sustainable flooring solutions.
Sales Growth
Examining a company’s long-term performance can provide clues about its quality. Even a bad business can shine for one or two quarters, but a top-tier one grows for years.
With $1.32 billion in revenue over the past 12 months, Interface is a small player in the business services space, which sometimes brings disadvantages compared to larger competitors benefiting from economies of scale and numerous distribution channels.
As you can see below, Interface struggled to increase demand as its $1.32 billion of sales for the trailing 12 months was close to its revenue five years ago. This shows demand was soft, a poor baseline for our analysis.
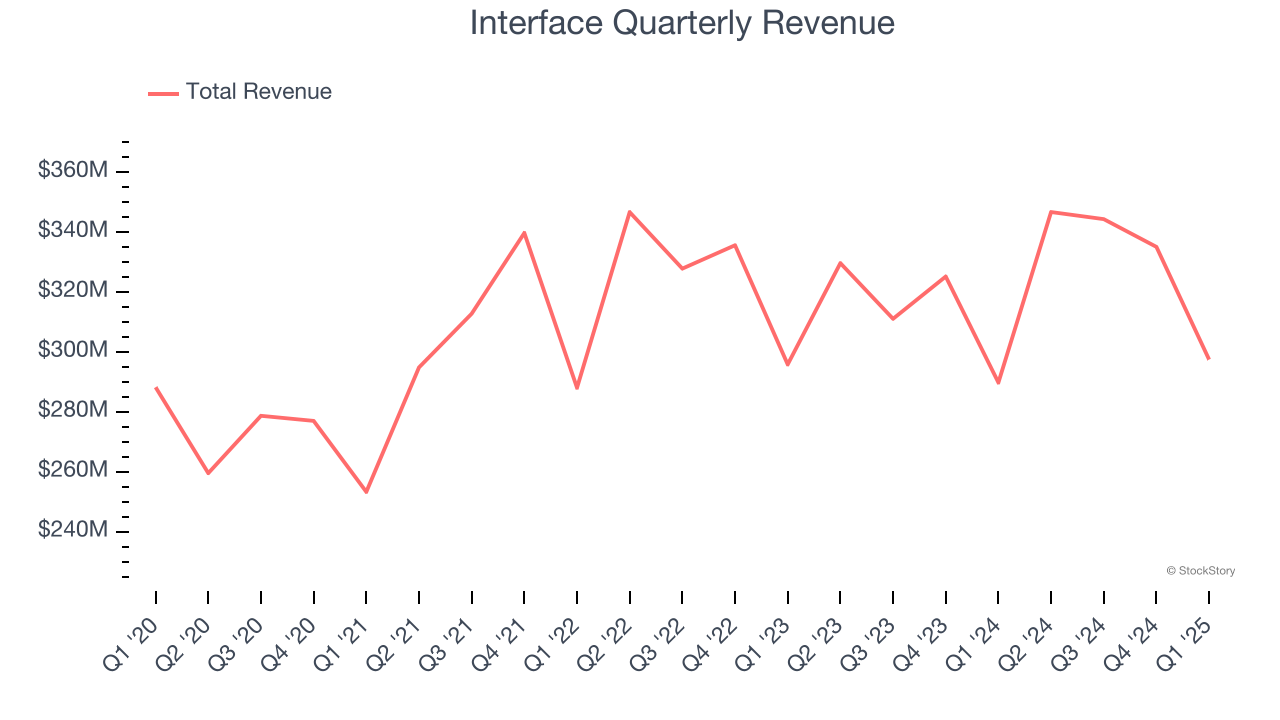
Long-term growth is the most important, but within business services, a half-decade historical view may miss new innovations or demand cycles. Just like its five-year trend, Interface’s revenue over the last two years was flat, suggesting it is in a slump. 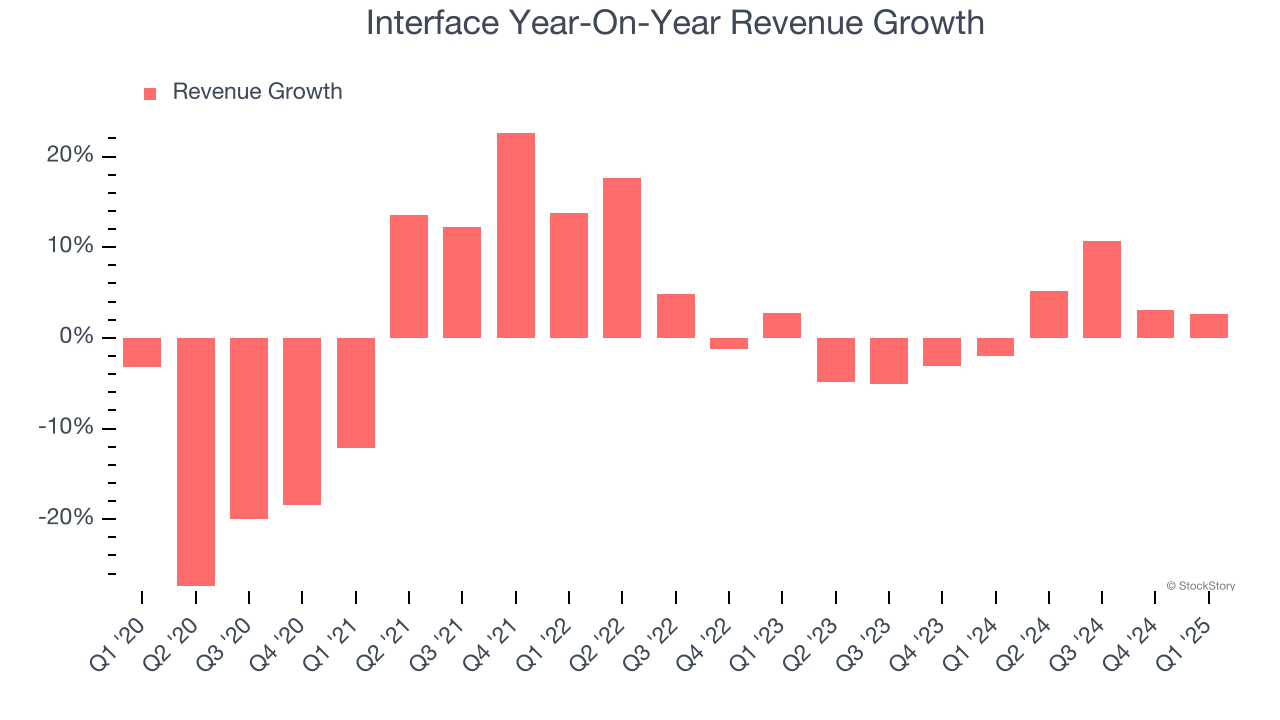
This quarter, Interface grew its revenue by 2.6% year on year, and its $297.4 million of revenue was in line with Wall Street’s estimates. Company management is currently guiding for a 3.9% year-on-year increase in sales next quarter.
We also like to judge companies based on their projected revenue growth, but not enough Wall Street analysts cover the company for it to have reliable consensus estimates.
Unless you’ve been living under a rock, it should be obvious by now that generative AI is going to have a huge impact on how large corporations do business. While Nvidia and AMD are trading close to all-time highs, we prefer a lesser-known (but still profitable) stock benefiting from the rise of AI. Click here to access our free report one of our favorites growth stories.
Operating Margin
Operating margin is one of the best measures of profitability because it tells us how much money a company takes home after subtracting all core expenses, like marketing and R&D.
Interface was profitable over the last five years but held back by its large cost base. Its average operating margin of 8% was weak for a business services business.
On the plus side, Interface’s operating margin rose by 3.4 percentage points over the last five years.
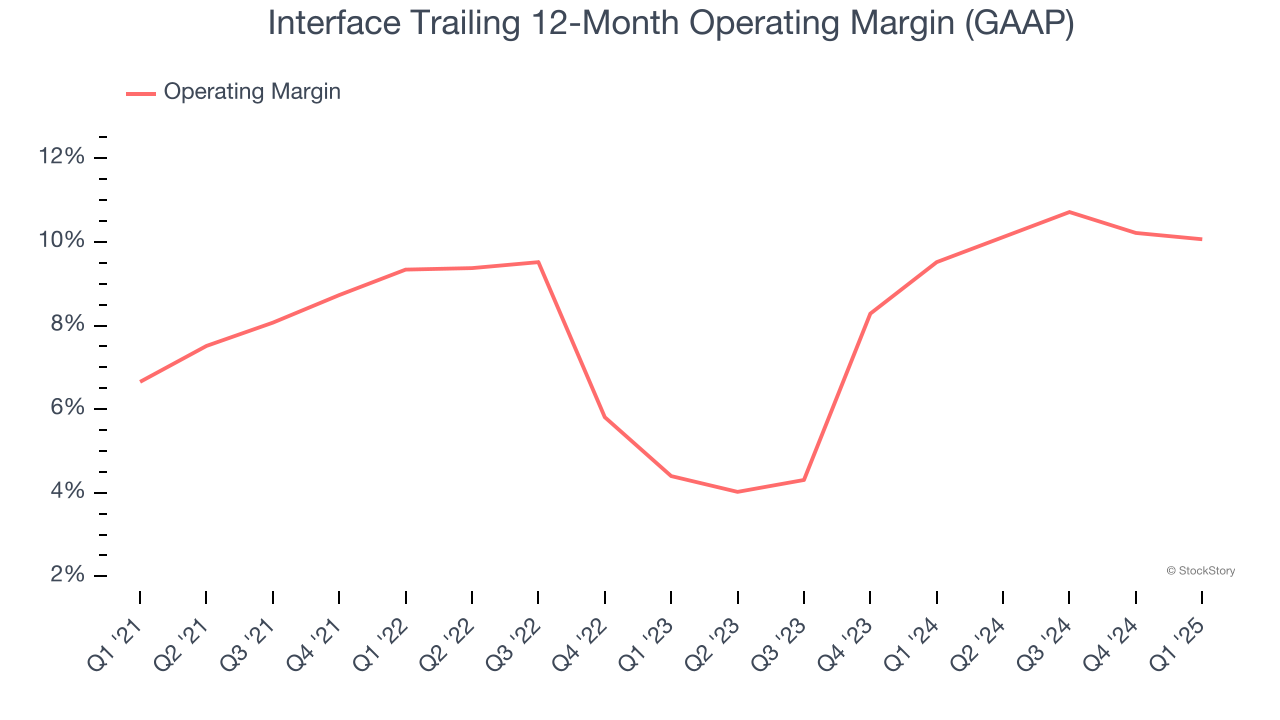
This quarter, Interface generated an operating profit margin of 7.8%, in line with the same quarter last year. This indicates the company’s overall cost structure has been relatively stable.
Earnings Per Share
We track the long-term change in earnings per share (EPS) for the same reason as long-term revenue growth. Compared to revenue, however, EPS highlights whether a company’s growth is profitable.
Sadly for Interface, its EPS declined by 16.7% annually over the last five years while its revenue was flat. However, its operating margin actually expanded during this time, telling us that non-fundamental factors such as interest expenses and taxes affected its ultimate earnings.
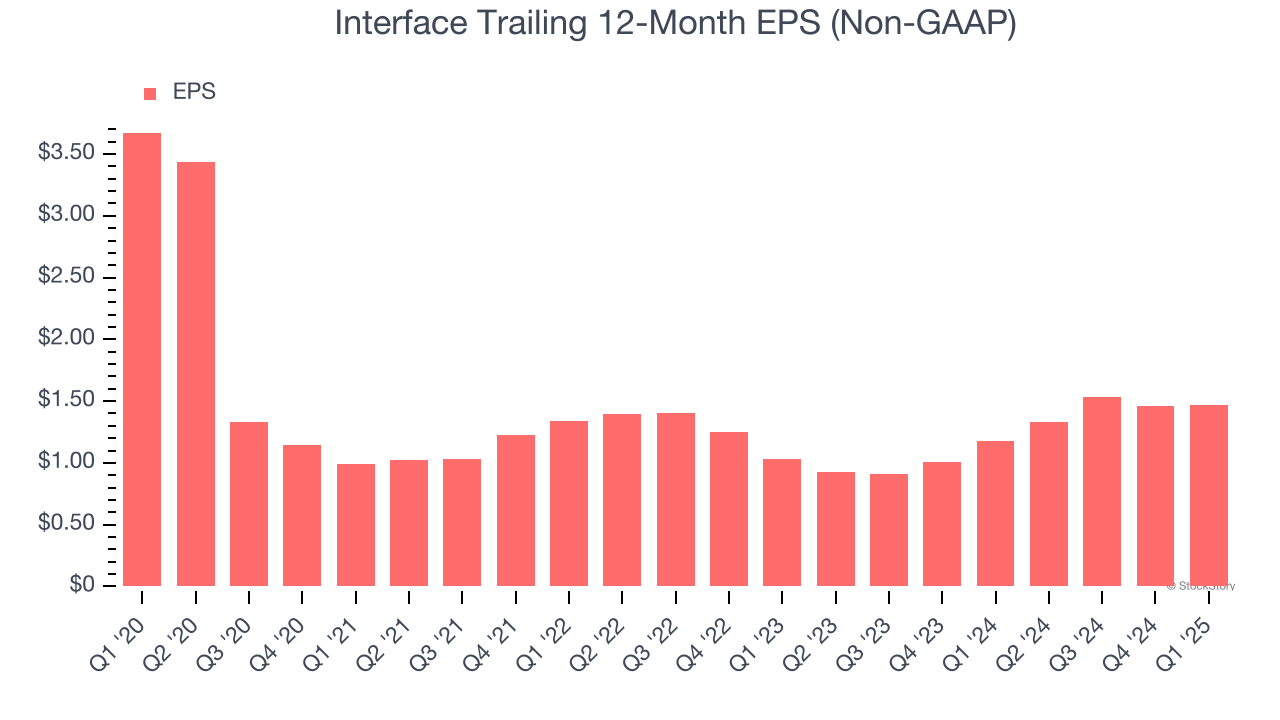
We can take a deeper look into Interface’s earnings to better understand the drivers of its performance. A five-year view shows Interface has diluted its shareholders, growing its share count by 1.2%. This dilution overshadowed its increased operating efficiency and has led to lower per share earnings. Taxes and interest expenses can also affect EPS but don’t tell us as much about a company’s fundamentals. 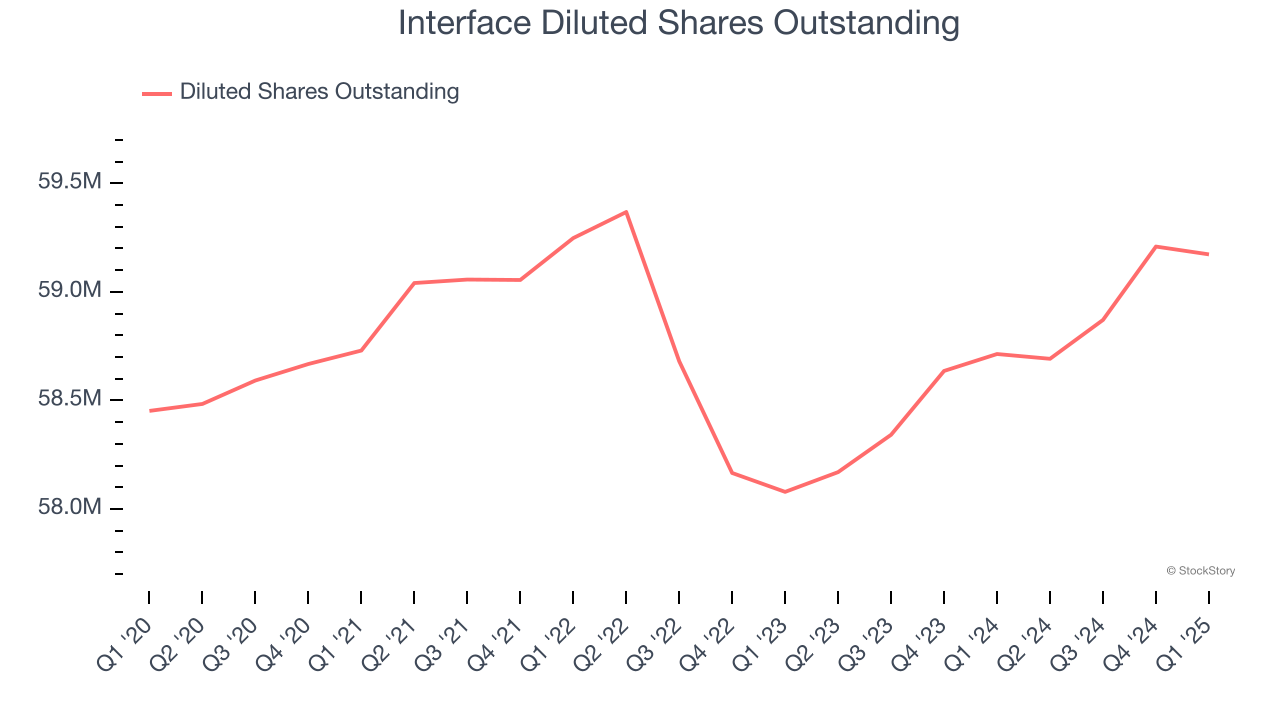
In Q1, Interface reported EPS at $0.25, in line with the same quarter last year. This print easily cleared analysts’ estimates, and shareholders should be content with the results. We also like to analyze expected EPS growth based on Wall Street analysts’ consensus projections, but there is insufficient data.
Key Takeaways from Interface’s Q1 Results
We were impressed by how significantly Interface blew past analysts’ EPS expectations this quarter. We were also glad its revenue guidance for next quarter exceeded Wall Street’s estimates. Zooming out, we think this was a solid print. The stock traded up 5.1% to $19.78 immediately after reporting.
Interface may have had a good quarter, but does that mean you should invest right now? If you’re making that decision, you should consider the bigger picture of valuation, business qualities, as well as the latest earnings. We cover that in our actionable full research report which you can read here, it’s free.