


Railcar products and services provider Trinity (NYSE: TRN) fell short of the market’s revenue expectations in Q1 CY2025, with sales falling 27.7% year on year to $585.4 million. Its GAAP profit of $0.26 per share was 18.8% below analysts’ consensus estimates.
Is now the time to buy Trinity? Find out by accessing our full research report, it’s free.
Trinity (TRN) Q1 CY2025 Highlights:
- Revenue: $585.4 million vs analyst estimates of $619.9 million (27.7% year-on-year decline, 5.6% miss)
- EPS (GAAP): $0.26 vs analyst expectations of $0.32 (18.8% miss)
- Adjusted EBITDA: $179.5 million vs analyst estimates of $182 million (30.7% margin, 1.4% miss)
- EPS (GAAP) guidance for the full year is $1.50 at the midpoint, beating analyst estimates by 7.1%
- Operating Margin: 17%, up from 13.9% in the same quarter last year
- Free Cash Flow was -$43.7 million compared to -$99.9 million in the same quarter last year
- Market Capitalization: $2.05 billion
“Trinity’s first quarter results reflect the strength and resilience of our platform,” said Trinity’s Chief Executive Officer and President, Jean Savage.
Company Overview
Operating under the trade name TrinityRail, Trinity (NYSE: TRN) is a provider of railcar products and services in North America.
Sales Growth
A company’s long-term sales performance can indicate its overall quality. Any business can put up a good quarter or two, but the best consistently grow over the long haul. Over the last five years, Trinity’s demand was weak and its revenue declined by 1.1% per year. This wasn’t a great result and suggests it’s a lower quality business.
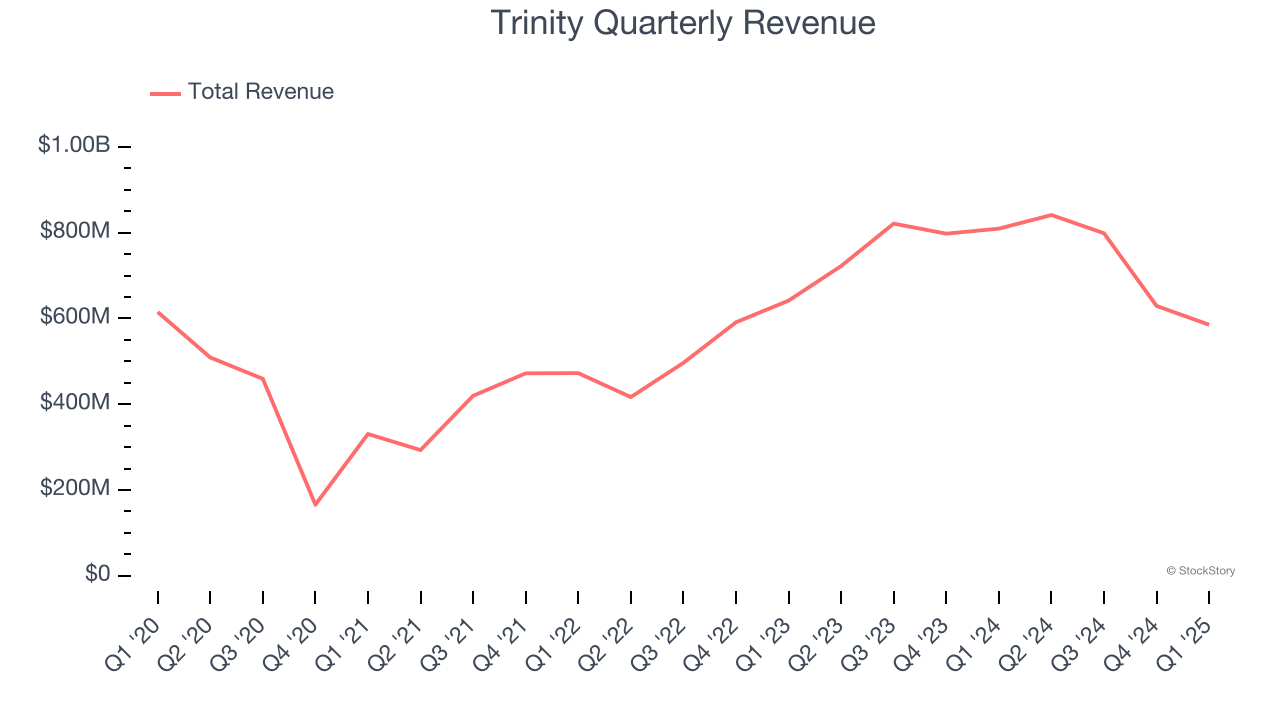
We at StockStory place the most emphasis on long-term growth, but within industrials, a half-decade historical view may miss cycles, industry trends, or a company capitalizing on catalysts such as a new contract win or a successful product line. Trinity’s annualized revenue growth of 15.3% over the last two years is above its five-year trend, suggesting its demand recently accelerated. 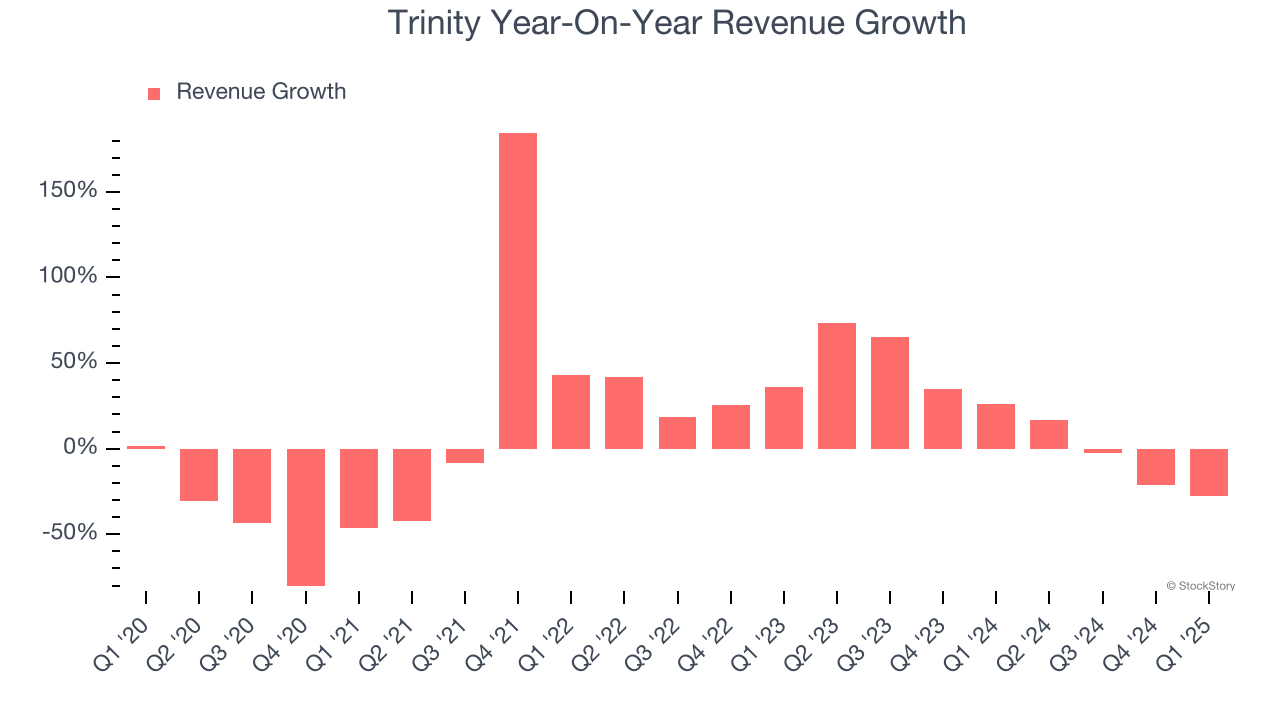
This quarter, Trinity missed Wall Street’s estimates and reported a rather uninspiring 27.7% year-on-year revenue decline, generating $585.4 million of revenue.
We also like to judge companies based on their projected revenue growth, but not enough Wall Street analysts cover the company for it to have reliable consensus estimates.
Unless you’ve been living under a rock, it should be obvious by now that generative AI is going to have a huge impact on how large corporations do business. While Nvidia and AMD are trading close to all-time highs, we prefer a lesser-known (but still profitable) stock benefiting from the rise of AI. Click here to access our free report one of our favorites growth stories.
Operating Margin
Trinity has been an efficient company over the last five years. It was one of the more profitable businesses in the industrials sector, boasting an average operating margin of 12.2%. This result was particularly impressive because of its low gross margin, which is mostly a factor of what it sells and takes huge shifts to move meaningfully. Companies have more control over their operating margins, and it’s a show of well-managed operations if they’re high when gross margins are low.
Looking at the trend in its profitability, Trinity’s operating margin might fluctuated slightly but has generally stayed the same over the last five years, highlighting the consistency of its expense base.
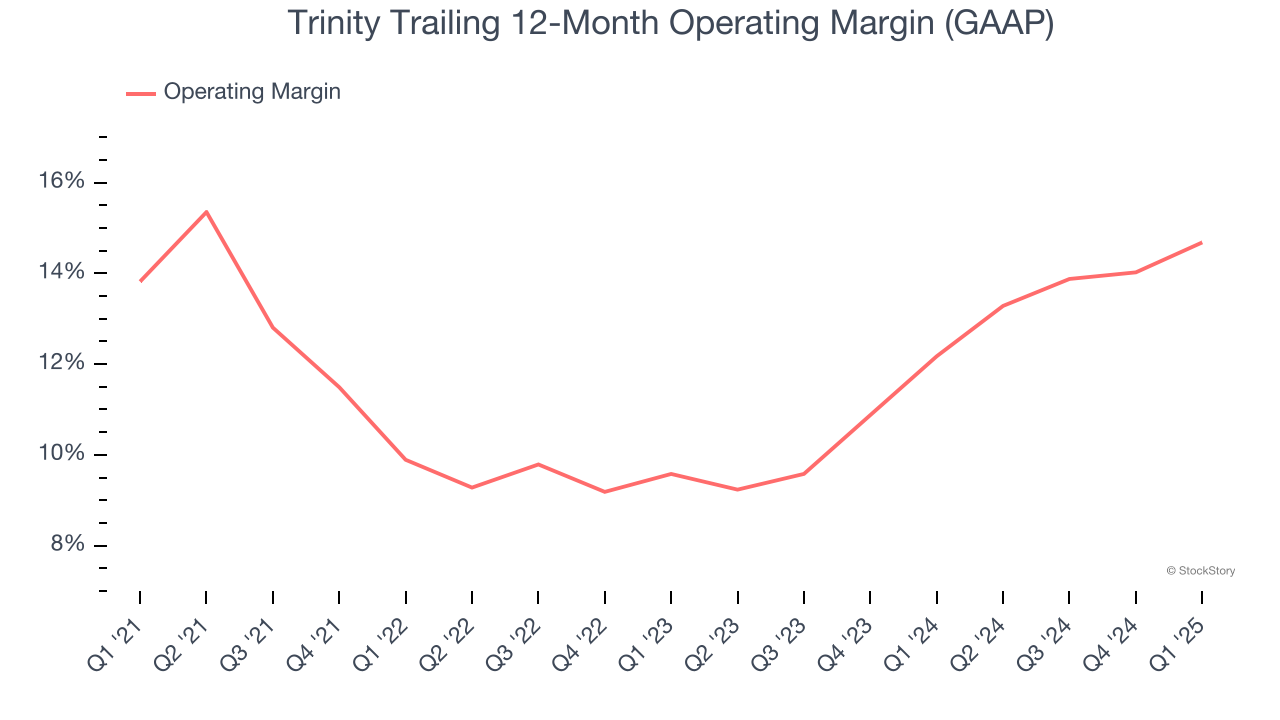
This quarter, Trinity generated an operating profit margin of 17%, up 3.2 percentage points year on year. Since its gross margin expanded more than its operating margin, we can infer that leverage on its cost of sales was the primary driver behind the recently higher efficiency.
Earnings Per Share
Revenue trends explain a company’s historical growth, but the long-term change in earnings per share (EPS) points to the profitability of that growth – for example, a company could inflate its sales through excessive spending on advertising and promotions.
Sadly for Trinity, its EPS declined by 5.7% annually over the last five years, more than its revenue. This tells us the company struggled because its fixed cost base made it difficult to adjust to shrinking demand.
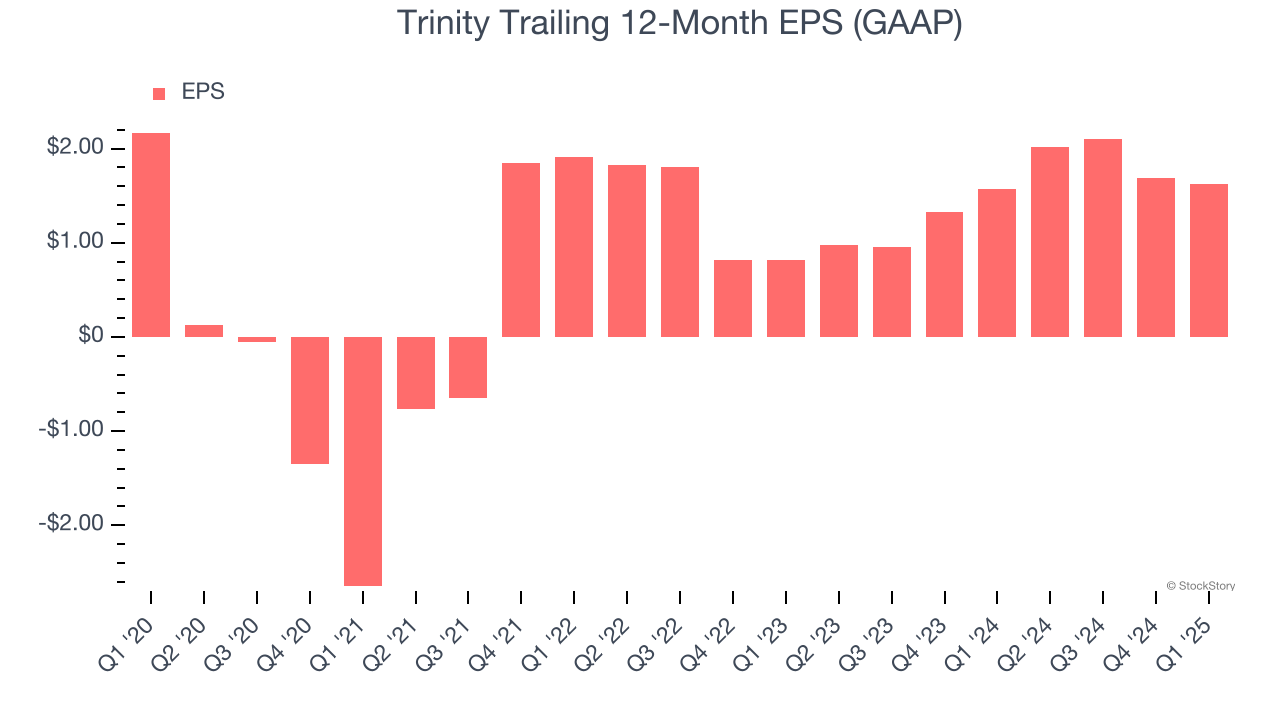
Like with revenue, we analyze EPS over a more recent period because it can provide insight into an emerging theme or development for the business.
Trinity’s two-year annual EPS growth of 40.6% was fantastic and topped its 15.3% two-year revenue growth.
In Q1, Trinity reported EPS at $0.26, down from $0.33 in the same quarter last year. This print missed analysts’ estimates. We also like to analyze expected EPS growth based on Wall Street analysts’ consensus projections, but there is insufficient data.
Key Takeaways from Trinity’s Q1 Results
We were impressed by Trinity’s optimistic full-year EPS guidance, which blew past analysts’ expectations. On the other hand, its revenue missed significantly and its EPS fell short of Wall Street’s estimates. Overall, this quarter could have been better. The stock traded down 2.4% to $24.50 immediately following the results.
The latest quarter from Trinity’s wasn’t that good. One earnings report doesn’t define a company’s quality, though, so let’s explore whether the stock is a buy at the current price. What happened in the latest quarter matters, but not as much as longer-term business quality and valuation, when deciding whether to invest in this stock. We cover that in our actionable full research report which you can read here, it’s free.


