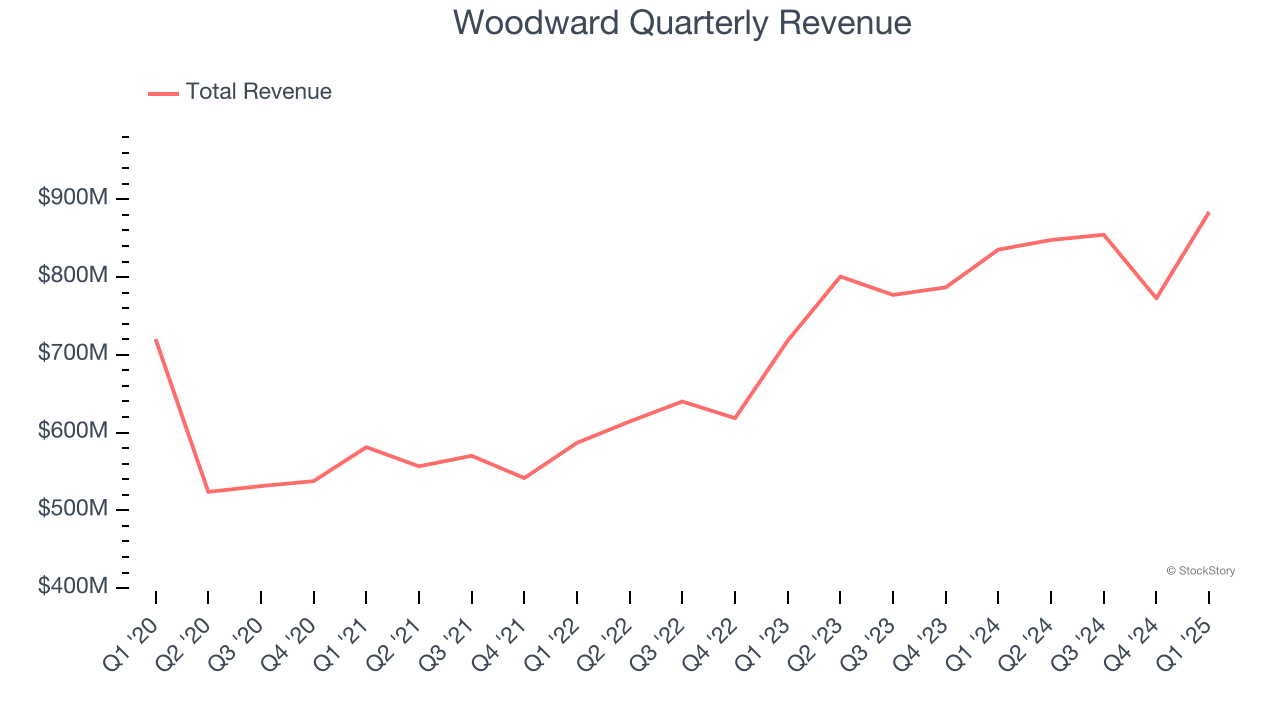
Aerospace and defense company Woodward (NASDAQ: WWD) beat Wall Street’s revenue expectations in Q1 CY2025, with sales up 5.8% year on year to $883.6 million. The company’s full-year revenue guidance of $3.44 billion at the midpoint came in 1% above analysts’ estimates. Its non-GAAP profit of $1.69 per share was 15.4% above analysts’ consensus estimates.
Is now the time to buy Woodward? Find out by accessing our full research report, it’s free.
Woodward (WWD) Q1 CY2025 Highlights:
- Revenue: $883.6 million vs analyst estimates of $835.6 million (5.8% year-on-year growth, 5.7% beat)
- Adjusted EPS: $1.69 vs analyst estimates of $1.46 (15.4% beat)
- Adjusted EBITDA: $164 million vs analyst estimates of $154.3 million (18.6% margin, 6.3% beat)
- The company lifted its revenue guidance for the full year to $3.44 billion at the midpoint from $3.4 billion, a 1.1% increase
- Management slightly raised its full-year Adjusted EPS guidance to $6.10 at the midpoint
- Operating Margin: 17.7%, up from 13.9% in the same quarter last year
- Free Cash Flow Margin: 6.7%, down from 9.9% in the same quarter last year
- Market Capitalization: $10.8 billion
"Our strong second quarter results were in line with our expectations, reflecting the dedication of our members in a volatile environment,” said Chip Blankenship, Chairman and Chief Executive Officer.
Company Overview
Initially designing controls for water wheels in the early 1900s, Woodward (NASDAQ: WWD) designs, services, and manufactures energy control products and optimization solutions.
Sales Growth
A company’s long-term sales performance is one signal of its overall quality. Even a bad business can shine for one or two quarters, but a top-tier one grows for years. Regrettably, Woodward’s sales grew at a sluggish 2.8% compounded annual growth rate over the last five years. This fell short of our benchmarks and is a poor baseline for our analysis.
Long-term growth is the most important, but within industrials, a half-decade historical view may miss new industry trends or demand cycles. Woodward’s annualized revenue growth of 13.8% over the last two years is above its five-year trend, suggesting its demand recently accelerated. 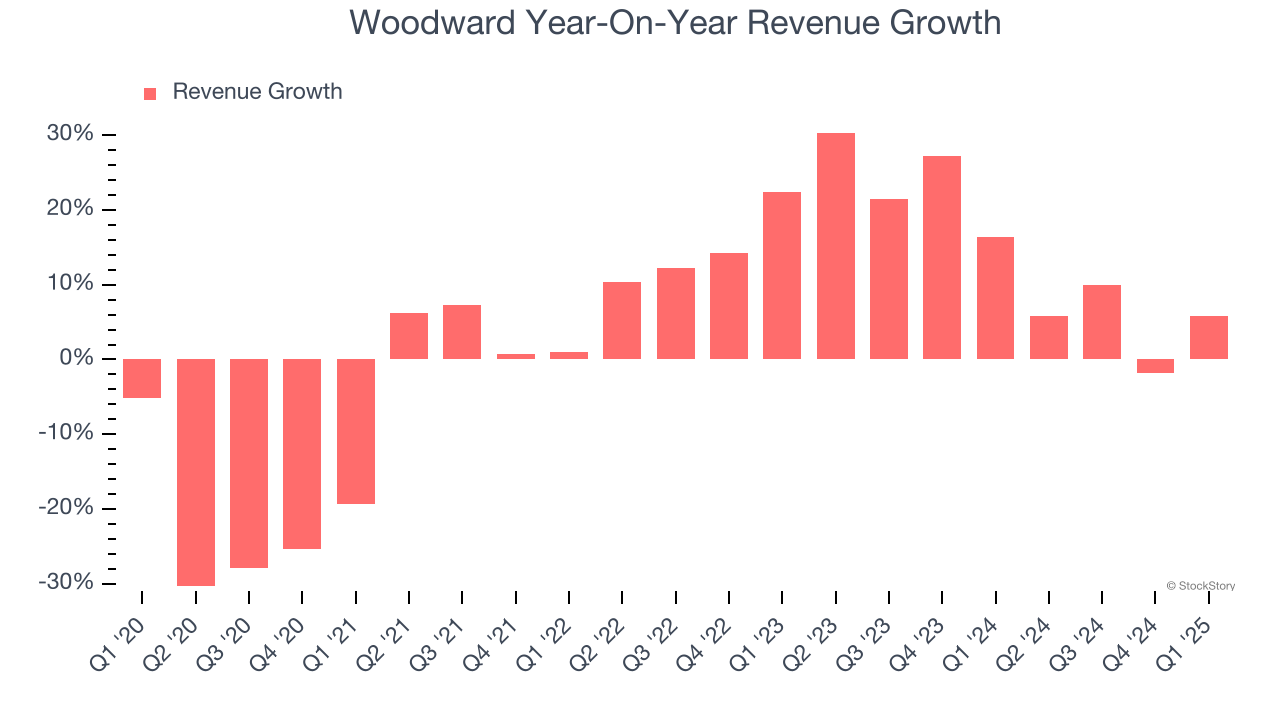
This quarter, Woodward reported year-on-year revenue growth of 5.8%, and its $883.6 million of revenue exceeded Wall Street’s estimates by 5.7%.
Looking ahead, sell-side analysts expect revenue to grow 5.5% over the next 12 months, a deceleration versus the last two years. This projection doesn't excite us and indicates its products and services will see some demand headwinds.
Software is eating the world and there is virtually no industry left that has been untouched by it. That drives increasing demand for tools helping software developers do their jobs, whether it be monitoring critical cloud infrastructure, integrating audio and video functionality, or ensuring smooth content streaming. Click here to access a free report on our 3 favorite stocks to play this generational megatrend.
Operating Margin
Woodward has managed its cost base well over the last five years. It demonstrated solid profitability for an industrials business, producing an average operating margin of 11%.
Analyzing the trend in its profitability, Woodward’s operating margin rose by 3.4 percentage points over the last five years, as its sales growth gave it operating leverage.
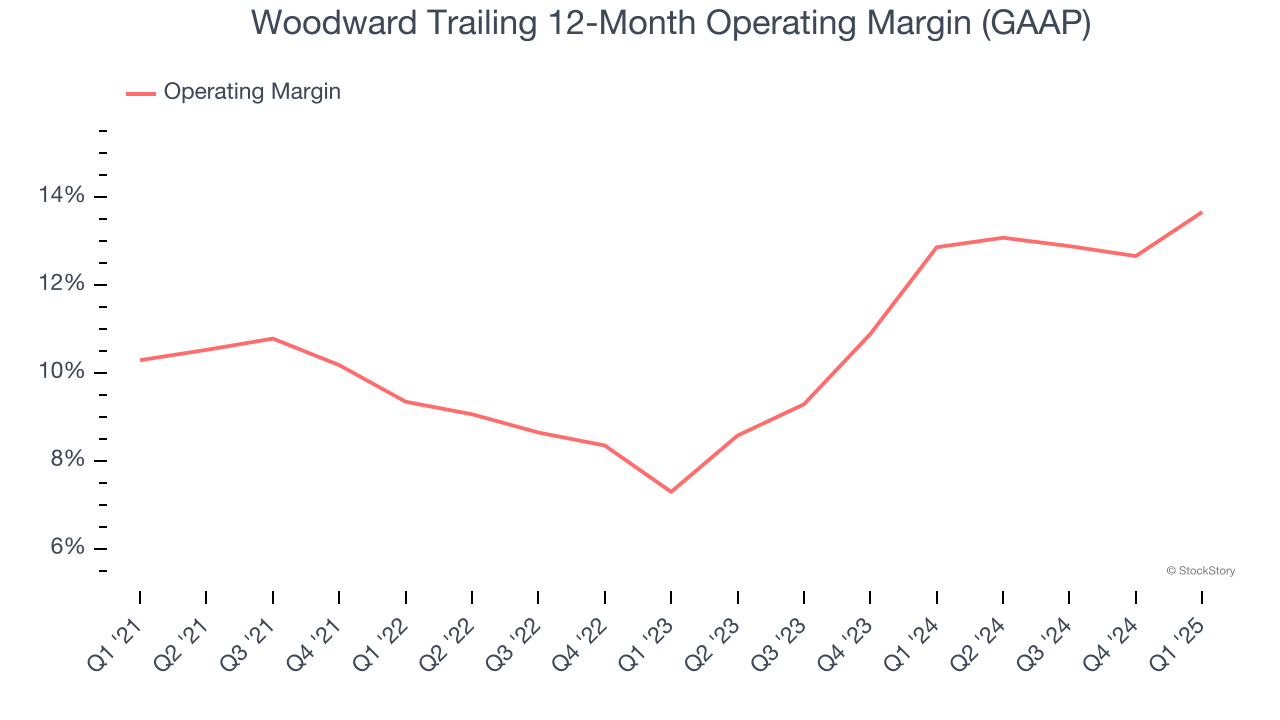
In Q1, Woodward generated an operating profit margin of 17.7%, up 3.7 percentage points year on year. This increase was a welcome development and shows it was more efficient.
Earnings Per Share
Revenue trends explain a company’s historical growth, but the long-term change in earnings per share (EPS) points to the profitability of that growth – for example, a company could inflate its sales through excessive spending on advertising and promotions.
Woodward’s weak 3.1% annual EPS growth over the last five years aligns with its revenue performance. On the bright side, this tells us its incremental sales were profitable.
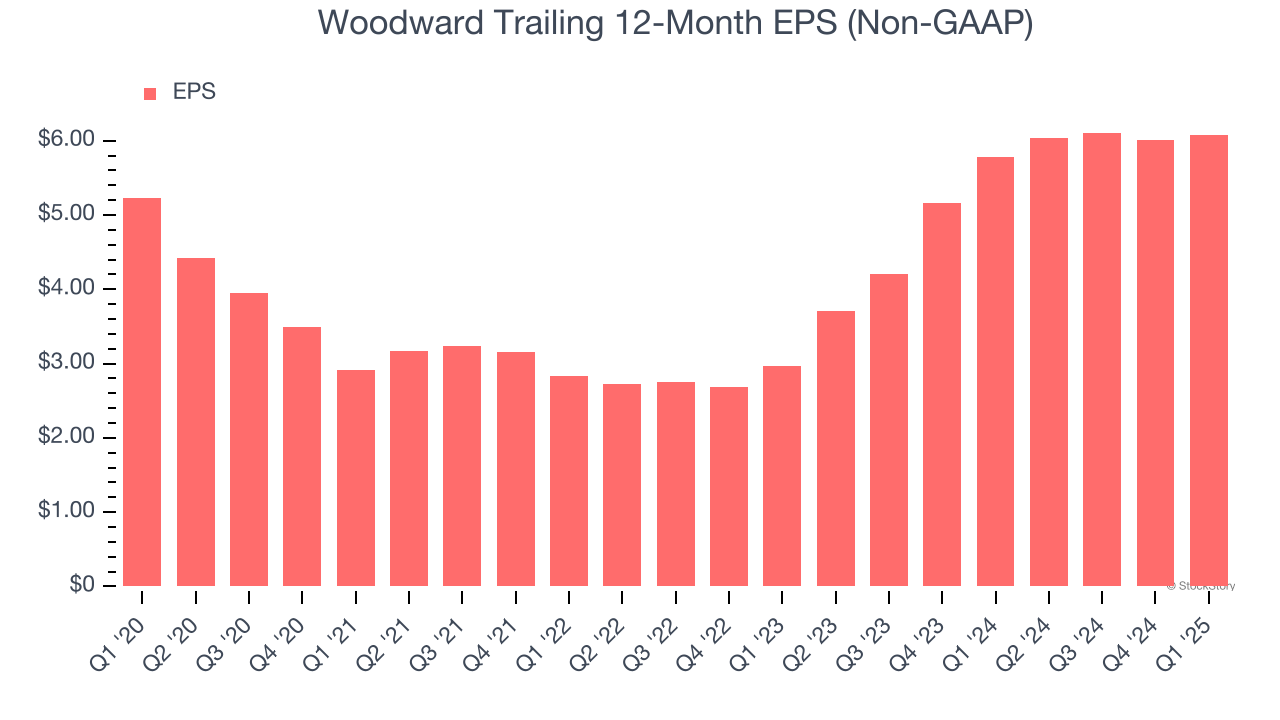
Like with revenue, we analyze EPS over a shorter period to see if we are missing a change in the business.
Woodward’s two-year annual EPS growth of 43.1% was fantastic and topped its 13.8% two-year revenue growth.
In Q1, Woodward reported EPS at $1.69, up from $1.62 in the same quarter last year. This print easily cleared analysts’ estimates, and shareholders should be content with the results. Over the next 12 months, Wall Street expects Woodward’s full-year EPS of $6.08 to grow 9%.
Key Takeaways from Woodward’s Q1 Results
We were impressed by how significantly Woodward blew past analysts’ revenue, EPS, and EBITDA expectations this quarter. We were also glad it lifted its full-year revenue and EPS guidance, although the EPS outlook slightly missed. Overall, we think this was a solid quarter with some key metrics above expectations. The stock traded up 3.2% to $187.42 immediately after reporting.
Sure, Woodward had a solid quarter, but if we look at the bigger picture, is this stock a buy? When making that decision, it’s important to consider its valuation, business qualities, as well as what has happened in the latest quarter. We cover that in our actionable full research report which you can read here, it’s free.