


IT distribution giant TD SYNNEX (NYSE: SNX) missed Wall Street’s revenue expectations in Q1 CY2025 as sales rose 4% year on year to $14.53 billion. Next quarter’s revenue guidance of $14.3 billion underwhelmed, coming in 2.7% below analysts’ estimates. Its non-GAAP profit of $2.80 per share was 3.6% below analysts’ consensus estimates.
Is now the time to buy TD SYNNEX? Find out by accessing our full research report, it’s free.
TD SYNNEX (SNX) Q1 CY2025 Highlights:
- Revenue: $14.53 billion vs analyst estimates of $14.79 billion (4% year-on-year growth, 1.7% miss)
- Adjusted EPS: $2.80 vs analyst expectations of $2.91 (3.6% miss)
- Adjusted EBITDA: $427.1 million vs analyst estimates of $435.3 million (2.9% margin, 1.9% miss)
- Revenue Guidance for Q2 CY2025 is $14.3 billion at the midpoint, below analyst estimates of $14.7 billion
- Adjusted EPS guidance for Q2 CY2025 is $2.70 at the midpoint, below analyst estimates of $3.03
- Operating Margin: 2.1%, in line with the same quarter last year
- Free Cash Flow was -$789.5 million, down from $343.6 million in the same quarter last year
- Market Capitalization: $10.58 billion
“The strength of our business model allowed us to grow ahead of the market in Q1. Our end-to-end strategy, global reach and specialist go to market approach continues to empower us to capture a wide range of IT spend,” said Patrick Zammit, CEO of TD SYNNEX.
Company Overview
Serving as the crucial middleman in the technology supply chain, TD SYNNEX (NYSE: SNX) is a global technology distributor that connects thousands of IT manufacturers with resellers, helping businesses access hardware, software, and technology solutions.
IT Distribution & Solutions
IT Distribution & Solutions will be buoyed by the increasing complexity of IT ecosystems, rising cloud adoption, and demand for cybersecurity solutions. Enterprises are less likely than ever to embark on these complicated journeys solo, and companies in the sector boast expertise and scale in these areas. However, cloud migration also means less need for hardware, which could dent demand for large portions of the product portfolio and hurt margins. Additionally, planning for potentially supply chain disruptions is ongoing, as the COVID-19 pandemic showed how damaging a pause in global trade could be in areas like semiconductor procurement.
Sales Growth
Examining a company’s long-term performance can provide clues about its quality. Any business can experience short-term success, but top-performing ones enjoy sustained growth for years.
With $59.01 billion in revenue over the past 12 months, TD SYNNEX is a behemoth in the business services sector and benefits from economies of scale, giving it an edge in distribution. This also enables it to gain more leverage on its fixed costs than smaller competitors and the flexibility to offer lower prices.
As you can see below, TD SYNNEX’s sales grew at an incredible 21.2% compounded annual growth rate over the last five years. This shows it had high demand, a useful starting point for our analysis.
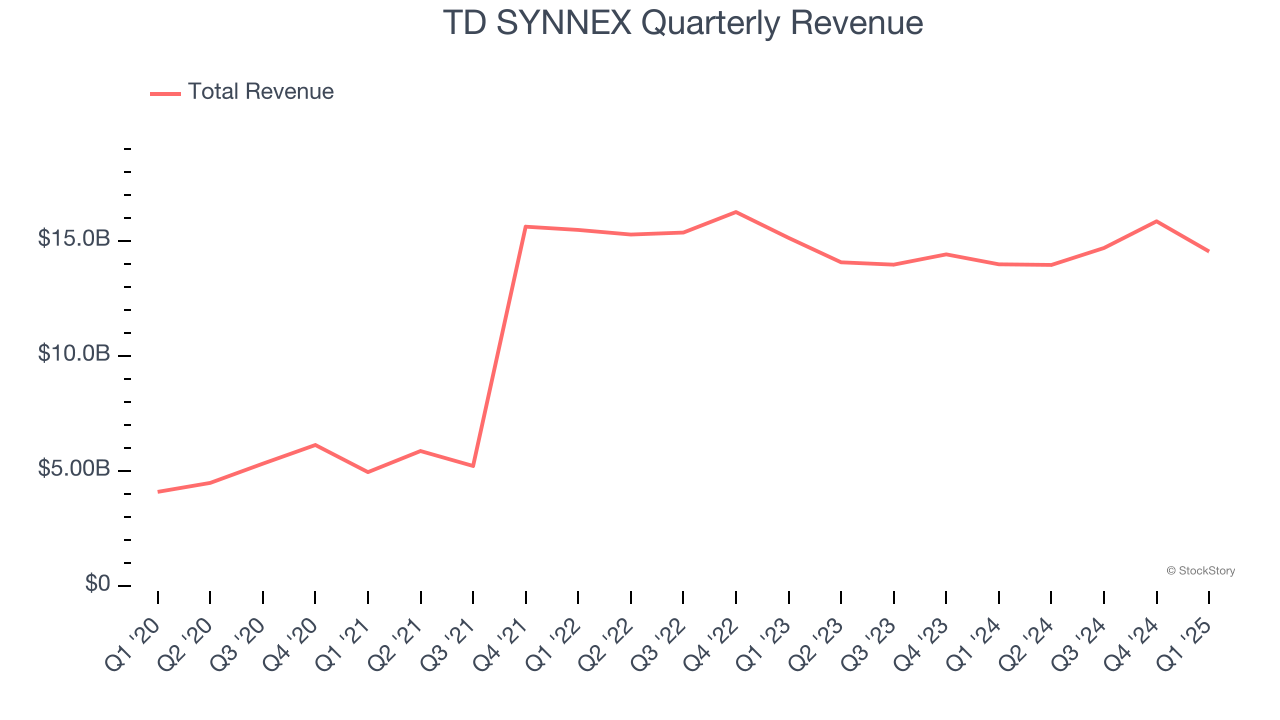
We at StockStory place the most emphasis on long-term growth, but within business services, a half-decade historical view may miss recent innovations or disruptive industry trends. TD SYNNEX’s recent performance marks a sharp pivot from its five-year trend as its revenue has shown annualized declines of 2.4% over the last two years. 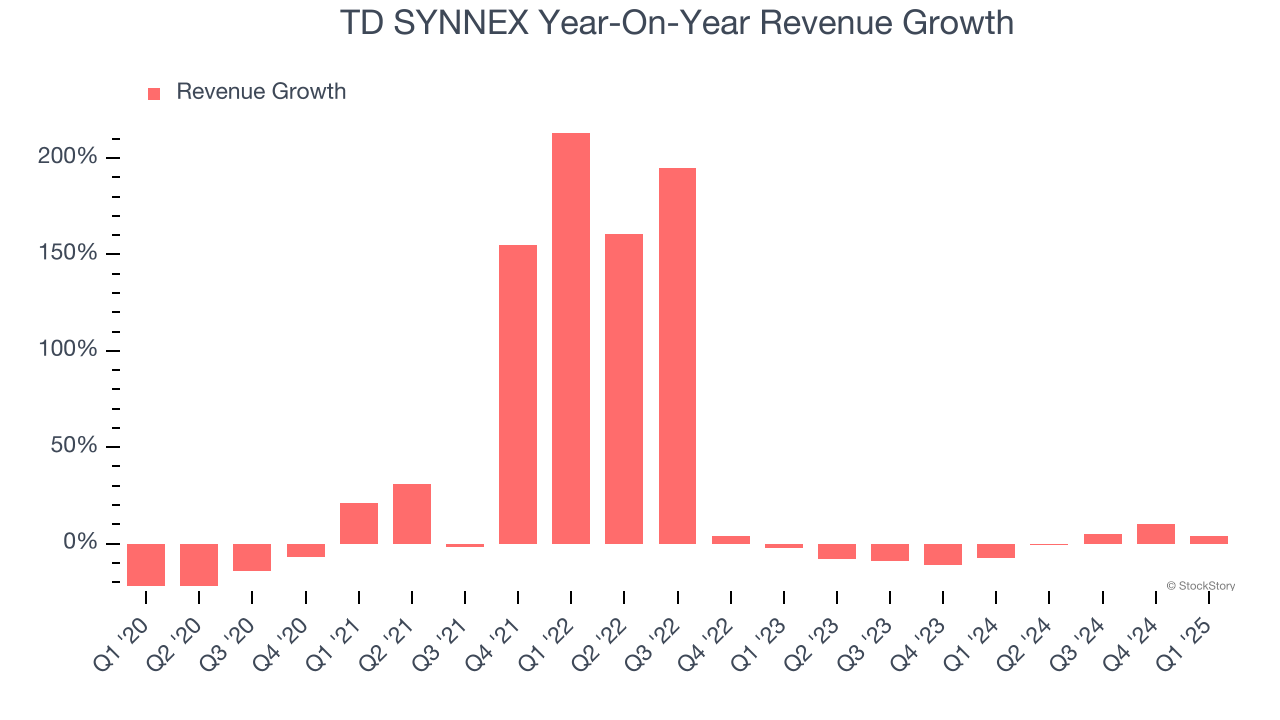
This quarter, TD SYNNEX’s revenue grew by 4% year on year to $14.53 billion, falling short of Wall Street’s estimates. Company management is currently guiding for a 2.5% year-on-year increase in sales next quarter.
Looking further ahead, sell-side analysts expect revenue to grow 5.9% over the next 12 months, an improvement versus the last two years. This projection is above the sector average and implies its newer products and services will spur better top-line performance.
Unless you’ve been living under a rock, it should be obvious by now that generative AI is going to have a huge impact on how large corporations do business. While Nvidia and AMD are trading close to all-time highs, we prefer a lesser-known (but still profitable) stock benefiting from the rise of AI. Click here to access our free report one of our favorites growth stories.
Operating Margin
Operating margin is an important measure of profitability as it shows the portion of revenue left after accounting for all core expenses – everything from the cost of goods sold to advertising and wages. It’s also useful for comparing profitability across companies with different levels of debt and tax rates because it excludes interest and taxes.
TD SYNNEX was profitable over the last five years but held back by its large cost base. Its average operating margin of 1.9% was weak for a business services business.
Analyzing the trend in its profitability, TD SYNNEX’s operating margin might fluctuated slightly but has generally stayed the same over the last five years. This raises questions about the company’s expense base because its revenue growth should have given it leverage on its fixed costs, resulting in better economies of scale and profitability.
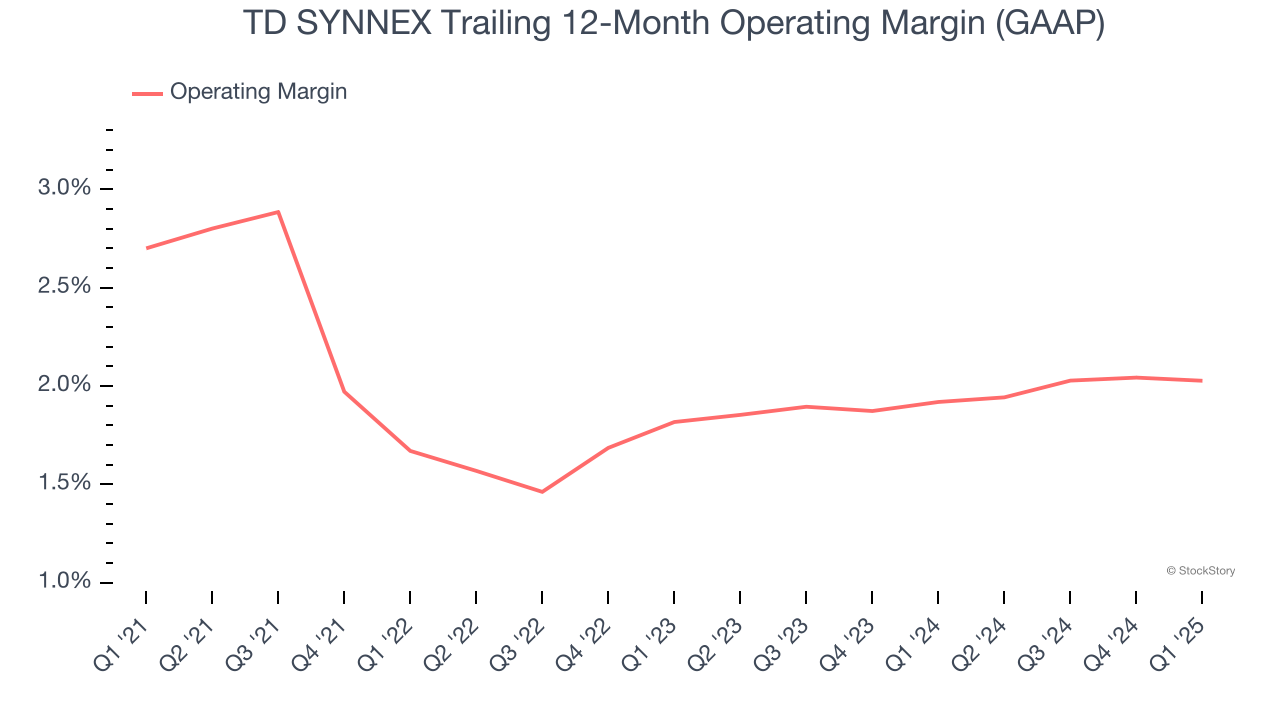
This quarter, TD SYNNEX generated an operating profit margin of 2.1%, in line with the same quarter last year. This indicates the company’s overall cost structure has been relatively stable.
Earnings Per Share
We track the long-term change in earnings per share (EPS) for the same reason as long-term revenue growth. Compared to revenue, however, EPS highlights whether a company’s growth is profitable.
TD SYNNEX’s flat EPS over the last five years was below its 21.2% annualized revenue growth. However, its operating margin didn’t change during this time, telling us that non-fundamental factors such as interest and taxes affected its ultimate earnings.
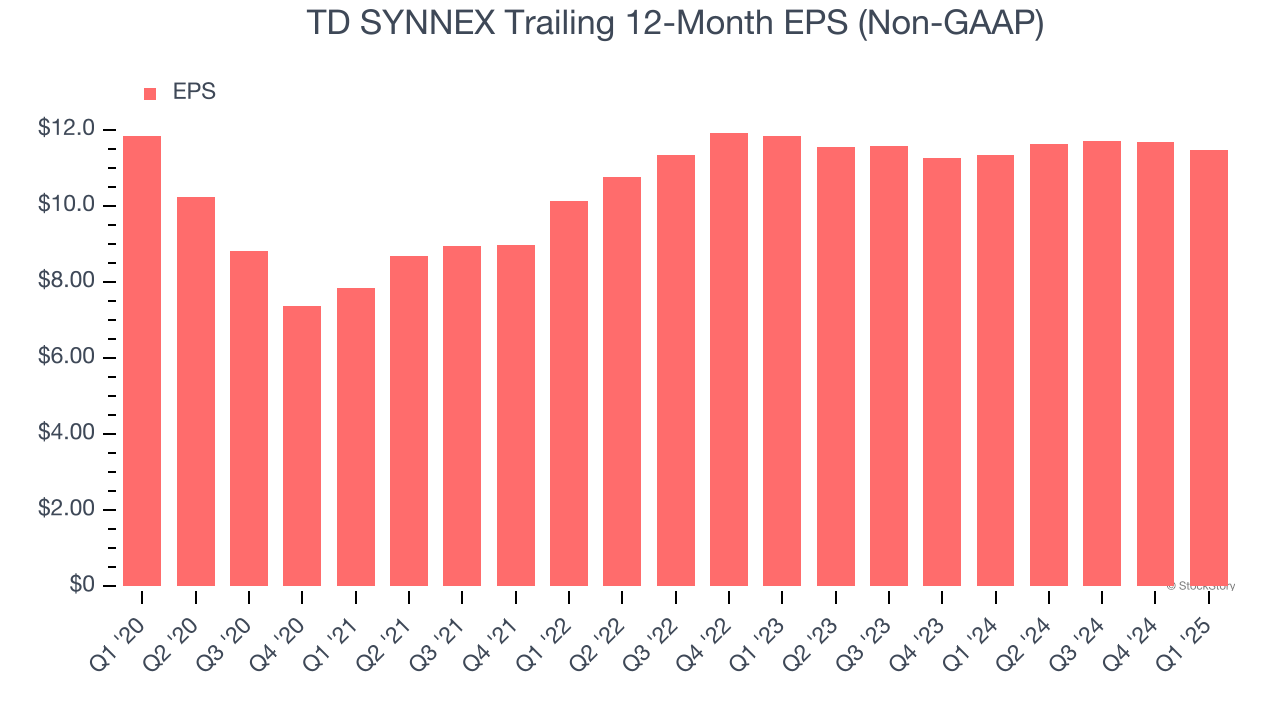
We can take a deeper look into TD SYNNEX’s earnings to better understand the drivers of its performance. A five-year view shows TD SYNNEX has diluted its shareholders, growing its share count by 63.9%. This has led to lower per share earnings. Taxes and interest expenses can also affect EPS but don’t tell us as much about a company’s fundamentals. 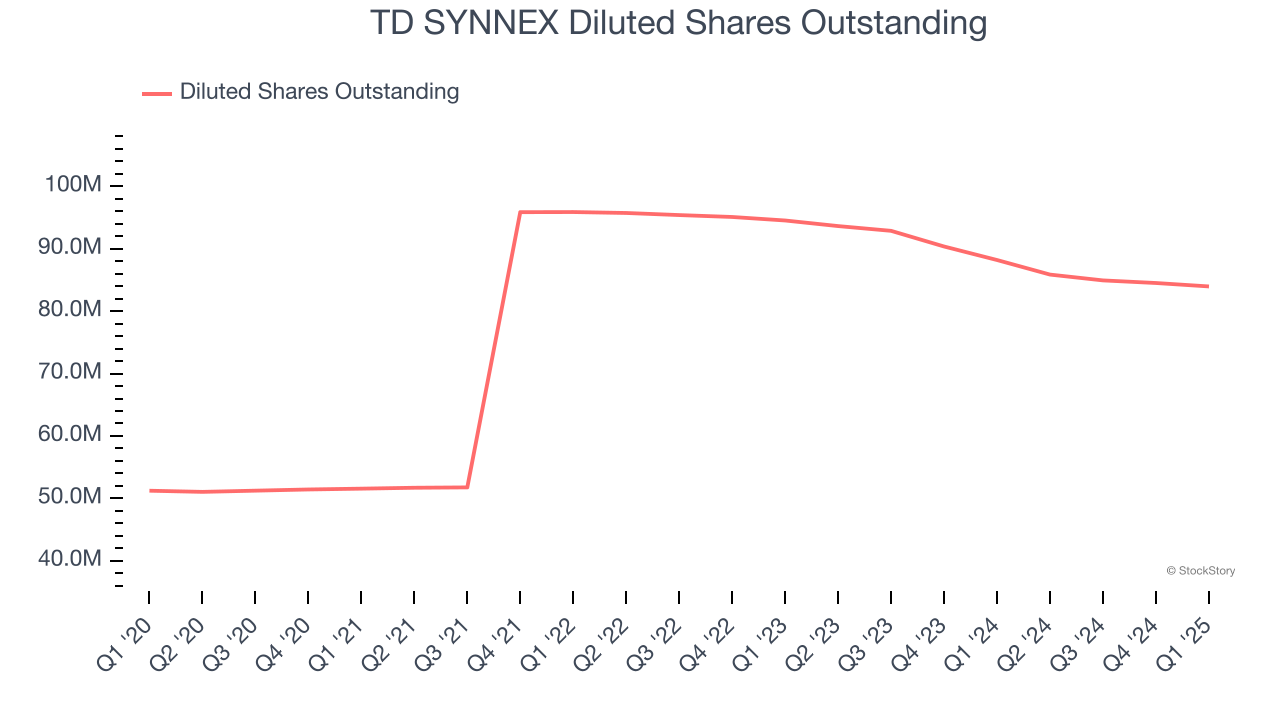
In Q1, TD SYNNEX reported EPS at $2.80, down from $2.99 in the same quarter last year. This print missed analysts’ estimates. Over the next 12 months, Wall Street expects TD SYNNEX’s full-year EPS of $11.48 to grow 15.9%.
Key Takeaways from TD SYNNEX’s Q1 Results
We struggled to find many positives in these results. Its revenue guidance for next quarter missed significantly and its EPS guidance for next quarter fell short of Wall Street’s estimates. Overall, this was a softer quarter. The stock traded down 9.7% to $113.32 immediately after reporting.
TD SYNNEX underperformed this quarter, but does that create an opportunity to invest right now? If you’re making that decision, you should consider the bigger picture of valuation, business qualities, as well as the latest earnings. We cover that in our actionable full research report which you can read here, it’s free.


