Fashion conglomerate Oxford Industries (NYSE: OXM) reported revenue ahead of Wall Street’s expectations in Q4 CY2024, but sales fell by 3.4% year on year to $390.5 million. On the other hand, next quarter’s revenue guidance of $385 million was less impressive, coming in 4.9% below analysts’ estimates. Its non-GAAP profit of $1.37 per share was 8.1% above analysts’ consensus estimates.
Is now the time to buy Oxford Industries? Find out by accessing our full research report, it’s free.
Oxford Industries (OXM) Q4 CY2024 Highlights:
- Revenue: $390.5 million vs analyst estimates of $383.9 million (3.4% year-on-year decline, 1.7% beat)
- Adjusted EPS: $1.37 vs analyst estimates of $1.27 (8.1% beat)
- Management’s revenue guidance for the upcoming financial year 2025 is $1.51 billion at the midpoint, missing analyst estimates by 1.9% and implying -0.4% growth (vs -3.6% in FY2024)
- Adjusted EPS guidance for the upcoming financial year 2025 is $4.80 at the midpoint, missing analyst estimates by 29.5%
- Operating Margin: 5.2%, up from -20.1% in the same quarter last year
- Free Cash Flow Margin: 12.4%, down from 13.7% in the same quarter last year
- Market Capitalization: $969.9 million
Tom Chubb, Chairman and CEO, commented, “We are pleased to report fourth quarter net sales and adjusted earnings per share that were near the top end of our guidance ranges. Our results were driven by a successful holiday season as our consumer showed up to buy their loved ones and friends the gifts that they really wanted from the brands that they love. Following a strong finish to calendar year 2024, trends moderated in January as there was less of a reason to shop, a pattern we’ve witnessed for the past several quarters, as well as a deterioration in consumer sentiment that also weighed on demand.”
Company Overview
The parent company of Tommy Bahama, Oxford Industries (NYSE: OXM) is a lifestyle fashion conglomerate with brands that embody outdoor happiness.
Apparel and Accessories
Thanks to social media and the internet, not only are styles changing more frequently today than in decades past but also consumers are shifting the way they buy their goods, favoring omnichannel and e-commerce experiences. Some apparel and accessories companies have made concerted efforts to adapt while those who are slower to move may fall behind.
Sales Growth
Examining a company’s long-term performance can provide clues about its quality. Any business can experience short-term success, but top-performing ones enjoy sustained growth for years. Regrettably, Oxford Industries’s sales grew at a sluggish 6.2% compounded annual growth rate over the last five years. This fell short of our benchmark for the consumer discretionary sector and is a poor baseline for our analysis.
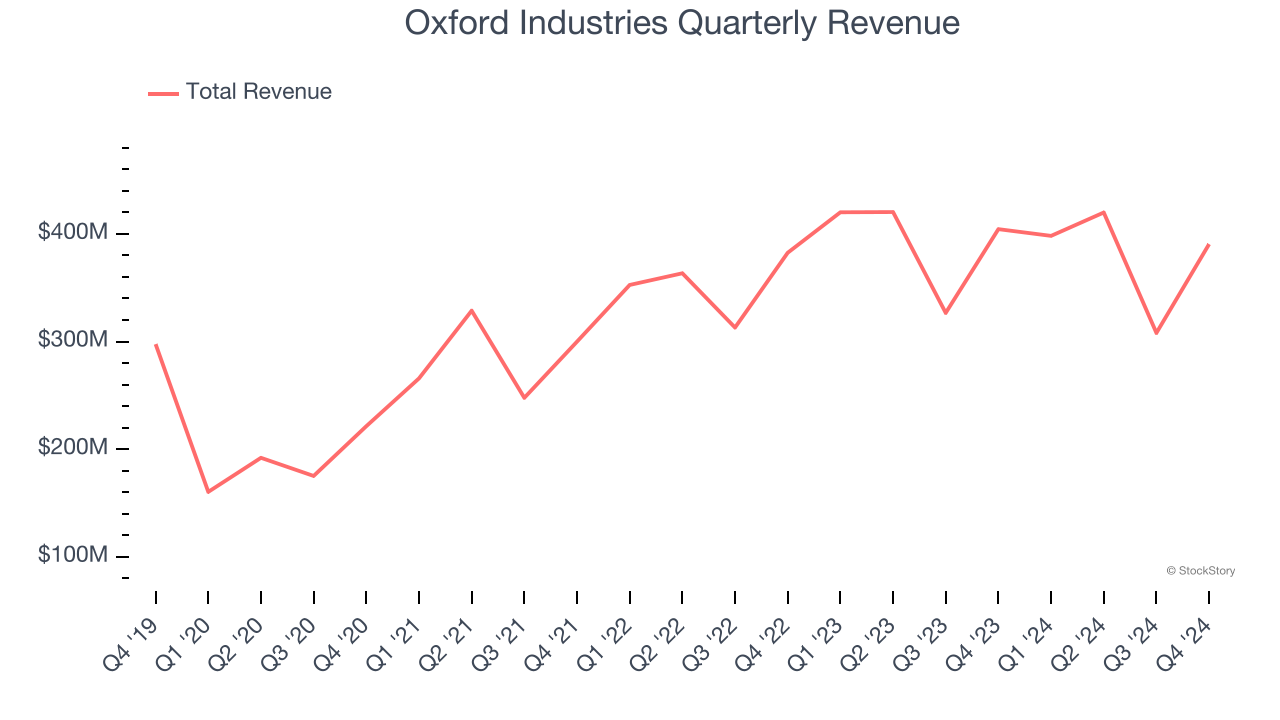
Long-term growth is the most important, but within consumer discretionary, product cycles are short and revenue can be hit-driven due to rapidly changing trends and consumer preferences. Oxford Industries’s recent performance shows its demand has slowed as its annualized revenue growth of 3.7% over the last two years was below its five-year trend. 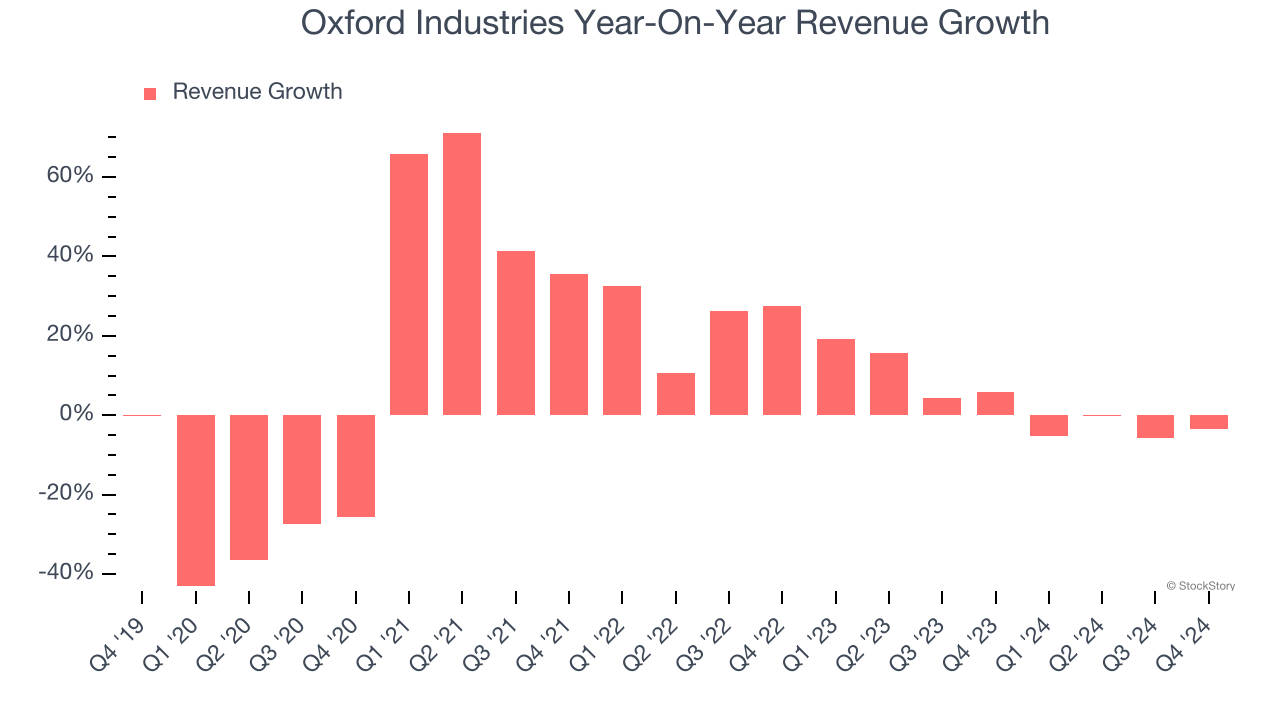
This quarter, Oxford Industries’s revenue fell by 3.4% year on year to $390.5 million but beat Wall Street’s estimates by 1.7%. Company management is currently guiding for a 3.3% year-on-year decline in sales next quarter.
Looking further ahead, sell-side analysts expect revenue to grow 2.2% over the next 12 months, similar to its two-year rate. This projection doesn't excite us and indicates its products and services will see some demand headwinds.
Here at StockStory, we certainly understand the potential of thematic investing. Diverse winners from Microsoft (MSFT) to Alphabet (GOOG), Coca-Cola (KO) to Monster Beverage (MNST) could all have been identified as promising growth stories with a megatrend driving the growth. So, in that spirit, we’ve identified a relatively under-the-radar profitable growth stock benefiting from the rise of AI, available to you FREE via this link.
Operating Margin
Oxford Industries’s operating margin has been trending up over the last 12 months and averaged 6.5% over the last two years. The company’s higher efficiency is a breath of fresh air, but its suboptimal cost structure means it still sports paltry profitability for a consumer discretionary business.
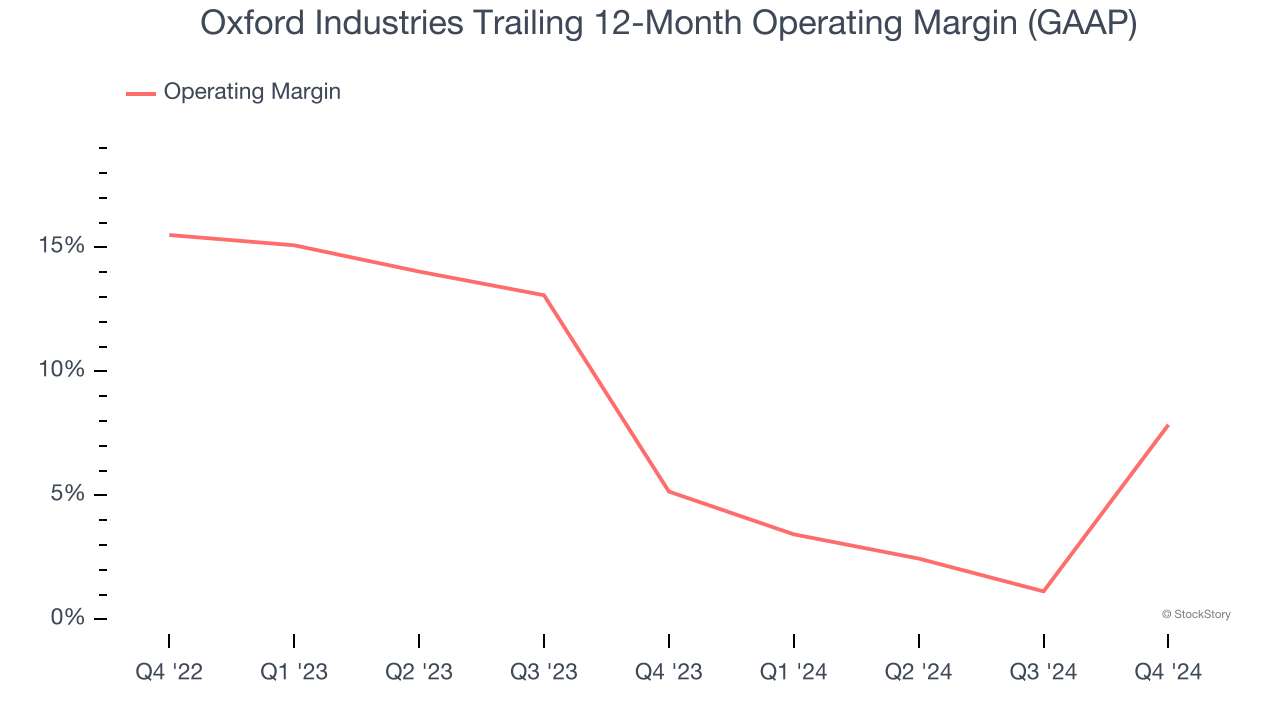
This quarter, Oxford Industries generated an operating profit margin of 5.2%, up 25.3 percentage points year on year. This increase was a welcome development, especially since its revenue fell, showing it was more efficient because it scaled down its expenses.
Earnings Per Share
We track the long-term change in earnings per share (EPS) for the same reason as long-term revenue growth. Compared to revenue, however, EPS highlights whether a company’s growth is profitable.
Oxford Industries’s EPS grew at an unimpressive 9.1% compounded annual growth rate over the last five years. This performance was better than its flat revenue but doesn’t tell us much about its business quality because its operating margin didn’t expand.
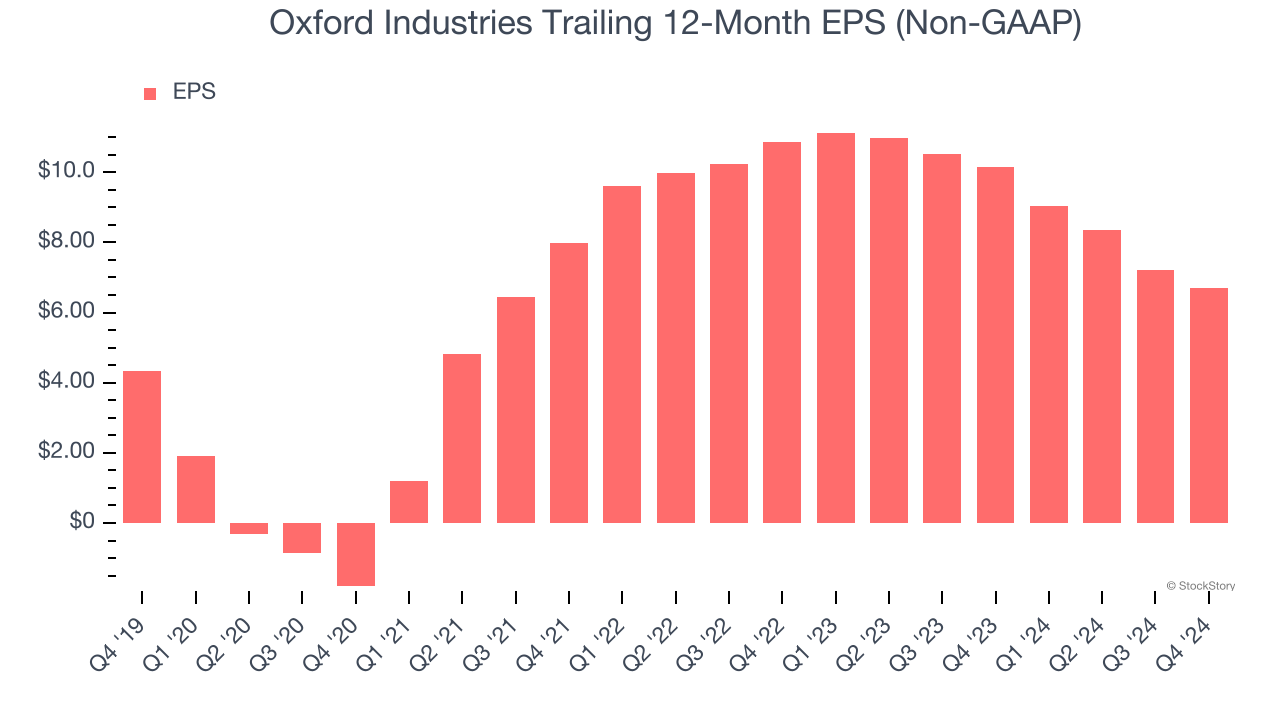
In Q4, Oxford Industries reported EPS at $1.37, down from $1.90 in the same quarter last year. Despite falling year on year, this print beat analysts’ estimates by 8.1%. Over the next 12 months, Wall Street expects Oxford Industries’s full-year EPS of $6.69 to grow 4.7%.
Key Takeaways from Oxford Industries’s Q4 Results
It was encouraging to see Oxford Industries beat analysts’ revenue and EPS expectations this quarter. On the other hand, its full-year revenue and EPS guidance fell short, making this a softer quarter. The stock traded down 6.6% to $58.52 immediately following the results.
Oxford Industries underperformed this quarter, but does that create an opportunity to invest right now? We think that the latest quarter is only one piece of the longer-term business quality puzzle. Quality, when combined with valuation, can help determine if the stock is a buy. We cover that in our actionable full research report which you can read here, it’s free.