


Homebuilder Lennar (NYSE: LEN) reported Q1 CY2025 results exceeding the market’s revenue expectations, with sales up 4.4% year on year to $7.63 billion. Its GAAP profit of $1.96 per share was 13.4% above analysts’ consensus estimates.
Is now the time to buy Lennar? Find out by accessing our full research report, it’s free.
Lennar (LEN) Q1 CY2025 Highlights:
- Revenue: $7.63 billion vs analyst estimates of $7.48 billion (4.4% year-on-year growth, 2% beat)
- EPS (GAAP): $1.96 vs analyst estimates of $1.73 (13.4% beat)
- Operating Margin: 9.4%, down from 12.3% in the same quarter last year
- Backlog: $5.8 billion at quarter end, down 22% year on year
- Market Capitalization: $31.61 billion
Stuart Miller, Executive Chairman and Co-Chief Executive Officer of Lennar, said, "We are pleased to report our 2025 first quarter results that were both constructive and strategic for Lennar. During the quarter, we continued to focus on our strategy of matching production pace with sales pace and maintaining even flow production. Additionally, during the quarter we distributed shares of Millrose Properties, Inc. ("Millrose") to our shareholders, furthering our asset-light strategy."
Company Overview
One of the largest homebuilders in America, Lennar (NYSE: LEN) is known for constructing affordable, move-up, and retirement homes across a range of markets and communities.
Home Builders
Traditionally, homebuilders have built competitive advantages with economies of scale that lead to advantaged purchasing and brand recognition among consumers. Aesthetic trends have always been important in the space, but more recently, energy efficiency and conservation are driving innovation. However, these companies are still at the whim of the macro, specifically interest rates that heavily impact new and existing home sales. In fact, homebuilders are one of the most cyclical subsectors within industrials.
Sales Growth
A company’s long-term sales performance is one signal of its overall quality. Any business can put up a good quarter or two, but the best consistently grow over the long haul. Luckily, Lennar’s sales grew at a solid 9.3% compounded annual growth rate over the last five years. Its growth beat the average industrials company and shows its offerings resonate with customers.
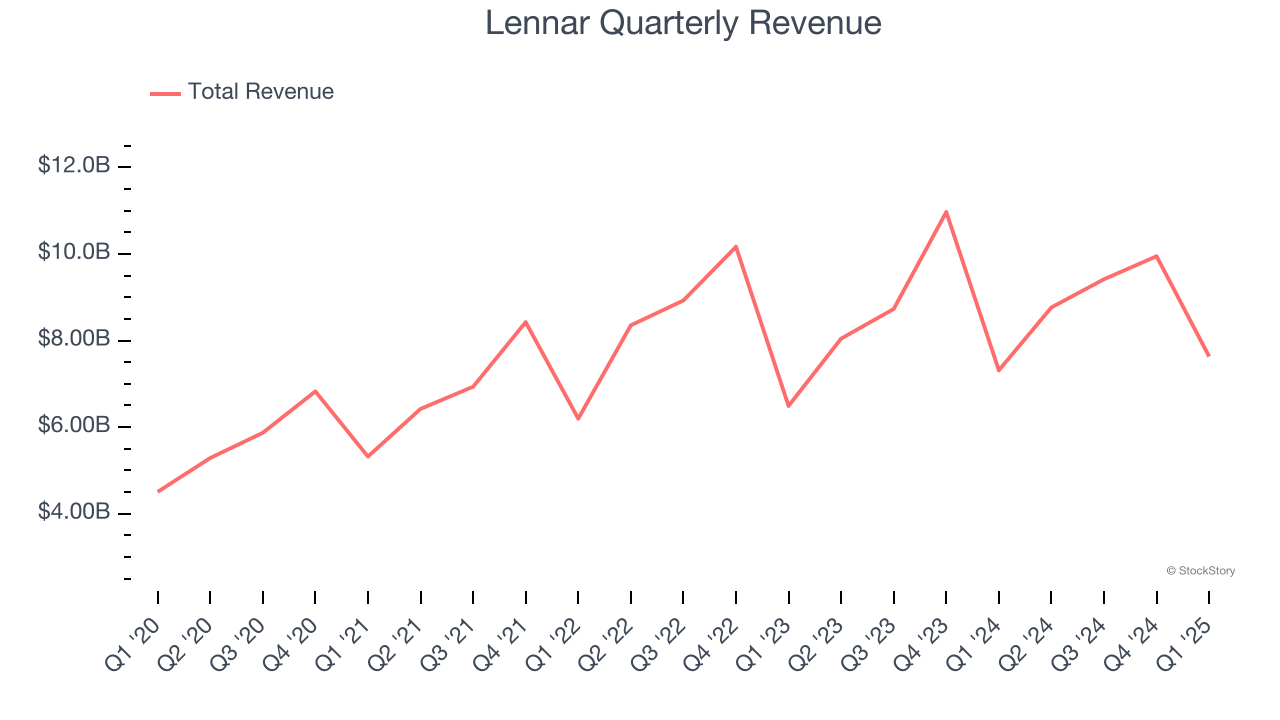
Long-term growth is the most important, but within industrials, a half-decade historical view may miss new industry trends or demand cycles. Lennar’s recent history shows its demand has slowed as its annualized revenue growth of 2.7% over the last two years was below its five-year trend. 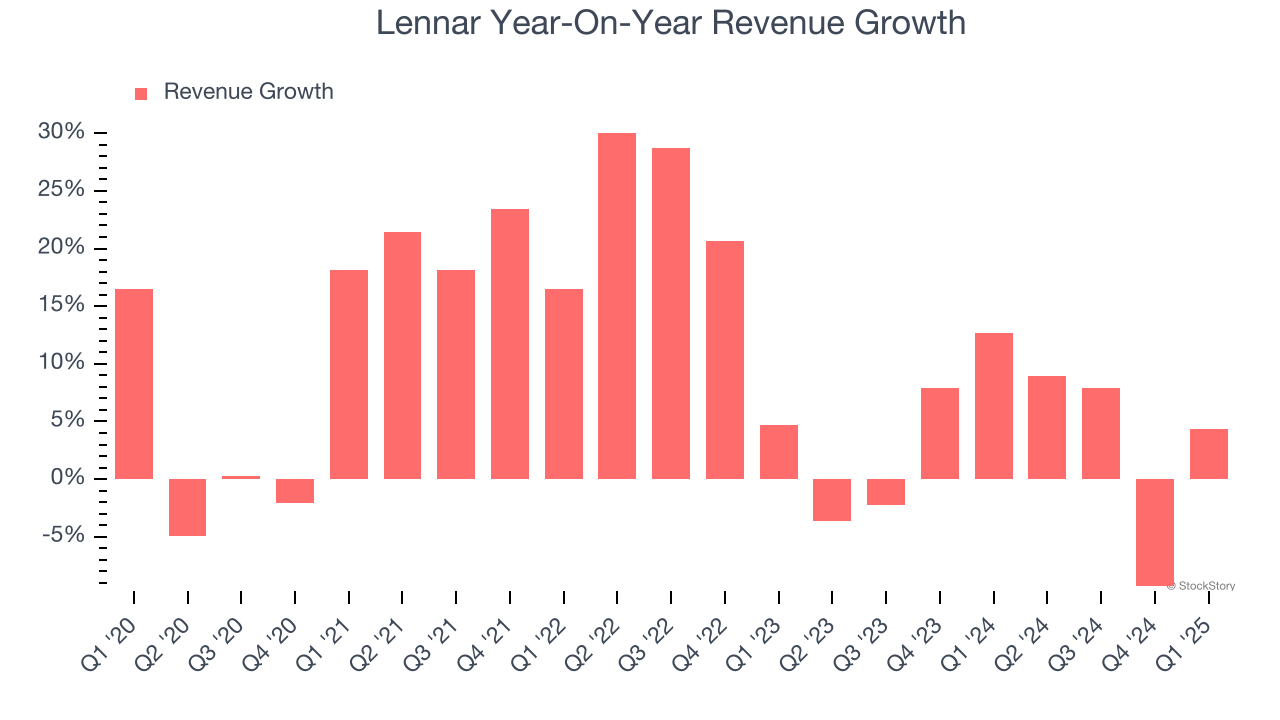
We can dig further into the company’s revenue dynamics by analyzing its backlog, or the value of its outstanding orders that have not yet been executed or delivered. Lennar’s backlog reached $5.8 billion in the latest quarter and averaged 22.1% year-on-year declines over the last two years. Because this number is lower than its revenue growth, we can see the company hasn’t secured enough new orders to maintain its growth rate in the future. 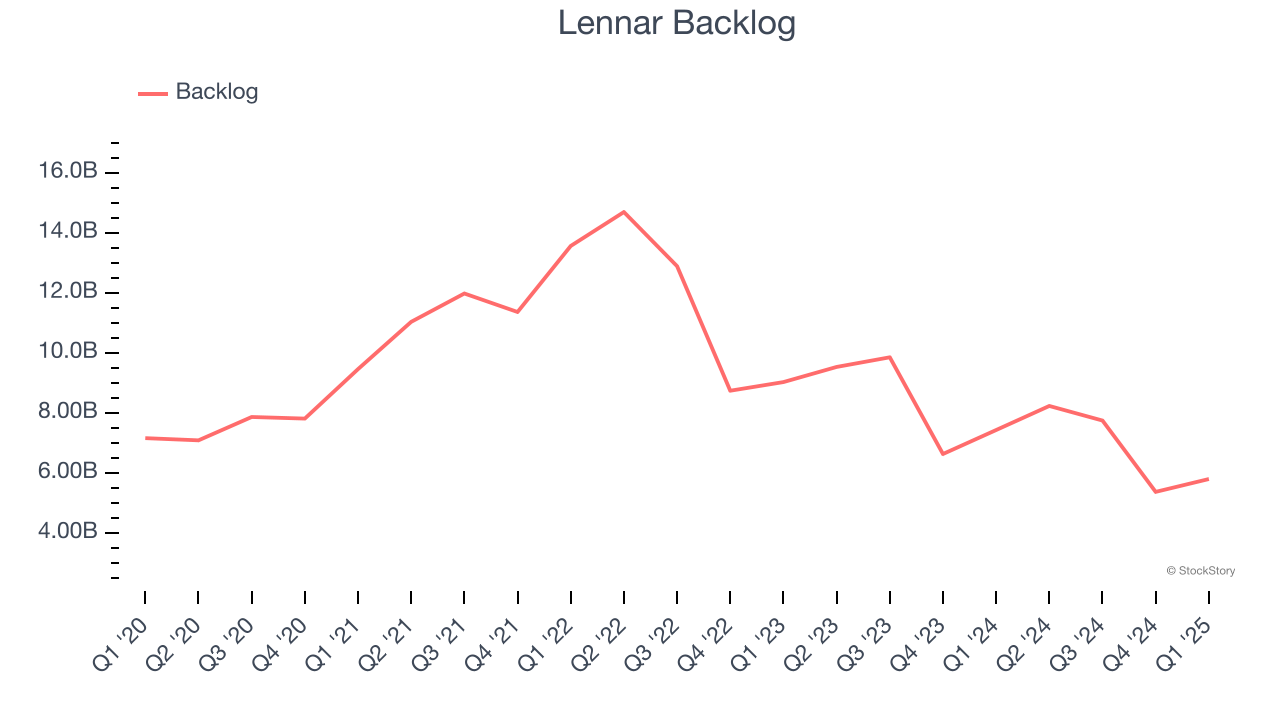
This quarter, Lennar reported modest year-on-year revenue growth of 4.4% but beat Wall Street’s estimates by 2%.
Looking ahead, sell-side analysts expect revenue to grow 4.6% over the next 12 months. While this projection suggests its newer products and services will fuel better top-line performance, it is still below the sector average.
Today’s young investors won’t have read the timeless lessons in Gorilla Game: Picking Winners In High Technology because it was written more than 20 years ago when Microsoft and Apple were first establishing their supremacy. But if we apply the same principles, then enterprise software stocks leveraging their own generative AI capabilities may well be the Gorillas of the future. So, in that spirit, we are excited to present our Special Free Report on a profitable, fast-growing enterprise software stock that is already riding the automation wave and looking to catch the generative AI next.
Operating Margin
Lennar has been a well-oiled machine over the last five years. It demonstrated elite profitability for an industrials business, boasting an average operating margin of 16.2%. This result was particularly impressive because of its low gross margin, which is mostly a factor of what it sells and takes huge shifts to move meaningfully. Companies have more control over their operating margins, and it’s a show of well-managed operations if they’re high when gross margins are low.
Looking at the trend in its profitability, Lennar’s operating margin decreased by 2.3 percentage points over the last five years. This raises questions about the company’s expense base because its revenue growth should have given it leverage on its fixed costs, resulting in better economies of scale and profitability.
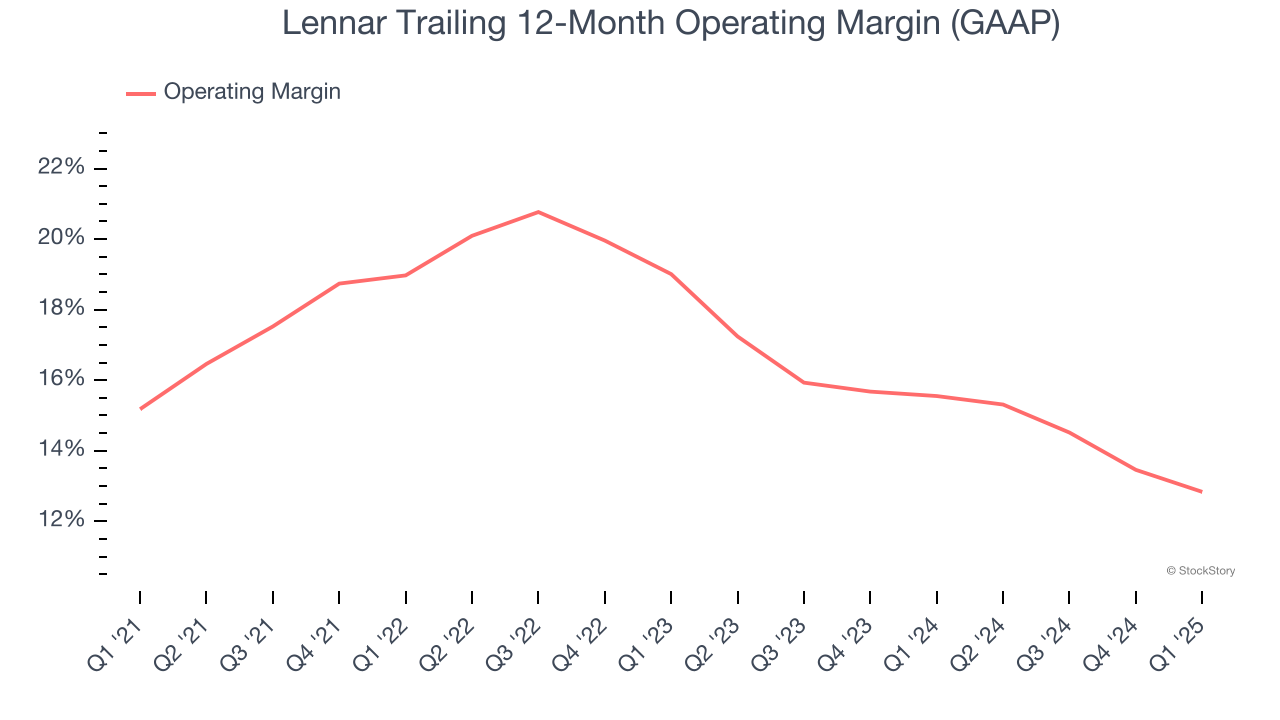
This quarter, Lennar generated an operating profit margin of 9.4%, down 2.9 percentage points year on year. Since Lennar’s operating margin decreased more than its gross margin, we can assume it was less efficient because expenses such as marketing, R&D, and administrative overhead increased.
Earnings Per Share
Revenue trends explain a company’s historical growth, but the long-term change in earnings per share (EPS) points to the profitability of that growth – for example, a company could inflate its sales through excessive spending on advertising and promotions.
Lennar’s EPS grew at a spectacular 16.9% compounded annual growth rate over the last five years, higher than its 9.3% annualized revenue growth. However, this alone doesn’t tell us much about its business quality because its operating margin didn’t expand.
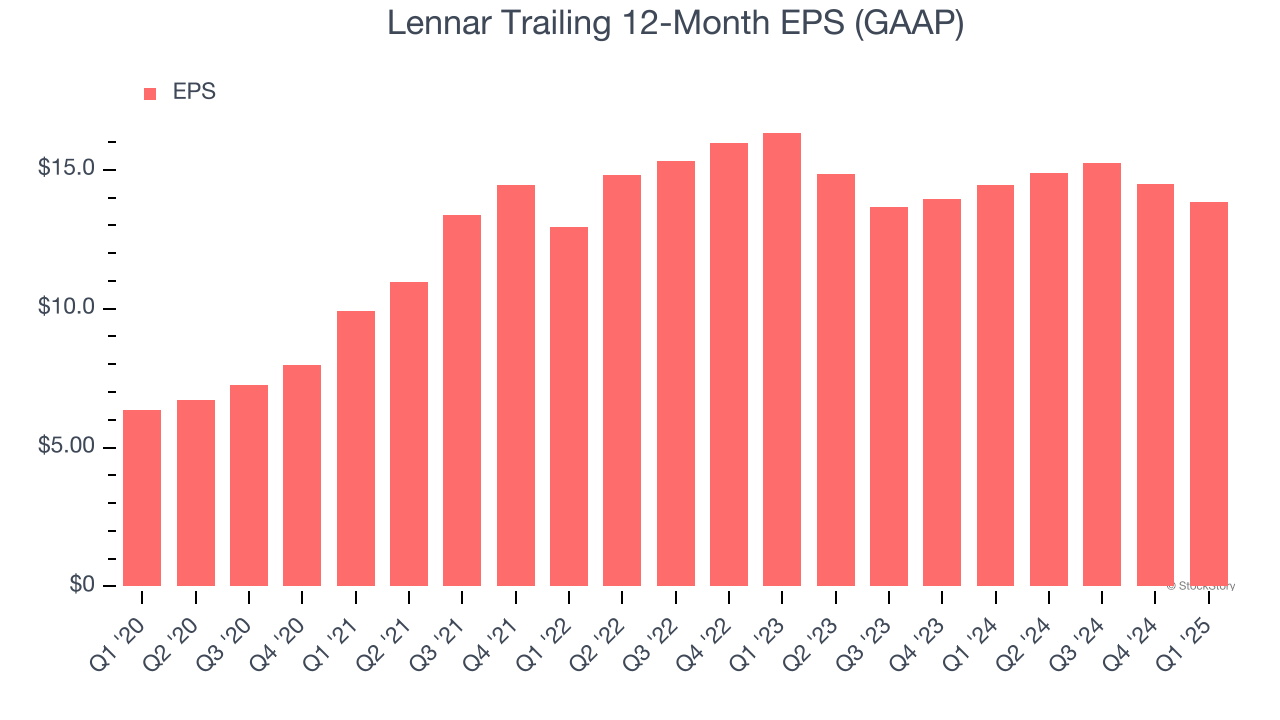
We can take a deeper look into Lennar’s earnings quality to better understand the drivers of its performance. A five-year view shows that Lennar has repurchased its stock, shrinking its share count by 15.6%. This tells us its EPS outperformed its revenue not because of increased operational efficiency but financial engineering, as buybacks boost per share earnings. 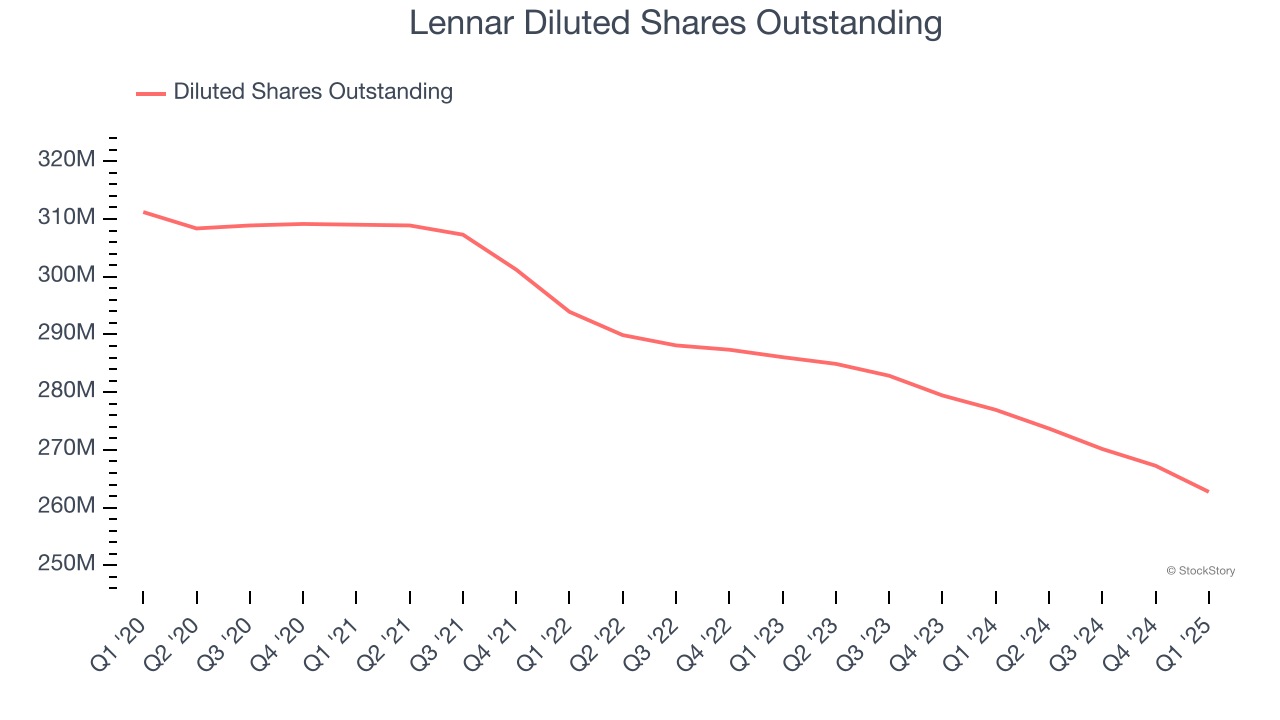
Like with revenue, we analyze EPS over a shorter period to see if we are missing a change in the business.
For Lennar, its two-year annual EPS declines of 7.9% mark a reversal from its (seemingly) healthy five-year trend. We hope Lennar can return to earnings growth in the future.
In Q1, Lennar reported EPS at $1.96, down from $2.60 in the same quarter last year. Despite falling year on year, this print easily cleared analysts’ estimates. Over the next 12 months, Wall Street expects Lennar’s full-year EPS of $13.85 to shrink by 8.2%.
Key Takeaways from Lennar’s Q1 Results
We enjoyed seeing Lennar beat analysts’ revenue expectations this quarter. We were also glad its EPS outperformed Wall Street’s estimates. On the other hand, its backlog missed. Zooming out, we think this was a decent quarter featuring some areas of strength but also some blemishes. The areas below expectations seem to be driving the move, and the stock traded down 2.9% to $116.60 immediately following the results.
Is Lennar an attractive investment opportunity at the current price? The latest quarter does matter, but not nearly as much as longer-term fundamentals and valuation, when deciding if the stock is a buy. We cover that in our actionable full research report which you can read here, it’s free.


