


Security and aerospace company Northrop Grumman (NYSE: NOC) fell short of the market’s revenue expectations in Q3 CY2025 as sales rose 4.3% year on year to $10.42 billion. The company’s full-year revenue guidance of $41.8 billion at the midpoint came in 0.9% below analysts’ estimates. Its GAAP profit of $7.67 per share was 18.7% above analysts’ consensus estimates.
Is now the time to buy Northrop Grumman? Find out by accessing our full research report, it’s free for active Edge members.
Northrop Grumman (NOC) Q3 CY2025 Highlights:
- Revenue: $10.42 billion vs analyst estimates of $10.72 billion (4.3% year-on-year growth, 2.7% miss)
- EPS (GAAP): $7.67 vs analyst estimates of $6.46 (18.7% beat)
- Adjusted EBITDA: $1.22 billion vs analyst estimates of $1.52 billion (11.7% margin, 19.9% miss)
- The company dropped its revenue guidance for the full year to $41.8 billion at the midpoint from $42.15 billion, a 0.8% decrease
- Operating Margin: 11.9%, in line with the same quarter last year
- Free Cash Flow Margin: 12.1%, up from 7.3% in the same quarter last year
- Backlog: $91.45 billion at quarter end, up 7.6% year on year
- Market Capitalization: $86.2 billion
Company Overview
Responsible for the development of the first stealth bomber, Northrop Grumman (NYSE: NOC) specializes in providing aerospace, defense, and security solutions for various industry applications.
Revenue Growth
A company’s long-term sales performance is one signal of its overall quality. Any business can experience short-term success, but top-performing ones enjoy sustained growth for years. Regrettably, Northrop Grumman’s sales grew at a sluggish 3% compounded annual growth rate over the last five years. This was below our standards and is a rough starting point for our analysis.
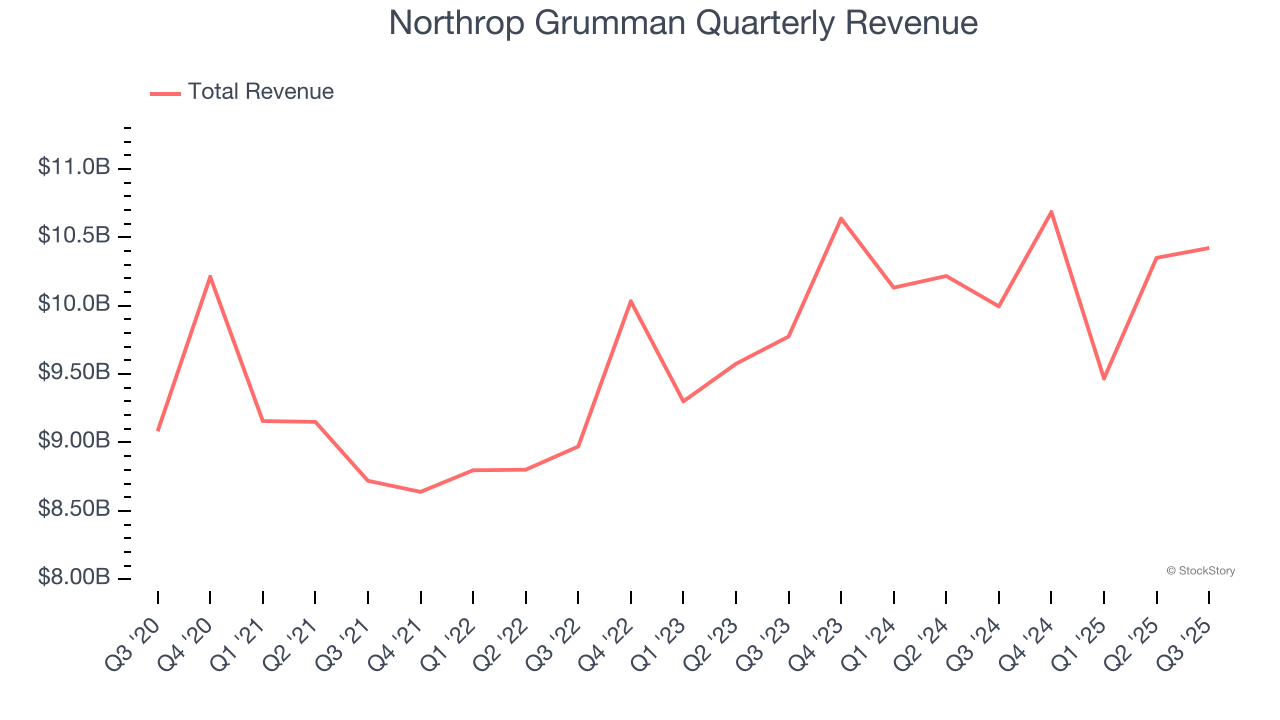
Long-term growth is the most important, but within industrials, a half-decade historical view may miss new industry trends or demand cycles. Northrop Grumman’s annualized revenue growth of 2.9% over the last two years aligns with its five-year trend, suggesting its demand was consistently weak. 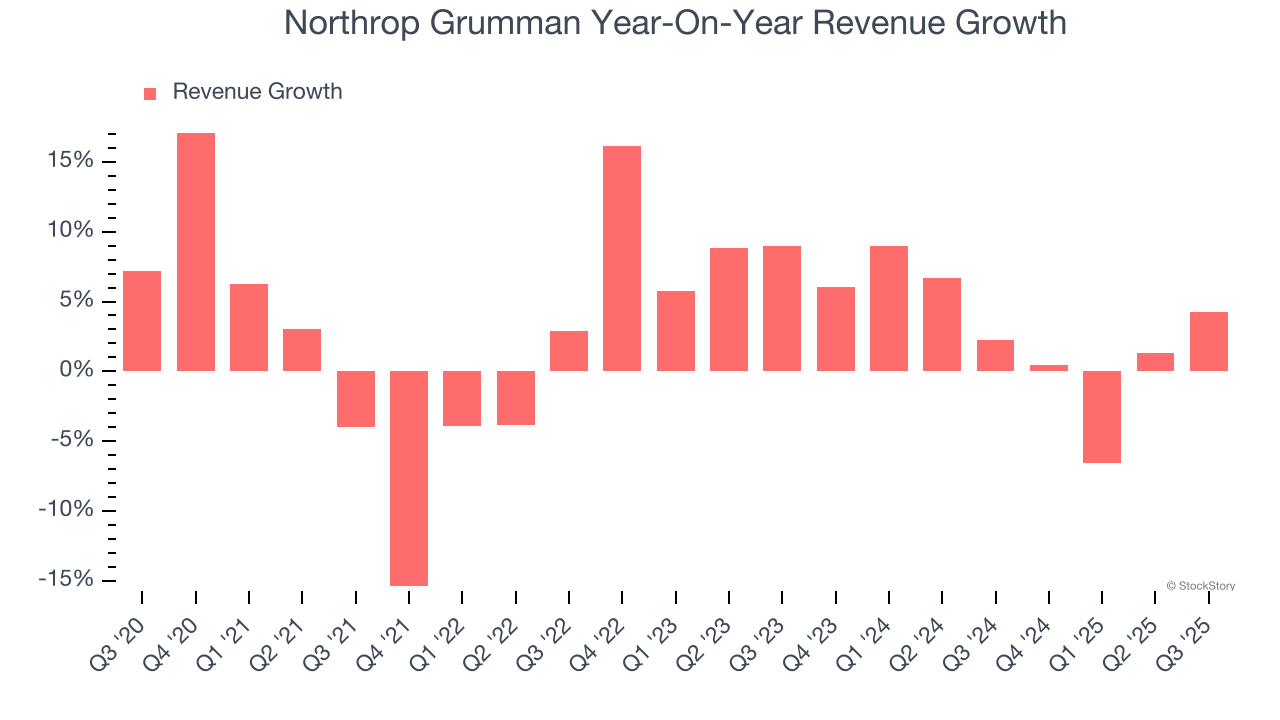
We can better understand the company’s revenue dynamics by analyzing its backlog, or the value of its outstanding orders that have not yet been executed or delivered. Northrop Grumman’s backlog reached $91.45 billion in the latest quarter and averaged 7.6% year-on-year growth over the last two years. Because this number is better than its revenue growth, we can see the company accumulated more orders than it could fulfill and deferred revenue to the future. This could imply elevated demand for Northrop Grumman’s products and services but raises concerns about capacity constraints. 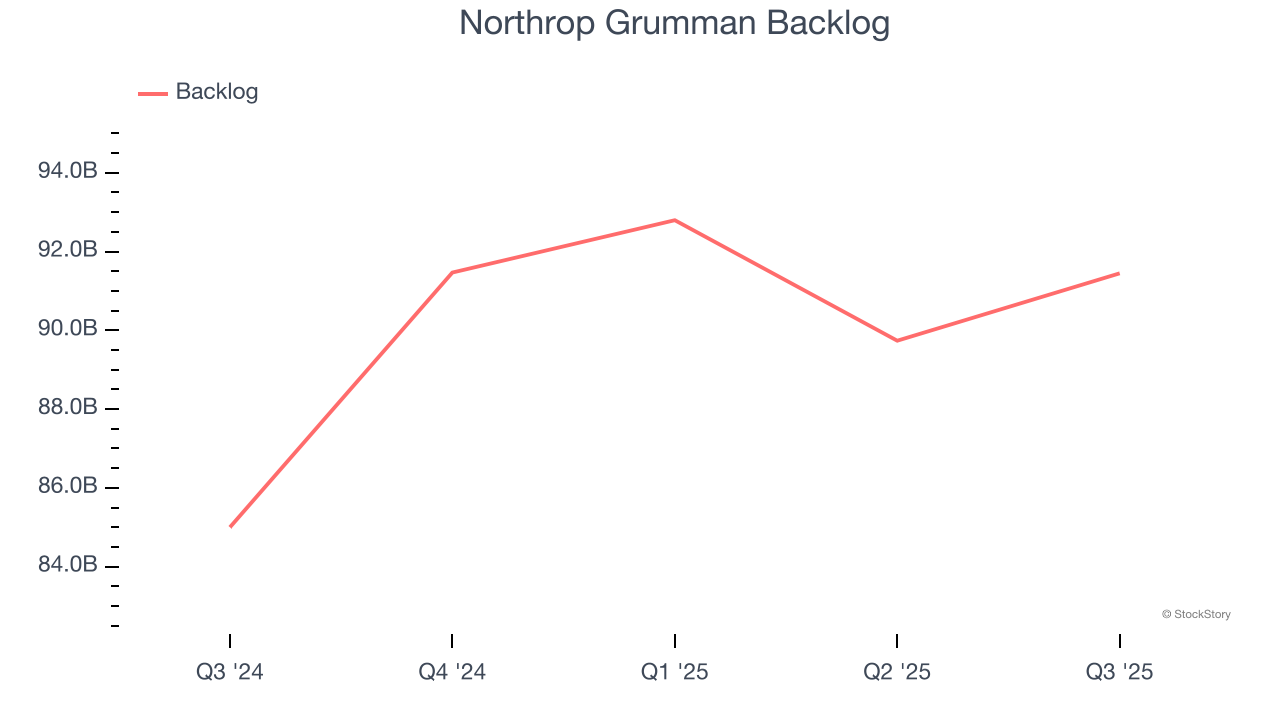
This quarter, Northrop Grumman’s revenue grew by 4.3% year on year to $10.42 billion, falling short of Wall Street’s estimates.
Looking ahead, sell-side analysts expect revenue to grow 7.2% over the next 12 months. Although this projection suggests its newer products and services will spur better top-line performance, it is still below the sector average.
Software is eating the world and there is virtually no industry left that has been untouched by it. That drives increasing demand for tools helping software developers do their jobs, whether it be monitoring critical cloud infrastructure, integrating audio and video functionality, or ensuring smooth content streaming. Click here to access a free report on our 3 favorite stocks to play this generational megatrend.
Operating Margin
Operating margin is an important measure of profitability as it shows the portion of revenue left after accounting for all core expenses – everything from the cost of goods sold to advertising and wages. It’s also useful for comparing profitability across companies with different levels of debt and tax rates because it excludes interest and taxes.
Northrop Grumman has managed its cost base well over the last five years. It demonstrated solid profitability for an industrials business, producing an average operating margin of 10.6%.
Analyzing the trend in its profitability, Northrop Grumman’s operating margin decreased by 5.7 percentage points over the last five years. This raises questions about the company’s expense base because its revenue growth should have given it leverage on its fixed costs, resulting in better economies of scale and profitability.
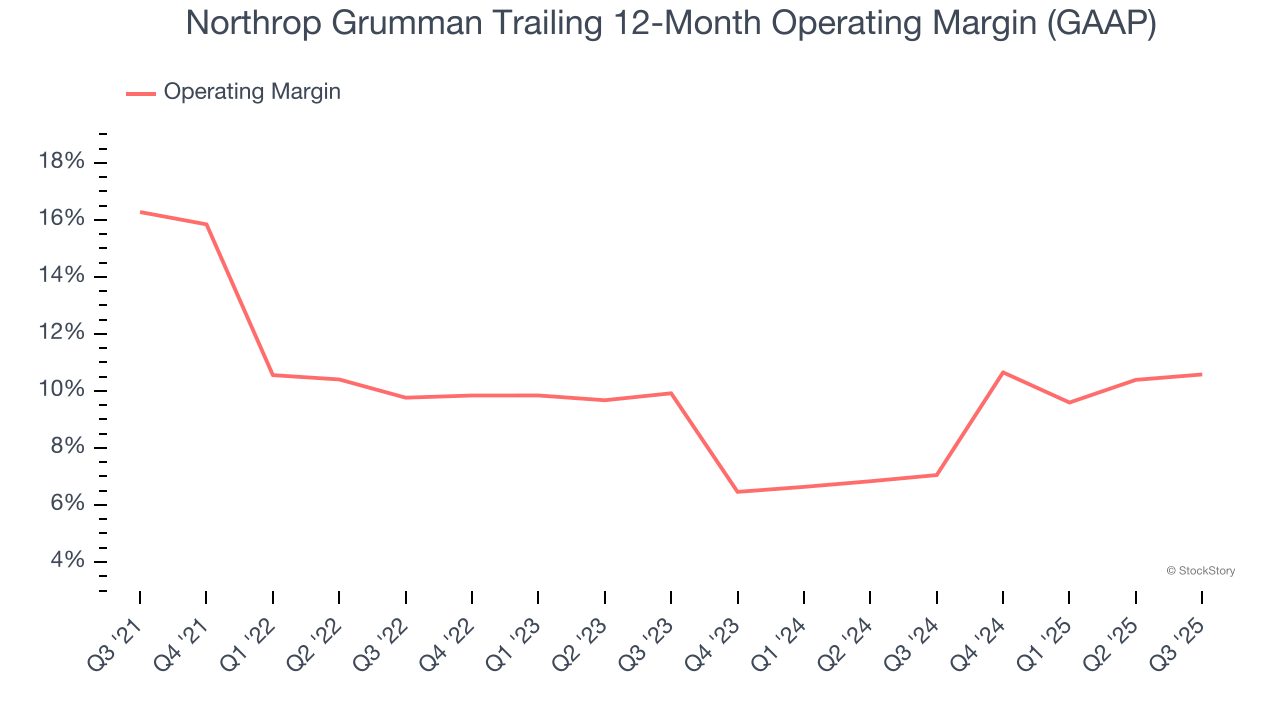
In Q3, Northrop Grumman generated an operating margin profit margin of 11.9%, in line with the same quarter last year. This indicates the company’s overall cost structure has been relatively stable.
Earnings Per Share
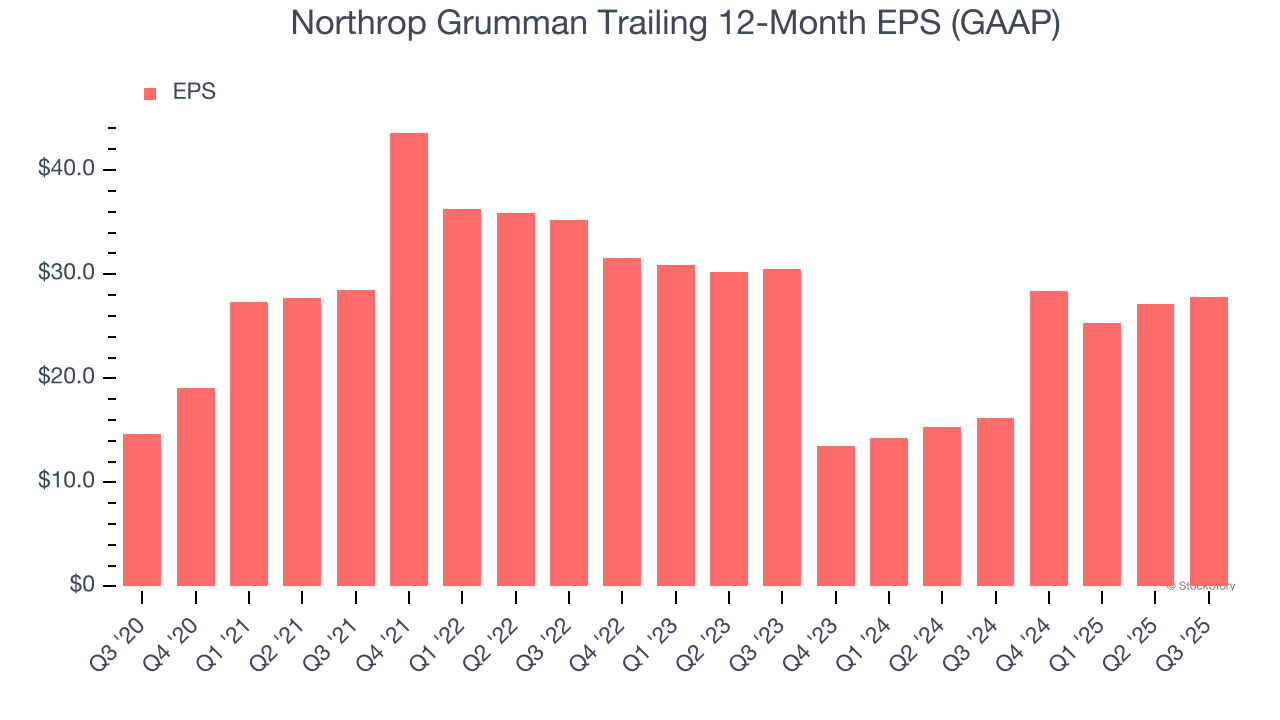
We track the long-term change in earnings per share (EPS) for the same reason as long-term revenue growth. Compared to revenue, however, EPS highlights whether a company’s growth is profitable.
Northrop Grumman’s EPS grew at a remarkable 13.7% compounded annual growth rate over the last five years, higher than its 3% annualized revenue growth. This tells us the company became more profitable on a per-share basis as it expanded.
Diving into the nuances of Northrop Grumman’s earnings can give us a better understanding of its performance. A five-year view shows that Northrop Grumman has repurchased its stock, shrinking its share count by 14.2%. This tells us its EPS outperformed its revenue not because of increased operational efficiency but financial engineering, as buybacks boost per share earnings. 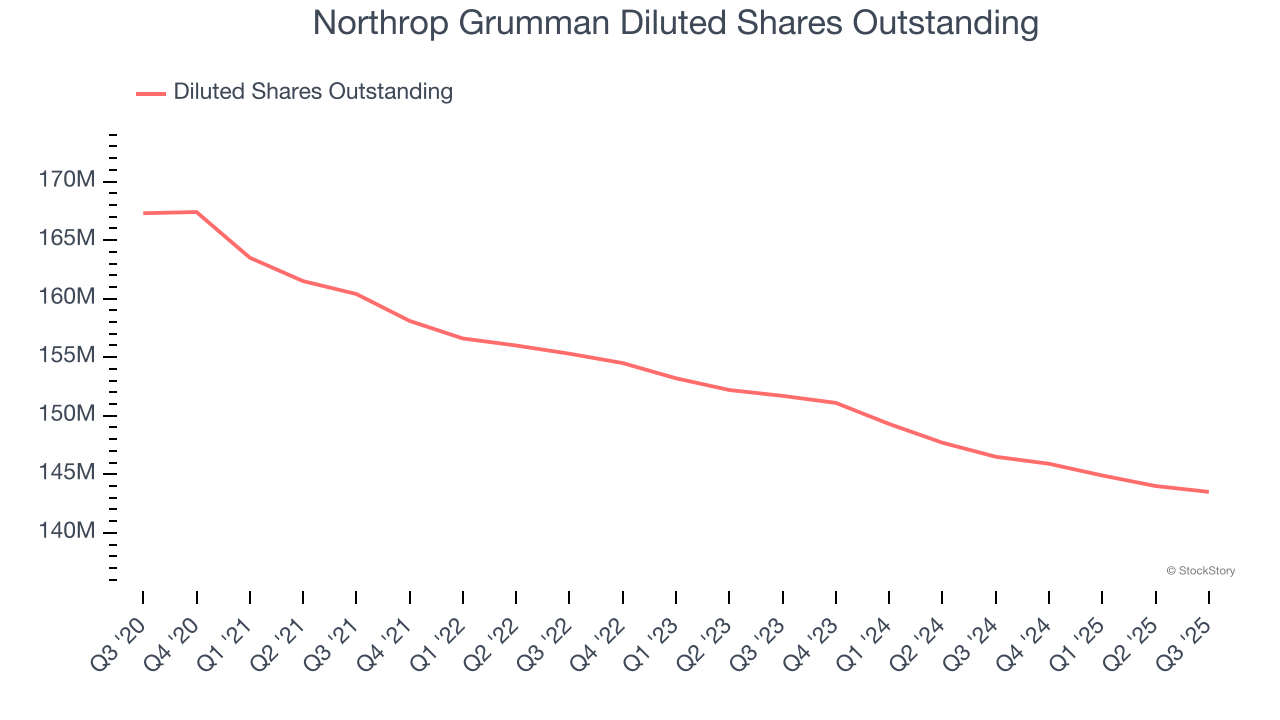
Like with revenue, we analyze EPS over a more recent period because it can provide insight into an emerging theme or development for the business.
For Northrop Grumman, its two-year annual EPS declines of 4.5% mark a reversal from its (seemingly) healthy five-year trend. We hope Northrop Grumman can return to earnings growth in the future.
In Q3, Northrop Grumman reported EPS of $7.67, up from $7.00 in the same quarter last year. This print easily cleared analysts’ estimates, and shareholders should be content with the results. Over the next 12 months, Wall Street expects Northrop Grumman’s full-year EPS of $27.81 to grow 1.8%.
Key Takeaways from Northrop Grumman’s Q3 Results
It was good to see Northrop Grumman beat analysts’ EPS expectations this quarter. On the other hand, its revenue missed and its EBITDA fell short of Wall Street’s estimates. Overall, this was a softer quarter. The stock traded down 2.1% to $590 immediately following the results.
Northrop Grumman underperformed this quarter, but does that create an opportunity to invest right now? When making that decision, it’s important to consider its valuation, business qualities, as well as what has happened in the latest quarter. We cover that in our actionable full research report which you can read here, it’s free for active Edge members.


