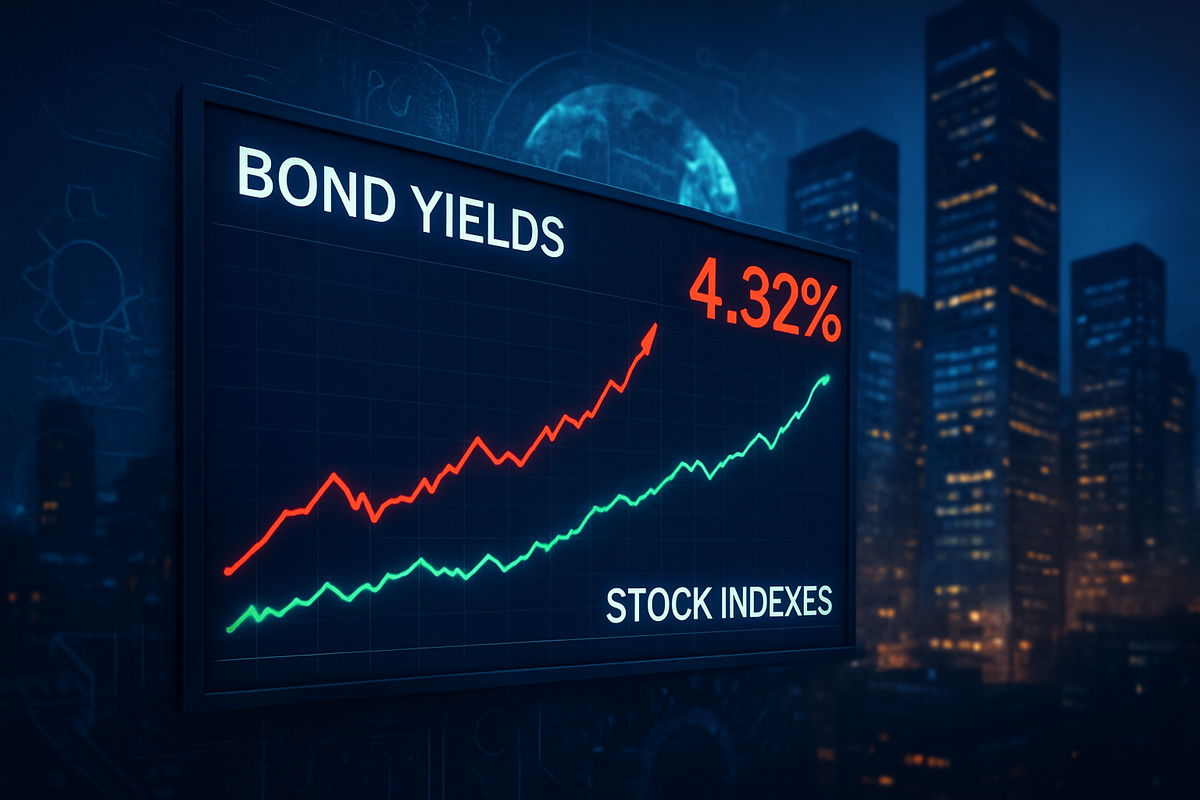
The financial markets reached a startling crossroads on April 6, 2026, as the traditional correlation between bonds and equities appeared to break. While the 10-year Treasury yield surged to a multi-year high of 4.32%, fueled by persistent "sticky" cost-push inflation, the stock market refused to follow the standard script of a deep sell-off. This decoupling represents a major shift in investor psychology, moving away from a world dictated by Federal Reserve interest rate projections and toward one driven by corporate resilience and the tangible implementation of artificial intelligence.
The surge in yields, which peaked intraday at 4.35%, was triggered by a series of supply-side shocks that have made inflation far more difficult to tame than the demand-pull pressures of the early 2020s. Despite these headwinds, major equity indexes showed remarkable stability during the first week of April, as market participants increasingly view high-quality stocks as a safer harbor for capital than long-dated government debt.
The Yield Rebellion: A Timeline of the 4.32% Surge
The path to 4.32% began in mid-January 2026, when the 10-year Treasury yield sat at a relatively comfortable 3.9%. The narrative shifted in late February following a major military escalation in the Middle East, known as "Operation Epic Fury," which disrupted shipping through the Strait of Hormuz. This geopolitical crisis sent U.S. crude oil prices soaring above $110 per barrel, creating a direct cost-push inflationary spike that central banks cannot easily suppress with rate hikes alone.
By March, economic data confirmed that inflation was becoming "sticky." The Core PCE report showed a 3.1% annual increase, while the March jobs report revealed a surprising 178,000 new positions—nearly triple the consensus forecast. This data suggested that despite higher rates, the economy was not cooling fast enough to justify the rate cuts many had expected. Bondholders began a mass exodus, driving prices down and yields up. On April 6, the 10-year Treasury yield reached its critical 4.32% threshold, signaling to the market that "higher-for-longer" is no longer a warning, but a reality.
While the bond market was in turmoil, the equity market's reaction was uncharacteristically muted. After a sharp 10% correction earlier in the first quarter, the S&P 500 began a "bear market rally" in early April. Analysts at Bank of America (NYSE: BAC) noted that this decoupling is a sign that investors are now prioritizing "fortress balance sheets" and companies that can grow earnings faster than the rising cost of capital.
Winners and Losers in the New Yield Regime
In this high-yield environment, the market has begun to separate the "yield-resistant" leaders from those crippled by debt. NVIDIA Corporation (NASDAQ: NVDA) has emerged as a primary beneficiary of this trend. Despite the discount rate pressure from a 4.32% yield, NVIDIA has maintained its valuation due to triple-digit revenue growth and its dominance in the "Blackwell" and "Hopper" AI architectures. Investors are treating NVDA as a growth powerhouse that can outpace inflation, effectively making it "yield-immune."
The financial sector has also seen a divergence. Asset-sensitive banks like Live Oak Bancshares, Inc. (NASDAQ: LOB) and Atlantic Union Bankshares Corporation (NYSE: AUB) are seeing upward earnings revisions as they benefit from higher net interest margins. Conversely, the fixed income sector is suffering significantly, with the iShares 20+ Year Treasury Bond ETF (NASDAQ: TLT) hitting new lows as long-duration assets are re-priced.
In the real estate sector, the high yield environment has created a "quality divide." Realty Income Corporation (NYSE: O) has managed to play offense, using its strong credit rating to raise capital and retire high-cost debt even as yields climb. However, smaller, more leveraged REITs are struggling as their weighted average cost of debt creeps toward 6%, narrowing the spread on property investments. Similarly, Microsoft Corporation (NASDAQ: MSFT), which suffered a brutal start to 2026, has begun to stabilize by pivoting its narrative from "AI growth" to "AI-enabled cost-cutting," a strategy designed to preserve margins against rising inflationary costs.
The Shift from Speculation to Implementation
The current decoupling is not just a statistical anomaly; it fits into a broader industry trend where the market is shifting from "AI speculation" to "AI implementation." In 2024 and 2025, tech stocks rose on the promise of future earnings. In 2026, the market is rewarding companies that are using AI to tangibly reduce labor and energy costs—the two biggest drivers of cost-push inflation. This shift allows equities to remain resilient even when bond yields suggest a more restrictive environment.
Historically, this decoupling mirrors the late 1990s, where productivity gains from the early internet era allowed stocks to perform well despite rising rates. However, the current "sticky" inflation presents a different challenge. Unlike demand-pull inflation, cost-push inflation is driven by supply chain constraints and energy costs, which are less sensitive to Fed policy. This has left the Federal Reserve in a difficult position, as further rate hikes could risk a deep recession without necessarily bringing down the price of oil or goods.
The ripple effects are also being felt in the regulatory sphere. Policy makers are increasingly looking at energy independence and supply chain domesticity as the primary tools for inflation control, rather than just monetary policy. This shift is likely to benefit companies in the energy sector, such as Exxon Mobil Corporation (NYSE: XOM), which serve as a natural hedge against the very costs that are driving yields higher.
Looking Ahead: The 4.50% Danger Zone
In the short term, the market will be hyper-focused on whether the 10-year Treasury yield can stay below the 4.50% mark. Many institutional analysts believe that 4.50% is a "breaking point" where the decoupling will end, and the high cost of capital will finally force a systemic de-risking event in the stock market. If yields break this level, we may see a transition from a "bear market rally" to a more sustained downward trend for the S&P 500.
Strategic pivots will be required for companies that have relied on cheap debt for expansion. We should expect to see a wave of "efficiency-first" corporate strategies, where share buybacks and dividends are deprioritized in favor of debt retirement and AI-driven automation. For investors, the coming months will offer a test of the "AI implementation" thesis. If corporate earnings for Q1 2026 show that AI is indeed protecting margins, the decoupling could continue throughout the summer.
Market opportunities will likely emerge in "all-weather" sectors that can pass through costs to consumers. However, the challenge remains the "lagged effect" of the 2025 tariffs and the ongoing energy crisis. A scenario where energy prices stabilize could see a rapid "re-coupling" where yields fall and stocks surge, but current geopolitical tensions suggest that a "higher-for-longer" environment is the more probable outcome through the end of the year.
Summary and Final Assessment
The events of early April 2026 have redefined the relationship between the bond and stock markets. The climb to a 4.32% 10-year yield is a sobering reminder that "sticky" inflation is a formidable opponent for the economy. Yet, the resilience of the equity market suggests that investors have found a new North Star in corporate productivity and AI integration.
Moving forward, the market is no longer a monolithic entity that moves inversely to interest rates. Instead, it has become a fragmented landscape where "fortress balance sheets" thrive and high-debt entities face existential threats. The key takeaway for investors is that the "Fed-watching" era may be giving way to an "earnings-watching" era, where a company's ability to navigate supply-side shocks is more important than the discount rate applied to its future cash flows.
In the coming months, watch for the 4.50% yield threshold and the next Core PCE report. These will be the ultimate indicators of whether the current decoupling is a permanent structural shift or a temporary divergence before a larger market correction.
This content is intended for informational purposes only and is not financial advice.