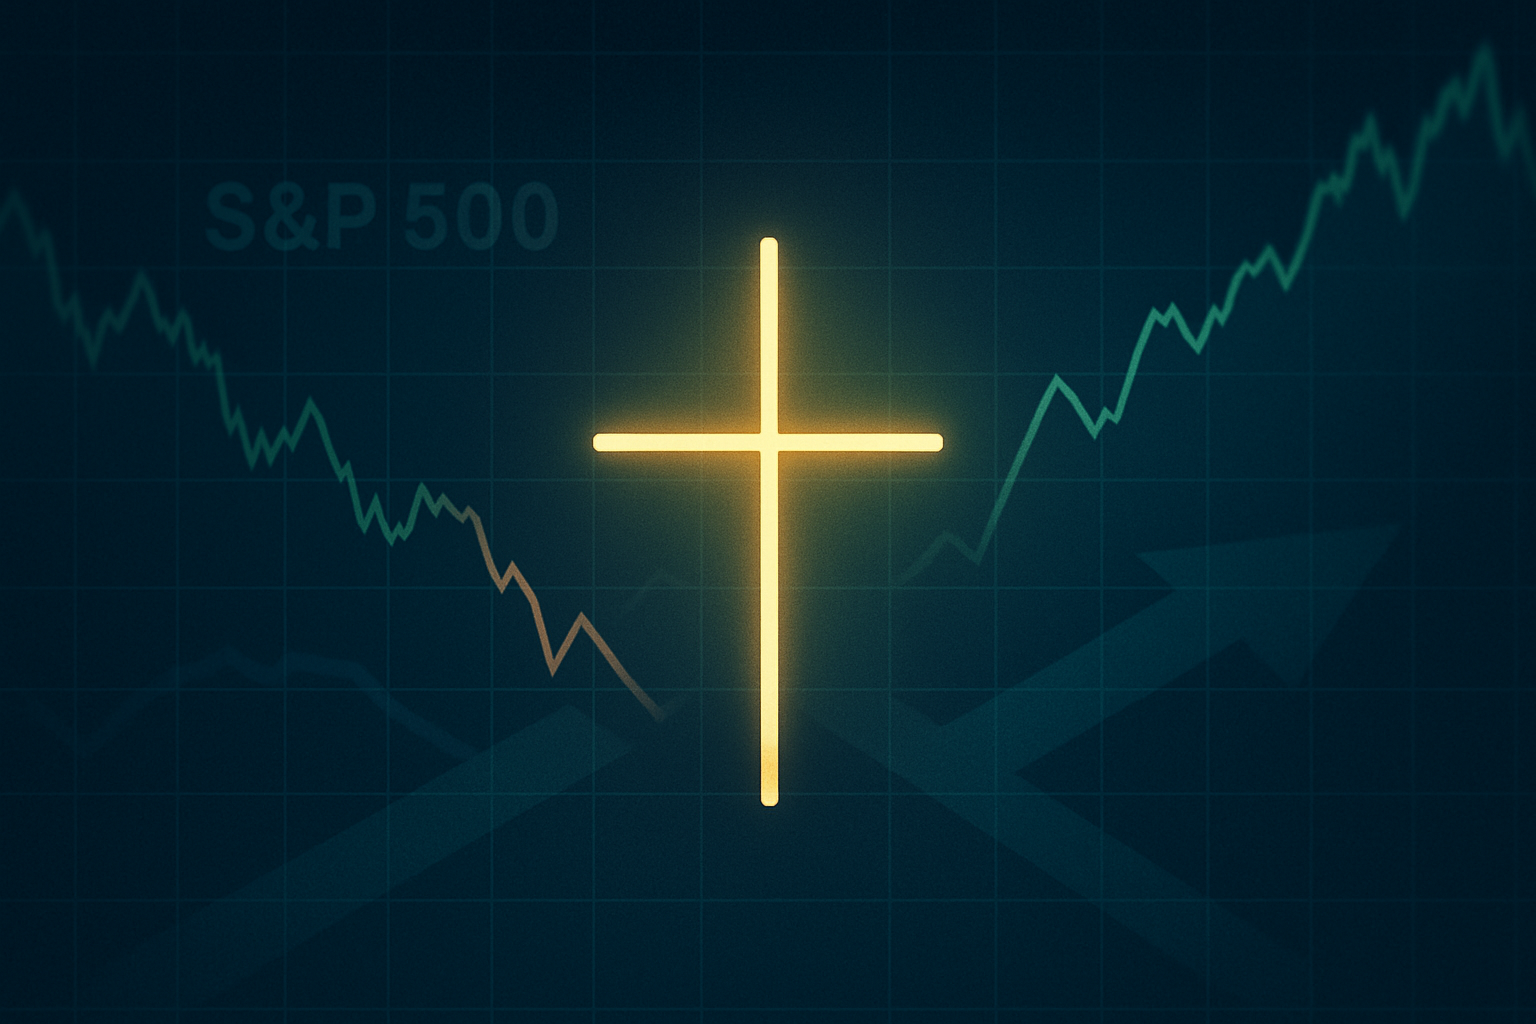
The financial world is abuzz with recent technical signals from the S&P 500 (INDEXSP:.INX), specifically the appearance of a "Doji candle" on its charts. This seemingly innocuous candlestick pattern, often resembling a cross or plus sign, carries significant weight for market analysts and investors alike. It signals a moment of profound indecision, where the powerful forces of buying and selling have reached a rare equilibrium, leaving the market at a critical juncture.
For the uninitiated, a Doji candle forms when the S&P 500's opening and closing prices for a given period are nearly identical, despite potential dramatic price swings throughout the day. This visual cue suggests that neither bulls nor bears could gain a decisive upper hand, leading to a stalemate. While a Doji itself is a neutral indicator, its appearance, particularly after a sustained trend, often acts as a yellow flag, prompting market participants to brace for a potential shift in direction or a period of heightened volatility. As of September 29, 2025, the market is scrutinizing this signal, pondering its implications for the days and weeks ahead.
A Standoff on the Charts: Decoding the S&P 500's Doji Print
The S&P 500 recently printed a notable Doji candle on its daily chart, specifically observed in late September 2025. This particular Doji was characterized by a very small real body, indicating that the index opened and closed at or very near the same price point. The presence of both upper and lower shadows, or "wicks," signifies that while prices fluctuated considerably throughout the trading session—reaching both higher highs and lower lows—they ultimately returned to the starting point by the close. This pattern emerged after a period of significant market movement, intensifying its perceived importance among technical analysts.
Leading up to this moment, the S&P 500 had experienced a volatile September, marked by fluctuating investor sentiment driven by a mix of inflation concerns, interest rate speculation, and mixed corporate earnings reports. The Doji's appearance suggests a pause in the prevailing trend, whatever it may have been, indicating that the conviction behind recent price movements has waned. Key players involved in interpreting and reacting to this signal include institutional investors, hedge fund managers, retail traders, and financial analysts who rely on technical indicators to gauge market health and predict future movements.
Initial market reactions to the Doji have been cautious. While not a definitive reversal signal on its own, it has spurred a wave of commentary and analysis, with many experts advising increased vigilance. The immediate aftermath has seen a slight uptick in volatility as traders attempt to ascertain the market's next move. Some interpret it as a sign of exhaustion in the current trend, while others view it as a mere pause before a continuation. The lack of a clear directional bias following the Doji underscores the indecision it represents, leading to a "wait-and-see" approach from many market participants. This specific Doji, appearing in late September 2025, has put the market on alert for potential short-term support level tests or a renewed push in either direction, depending on subsequent trading activity.
Corporate Crossroads: How Market Indecision Ripples Through Public Companies
While a Doji candle on the S&P 500 (INDEXSP:.INX) doesn't directly impact individual companies in the way a merger or an earnings report would, the market indecision it signifies creates an environment where certain public companies might find themselves more vulnerable or, conversely, more resilient. The overall sentiment shift implied by a Doji can influence investor appetite for risk, thereby affecting different sectors and companies disproportionately.
Companies with high growth potential but currently unprofitable, often found in the technology (NASDAQ: QQQ) or biotechnology sectors, tend to be more sensitive to shifts in market sentiment. During periods of indecision or potential reversal, investors often become more risk-averse, pulling capital from speculative ventures and reallocating it to more stable, established companies. This could lead to increased selling pressure on high-beta stocks, impacting their valuations. Conversely, large-cap, stable companies with consistent earnings and strong balance sheets, such as those in the consumer staples (NYSEARCA: XLP) or utilities (NYSEARCA: XLU) sectors, might experience increased investor interest as a safe haven during uncertain times.
Furthermore, companies that are heavily reliant on consumer confidence or discretionary spending, like those in the retail (NYSEARCA: XRT) or travel industries, could face headwinds if the Doji presages a broader market downturn or prolonged uncertainty. A hesitant market can lead to hesitant consumers, impacting sales and revenue forecasts. On the other hand, companies providing essential services or those with strong competitive moats and pricing power may be better positioned to weather potential volatility. Investors will be closely watching the performance of bellwether stocks like Apple (NASDAQ: AAPL), Microsoft (NASDAQ: MSFT), and Amazon (NASDAQ: AMZN) as indicators of overall market health, as any significant movement in these giants can sway the entire index.
Beyond the Candlestick: Wider Implications of Market Indecision
The appearance of a Doji candle on the S&P 500 (INDEXSP:.INX) transcends mere chart analysis; it signals a broader shift in market psychology that can have far-reaching implications. This moment of indecision fits into a larger narrative of increasing market complexity and sensitivity to macroeconomic factors. In recent years, markets have been grappling with persistent inflation, the trajectory of interest rates set by central banks like the U.S. Federal Reserve, and geopolitical tensions. A Doji, in this context, suggests that investors are struggling to reconcile these diverse and often conflicting signals, leading to a temporary paralysis in conviction.
The ripple effects of such indecision can be felt across various financial instruments and sectors. Other major indices, such as the Dow Jones Industrial Average (INDEXDJX:.DJI) and the NASDAQ Composite (INDEXCOMP:.IXIC), often mirror the S&P 500's sentiment, suggesting that a broad-based "wait-and-see" approach might permeate the entire equity market. Beyond equities, bond markets may see increased demand for safe-haven assets like U.S. Treasuries, potentially driving yields lower, while commodity markets could experience heightened volatility as traders speculate on future economic growth. Regulatory bodies and policymakers, while not directly reacting to a single technical indicator, pay close attention to prolonged periods of market uncertainty, as it can be a precursor to broader economic instability, potentially influencing future policy decisions related to market oversight or economic stimulus.
Historically, Doji candles have often appeared at pivotal moments. For instance, similar patterns have preceded significant market reversals during the dot-com bubble burst of the early 2000s and the lead-up to the 2008 financial crisis. While not every Doji leads to a dramatic reversal, these historical precedents serve as cautionary tales, reminding investors that periods of equilibrium can often be the calm before a significant storm or a powerful new trend. The key takeaway from history is that confirmation from subsequent price action is crucial; a Doji merely sets the stage for what could be a significant turning point, demanding heightened attention from all market participants.
What Comes Next: Navigating the Crossroads
The S&P 500's (INDEXSP:.INX) Doji candle, a clear signal of market indecision, sets the stage for several potential scenarios in the short and long term. In the immediate future, the market is likely to exhibit increased choppiness and volatility as buyers and sellers battle for dominance. Short-term possibilities include a period of consolidation, where the index trades within a tight range as it digests recent movements, or a decisive breakout in either direction. A strong bullish candle following the Doji could signal a continuation of an uptrend or the start of a new one if it appeared after a downtrend. Conversely, a bearish candle would likely confirm a reversal, leading to further declines.
From a long-term perspective, the Doji could represent a critical inflection point, potentially marking the end of a multi-month trend or the beginning of a new one. This requires investors and strategists to consider potential strategic pivots. Those with significant long positions might consider tightening stop-losses or hedging their portfolios, while those looking to enter the market might await clearer directional signals before committing substantial capital. Market opportunities could emerge for nimble traders who can capitalize on increased volatility, while long-term investors might find opportunities to rebalance their portfolios, rotating out of overvalued assets and into those with stronger fundamentals that can withstand potential market turbulence.
Potential scenarios range from a swift resolution of indecision, leading to a confirmed trend reversal, to a prolonged period of sideways trading as the market awaits fresh catalysts. For instance, if the Doji was printed after a strong rally, a bearish reversal could lead to a significant correction, impacting portfolios heavily weighted in growth stocks. If it appeared after a decline, a bullish reversal could spark a new rally. The coming weeks will be crucial, with investors closely monitoring economic data, corporate earnings, and geopolitical developments for any clues that might tip the scales in favor of either bulls or bears.
The Doji's Lingering Shadow: A Market Watcher's Guide
The recent Doji candle on the S&P 500 (INDEXSP:.INX) serves as a potent reminder that even in the most dynamic financial markets, periods of equilibrium and uncertainty are inevitable. The key takeaway from this technical print is not a definitive prediction, but rather a strong signal for increased vigilance and a recognition that the market is at a crossroads. It highlights the delicate balance between buying and selling pressures, suggesting that the momentum of the prevailing trend has, at least temporarily, stalled.
Moving forward, the market's trajectory will largely depend on the price action that immediately follows this period of indecision. A decisive move in either direction, confirmed by subsequent strong candles, will provide much-needed clarity. Investors should assess the market's response to upcoming economic reports, central bank announcements, and corporate earnings releases, as these fundamental factors will ultimately dictate whether the Doji marks a temporary pause, a significant reversal, or a continuation of the existing trend.
In conclusion, while the Doji candle itself is neutral, its appearance in late September 2025 has cast a lingering shadow of uncertainty over the S&P 500. It underscores the importance of technical analysis in understanding market psychology and potential shifts. Investors should watch for confirmation signals, pay close attention to volume trends, and consider diversifying their portfolios to mitigate risks associated with potential increased volatility. The coming months will reveal whether this Doji was merely a fleeting moment of contemplation or a harbinger of a more significant change in the market's direction.
This content is intended for informational purposes only and is not financial advice