


The New York Times Company (NYSE: NYT) announced today third-quarter 2020 diluted earnings per share from continuing operations of $.20 compared with $.10 in the same period of 2019. Adjusted diluted earnings per share from continuing operations (defined below) was $.22 in the third quarter of 2020 compared with $.12 in the third quarter of 2019.
This press release features multimedia. View the full release here: https://www.businesswire.com/news/home/20201105005201/en/
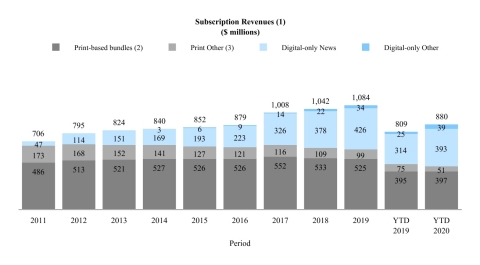
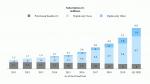
We believe that the significant growth over the last several years in subscriptions to our products demonstrates the success of our “subscription-first” strategy and the willingness of our readers to pay for high-quality journalism. The following charts illustrate the acceleration in net digital-only subscription additions and corresponding subscription revenues as well as the relative stability of our print domestic home delivery subscription products since the launch of the digital pay model in 2011. (1) Amounts may not add due to rounding. (2) Print domestic home delivery subscriptions include free access to some or all of our digital products. (3) Print Other includes single-copy, NYT International and other subscription revenues. Note: Revenues for 2012 and 2017 include the impact of an additional week. (Graphic: Business Wire)
Operating profit increased to $39.6 million in the third quarter of 2020 from $25.1 million in the same period of 2019 and adjusted operating profit (defined below) increased to $56.5 million from $44.1 million in the prior year, as higher digital-only subscription revenues and lower costs more than offset lower advertising revenues.
Meredith Kopit Levien, president and chief executive officer, The New York Times Company, said, “In this unprecedented moment in the country and the world, our strategy of making journalism worth paying for continues to prove itself out, and our newsroom’s extraordinary work across a range of subjects and formats continues to drive more people to engage with The Times, form a habit, pay and stay.
“For the second quarter running, total digital revenue exceeded print revenue. And for the first time, total digital-only subscription revenue exceeded print subscription revenue, making digital-only subscriptions not just the central engine of the Company’s growth, but on its way to being our largest revenue stream.
“We ended the quarter with approximately 6.9 million total subscriptions, and crossed the 7 million mark in the month of October, an increase of two million digital-only subscriptions over the last year and 393,000 over the last quarter. The news cycle certainly played a role, but as we are increasingly seeing with each passing quarter, so too did the breadth of our coverage and our improving ability to mean more to more people. The continued demand for quality, original, independent journalism across a range of topics makes us even more optimistic about the size of the total market for digital journalism subscriptions and our position in it.”
Comparisons
Unless otherwise noted, all comparisons are for the third quarter of 2020 to the third quarter of 2019.
This release presents certain non-GAAP financial measures, including diluted earnings per share from continuing operations excluding severance, non-operating retirement costs and special items (or adjusted diluted earnings per share from continuing operations); operating profit before depreciation, amortization, severance, multiemployer pension plan withdrawal costs and special items (or adjusted operating profit); and operating costs before depreciation, amortization, severance and multiemployer pension plan withdrawal costs (or adjusted operating costs). Refer to Reconciliation of Non-GAAP Information in the exhibits for a discussion of management’s reasons for the presentation of these non-GAAP financial measures and reconciliations to the most comparable GAAP financial measures.
The Company changed the expense captions on its Condensed Consolidated Statement of Operations effective for the first quarter of 2020. These changes were made in order to reflect how the Company manages its business and to communicate where the Company is investing resources and how this aligns with the Company’s strategy. The Company reclassified expenses for the prior period in order to present comparable financial results. Refer to Reconciliation of GAAP Information in the exhibits for more details.
There were no special items in the third quarter of 2020.
Third-quarter 2019 results included the following special items:
• A $4.0 million charge ($3.0 million after tax or $.02 per share) from restructuring charges, including impairment and severance charges related to the closure of our digital marketing agency HelloSociety, LLC.
• A $2.0 million gain ($1.5 million after tax or $.01 per share) from a multiemployer pension plan liability adjustment.
Results from Continuing Operations
Revenues
Total revenues for the third quarter of 2020 decreased 0.4 percent to $426.9 million from $428.5 million in the third quarter of 2019. Subscription revenues increased 12.6 percent to $301.0 million, advertising revenues decreased 30.2 percent to $79.3 million and other revenues decreased 2.0 percent to $46.7 million.
Subscription revenues in the third quarter of 2020 rose due to growth in the number of subscriptions to the Company’s digital-only products, which include our news product, as well as our Cooking, Games (previously Crossword) and audio products. Revenue from digital-only products increased 34.0 percent, to $155.3 million. Print subscription revenues decreased 3.8 percent to $145.7 million largely due to lower retail newsstand revenue, while revenue from our domestic home delivery subscription products grew 2.5 percent.
The Company ended the third quarter of 2020 with approximately 6,894,000 subscriptions across its print and digital products. Paid digital-only subscriptions totaled approximately 6,063,000, a net increase of 393,000 subscriptions compared with the end of the second quarter of 2020 and a net increase of 2,010,000 subscriptions compared with the end of the third quarter of 2019. Of the 393,000 total net additions, 275,000 came from the Company’s digital news product, while 118,000 came from the Company’s Cooking, Games and audio products.
Third-quarter digital advertising revenue decreased 12.6 percent, while print advertising revenue decreased 46.5 percent. Digital advertising revenue was $47.8 million, or 60.3 percent of total Company advertising revenues, compared with $54.7 million, or 48.1 percent, in the third quarter of 2019. Digital advertising revenue decreased primarily as a result of lower creative services revenues. Print advertising revenue decreased as the COVID-19 pandemic further accelerated secular trends, largely impacting the luxury, entertainment, media and home furnishings categories.
Other revenues decreased 2.0 percent in the third quarter primarily as a result of fewer television episodes as well as lower revenues from commercial printing and live events. These declines were partially offset by higher revenues from licensing revenue related to Facebook News and affiliate referrals from Wirecutter.
Operating Costs
Total operating costs decreased 3.5 percent in the third quarter of 2020 to $387.3 million compared with $401.5 million in the third quarter of 2019, while adjusted operating costs decreased 3.7 percent to $370.4 million from $384.4 million in the third quarter of 2019 as a result of the factors discussed below.
Cost of revenue decreased 3.8 percent to $235.9 million compared with $245.1 million in the third quarter of 2019, largely due to lower print production and distribution and advertising servicing costs, which were partially offset by higher digital content delivery and journalism costs.
Sales and marketing costs decreased 21.2 percent to $50.6 million compared with $64.2 million in the third quarter of 2019, due primarily to lower media expenses, as well as lower advertising sales costs. Media expenses, a component of sales and marketing costs that represents the cost to promote our subscription business, decreased to $27.3 million in the third quarter of 2020 from $35.9 million in 2019. The Company expects media expenses to return to pre-pandemic levels in subsequent quarters.
Product development costs increased 27.9 percent to $34.1 million compared with $26.7 million in the third quarter of 2019, largely due to growth in the number of digital product development employees in connection with digital subscription strategic initiatives.
General and administrative costs increased 2.2 percent to $51.1 million compared with $50.0 million in the third quarter of 2019.
Other Data
Interest Income and Other, net
Interest income/(expense) and other, net increased in the third quarter of 2020 to $3.5 million income compared with an expense of $0.8 million in the third quarter of 2019 primarily as a result of the repurchase of the condo interest in our headquarters building in December 2019, which eliminated our outstanding debt.
Income Taxes
The Company had income tax expense of $7.3 million in the third quarter of 2020 compared with $6.1 million in the third quarter of 2019. The effective income tax rate was 17.8 percent in the third quarter of 2020 and 27.0 percent in the third quarter of 2019. The effective income tax rate for the third quarter of 2020 was lower than the statutory tax rate primarily due to a tax benefit from stock price appreciation on stock-based awards that settled in the quarter.
Liquidity
As of September 27, 2020, the Company had cash and marketable securities of $800.1 million, an increase from $683.9 million as of December 29, 2019.
The Company has a $250.0 million revolving line of credit through 2024. As of September 27, 2020, there were no outstanding borrowings under the credit facility, and the Company did not have other outstanding debt obligations.
Capital Expenditures
Capital expenditures totaled approximately $8 million in the third quarter of 2020 compared with approximately $9 million in the third quarter of 2019. The decrease in capital expenditures in the third quarter of 2020 was primarily driven by lower expenditures related to the build out of additional office space in Long Island City, NY.
Outlook
Total subscription revenues in the fourth quarter of 2020 are expected to increase approximately 14 percent compared with the fourth quarter of 2019, with digital-only subscription revenue expected to increase approximately 35 percent.
Total advertising revenues in the fourth quarter of 2020 are expected to decline approximately 30 percent compared with the fourth quarter of 2019, with digital advertising revenue expected to decrease in the mid-teens, largely due to the impact from the COVID-19 pandemic.
Other revenues in the fourth quarter of 2020 are expected to decrease approximately 15 percent compared with the fourth quarter of 2019 as a result of fewer television episodes and lower revenues from live events.
Operating costs and adjusted operating costs in the fourth quarter of 2020 are expected to be flat or to decrease in the low single digits compared with the fourth quarter of 2019 as the Company defers non-essential spending while continuing to invest in the drivers of digital subscription growth.
The Company expects the following on a pre-tax basis in 2020:
- Depreciation and amortization: approximately $61 million,
- Interest income and other, net: $20 million to $22 million, and
- Capital expenditures: approximately $40 million.
Our outlook is based on our current knowledge and assumptions and could be impacted by the evolving COVID-19 pandemic.
Conference Call Information
The Company’s third-quarter 2020 earnings conference call will be held on Thursday, November 5, at 8:00 a.m. E.T.
Participants can pre-register for the telephone conference at dpregister.com/sreg/10148448/da1254bf20, which will generate dial-in instructions allowing participants to bypass an operator at the time of the call. Alternatively, to access the call without pre-registration, dial 844-413-3940 (in the U.S.) or 412-858-5208 (international callers). Online listeners can link to the live webcast at investors.nytco.com.
An archive of the webcast will be available beginning about two hours after the call at investors.nytco.com. The archive will be available for approximately three months. An audio replay will be available at 877-344-7529 (in the U.S.) and 412-317-0088 (international callers) beginning approximately two hours after the call until 11:59 p.m. E.T. on Thursday, November 19. The replay access code is 10148448.
Except for the historical information contained herein, the matters discussed in this press release are forward-looking statements that involve risks and uncertainties, and actual results could differ materially from those predicted by such forward-looking statements. These risks and uncertainties include the impact of the COVID-19 pandemic, changes in the business and competitive environment in which the Company operates, the impact of national and local economic and other conditions and developments in technology, each of which could influence the levels (rate and volume) of the Company’s subscriptions and advertising, the growth of its businesses and the implementation of its strategic initiatives. They also include other risks detailed from time to time in the Company’s publicly filed documents, including the Company’s Annual Report on Form 10-K for the year ended December 29, 2019, as updated in subsequent Quarterly Reports on Form 10-Q. The impact of the COVID-19 pandemic, which has already affected the Company, may also exacerbate these risks, any of which could have a material effect on the Company. This situation is changing rapidly and additional impacts may arise that the Company is not aware of currently. The Company undertakes no obligation to publicly update or revise any forward-looking statement, whether as a result of new information, future events or otherwise.
The New York Times Company is a global media organization dedicated to enhancing society by creating, collecting and distributing high-quality news and information. The Company includes The New York Times, NYTimes.com and related properties. It is known globally for excellence in its journalism, and innovation in its print and digital storytelling and its business model. Follow news about the company at @NYTimesPR.
Exhibits: | Condensed Consolidated Statements of Operations |
Footnotes | |
Reconciliation of Non-GAAP Information |
This press release can be downloaded from www.nytco.com
| THE NEW YORK TIMES COMPANY | ||||||||||||||||||||
CONDENSED CONSOLIDATED STATEMENTS OF OPERATIONS | ||||||||||||||||||||
(Dollars and shares in thousands, except per share data) | ||||||||||||||||||||
Third Quarter | Nine Months | |||||||||||||||||||
2020 | 2019 | % Change | 2020 | 2019 | % Change | |||||||||||||||
Revenues | ||||||||||||||||||||
Subscription(a) | $ | 300,950 | $ | 267,302 | 12.6% | $ | 879,573 | $ | 808,568 | 8.8% | ||||||||||
Advertising(b) | 79,253 | 113,531 | (30.2)% | 253,150 | 359,380 | (29.6)% | ||||||||||||||
Other(c) | 46,692 | 47,668 | (2.0)% | 141,558 | 135,873 | 4.2% | ||||||||||||||
Total revenues | 426,895 | 428,501 | (0.4)% | 1,274,281 | 1,303,821 | (2.3)% | ||||||||||||||
Operating costs | ||||||||||||||||||||
Cost of revenue (excluding depreciation and amortization)(d) | 235,900 | 245,100 | (3.8)% | 709,719 | 729,654 | (2.7)% | ||||||||||||||
Sales and marketing(d) | 50,627 | 64,218 | (21.2)% | 164,040 | 201,327 | (18.5)% | ||||||||||||||
Product development(d) | 34,102 | 26,669 | 27.9% | 95,641 | 75,658 | 26.4% | ||||||||||||||
General and administrative(d) | 51,118 | 50,015 | 2.2% | 162,791 | 152,054 | 7.1% | ||||||||||||||
Depreciation and amortization | 15,552 | 15,450 | 0.7% | 46,368 | 45,548 | 1.8% | ||||||||||||||
Total operating costs | 387,299 | 401,452 | (3.5)% | 1,178,559 | 1,204,241 | (2.1)% | ||||||||||||||
Restructuring charge (e) | — | 4,008 | * | — | 4,008 | * | ||||||||||||||
Gain from pension liability adjustment(f) | — | (2,045) | * | — | (2,045) | * | ||||||||||||||
Operating profit | 39,596 | 25,086 | 57.8% | 95,722 | 97,617 | (1.9)% | ||||||||||||||
Other components of net periodic benefit costs | 2,272 | 1,834 | 23.9% | 6,735 | 5,502 | 22.4% | ||||||||||||||
Interest income/(expense) and other, net(g) | 3,537 | (755) | * | 20,177 | (3,572) | * | ||||||||||||||
Income from continuing operations before income taxes | 40,861 | 22,497 | 81.6% | 109,164 | 88,543 | 23.3% | ||||||||||||||
Income tax expense | 7,283 | 6,070 | 20.0% | 19,070 | 16,789 | 13.6% | ||||||||||||||
Net income | 33,578 | 16,427 | * | 90,094 | 71,754 | 25.6% | ||||||||||||||
Net income attributable to The New York Times Company common stockholders | $ | 33,578 | $ | 16,427 | * | $ | 90,094 | $ | 71,754 | 25.6% | ||||||||||
Average number of common shares outstanding: | ||||||||||||||||||||
Basic | 167,075 | 166,148 | 0.6% | 166,842 | 165,976 | 0.5% | ||||||||||||||
Diluted | 168,059 | 167,555 | 0.3% | 167,943 | 167,384 | 0.3% | ||||||||||||||
Basic earnings per share attributable to The New York Times Company common stockholders | $ | 0.20 | $ | 0.10 | * | $ | 0.54 | $ | 0.43 | 25.6% | ||||||||||
Diluted earnings per share attributable to The New York Times Company common stockholders | $ | 0.20 | $ | 0.10 | * | $ | 0.54 | $ | 0.43 | 25.6% | ||||||||||
Dividends declared per share | $ | 0.12 | $ | 0.05 | * | $ | 0.18 | $ | 0.15 | 20.0% | ||||||||||
* Represents a change equal to or in excess of 100% or not meaningful. | ||||||||||||||||||||
See footnotes pages for additional information. | ||||||||||||||||||||
THE NEW YORK TIMES COMPANY | |||||||||||||||||||||
FOOTNOTES | |||||||||||||||||||||
(Amounts in thousands) | |||||||||||||||||||||
(a) | The following table summarizes digital and print subscription revenues for the third quarters and first nine months of 2020 and 2019: | ||||||||||||||||||||
Third Quarter | Nine Months | ||||||||||||||||||||
2020 | 2019 | % Change | 2020 | 2019 | % Change | ||||||||||||||||
Digital-only subscription revenues: | |||||||||||||||||||||
News product subscription revenues(1) | $ | 140,740 | $ | 107,009 | 31.5% | $ | 392,620 | $ | 313,785 | 25.1% | |||||||||||
Other product subscription revenues(2) | 14,546 | 8,855 | 64.3% | 38,660 | 24,573 | 57.3% | |||||||||||||||
Subtotal digital-only subscription revenues | 155,286 | 115,864 | 34.0% | 431,280 | 338,358 | 27.5% | |||||||||||||||
Print subscription revenues: | |||||||||||||||||||||
Domestic home delivery subscription revenues(3) | 129,912 | 126,769 | 2.5% | 396,620 | 395,011 | 0.4% | |||||||||||||||
Single-copy, NYT International and other subscription revenues(4) | 15,752 | 24,669 | (36.1)% | 51,673 | 75,199 | (31.3)% | |||||||||||||||
Subtotal print subscription revenues | 145,664 | 151,438 | (3.8)% | 448,293 | 470,210 | (4.7)% | |||||||||||||||
Total subscription revenues | $ | 300,950 | $ | 267,302 | 12.6% | $ | 879,573 | $ | 808,568 | 8.8% | |||||||||||
(1) | Includes revenues from subscriptions to the Company’s news product. News product subscription packages that include access to the Company’s Games and Cooking products are also included in this category. | ||||||||||||||||||||
(2) | Includes revenues from standalone subscriptions to the Company’s Games, Cooking and audio products. | ||||||||||||||||||||
(3) | Includes free access to some or all of the Company’s digital products. | ||||||||||||||||||||
(4) | NYT International is the international edition of our print newspaper. | ||||||||||||||||||||
The following table summarizes digital and print subscriptions for the third quarters of 2020 and 2019: | |||||||||
Third Quarter | |||||||||
2020 | 2019 | % Change | |||||||
Digital-only subscriptions: | |||||||||
News product subscriptions(1) | 4,665 | 3,197 | 45.9% | ||||||
Other product subscriptions(2) | 1,398 | 856 | 63.3% | ||||||
Subtotal digital-only subscriptions | 6,063 | 4,053 | 49.6% | ||||||
Print subscriptions | 831 | 865 | (3.9)% | ||||||
Total subscriptions | 6,894 | 4,918 | 40.2% | ||||||
(1) | Includes subscriptions to the Company’s news product. News product subscription packages that include access to the Company’s Games and Cooking products are also included in this category. | ||||||||
(2) | Includes standalone subscriptions to the Company’s Games, Cooking and audio products. During the first quarter, the Company acquired a subscription-based audio product. Approximately 20,000 of the audio product’s subscriptions were included in the Company’s digital-only other product subscriptions at the time of acquisition. | ||||||||
THE NEW YORK TIMES COMPANY | ||||||||||||||||||||||
FOOTNOTES | ||||||||||||||||||||||
(Amounts in thousands) | ||||||||||||||||||||||
(b) | The following table summarizes digital and print advertising revenues for the third quarters and first nine months of 2020 and 2019: | |||||||||||||||||||||
Third Quarter | Nine Months | |||||||||||||||||||||
2020 | 2019 | % Change | 2020 | 2019 | % Change | |||||||||||||||||
Advertising revenues: | ||||||||||||||||||||||
Digital | $ | 47,763 | $ | 54,653 | (12.6)% | $ | 138,452 | $ | 168,222 | (17.7)% | ||||||||||||
31,490 | 58,878 | (46.5)% | 114,698 | 191,158 | (40.0)% | |||||||||||||||||
Total advertising | $ | 79,253 | $ | 113,531 | (30.2)% | $ | 253,150 | $ | 359,380 | (29.6)% | ||||||||||||
(c) | Other revenues primarily consist of revenues from licensing, affiliate referrals from Wirecutter, the leasing of floors in the Company headquarters, commercial printing, television and film, retail commerce and NYT Live (our live events business). | |||||||||||||||||||||
(d) | The Company changed the expense captions on its Condensed Consolidated Statement of Operations effective for the quarter ended March 29, 2020, and reclassified expenses for the prior period in order to present comparable financial results. There is no change to consolidated operating income, operating expense, net income or cash flows as a result of this change in classification. Refer to reconciliation information in the exhibits for a discussion of management’s reasons for the presentation change and reconciliations from the previously disclosed amounts to the recast amounts. | |||||||||||||||||||||
(e) | In the third quarter of 2019, the Company recognized $4.0 million of pre-tax expense related to restructuring charges, including impairment and severance charges related to the closure of our digital marketing agency, HelloSociety, LLC. | |||||||||||||||||||||
(f) | In the third quarter of 2019, the Company recorded a gain of $2.0 million from a multiemployer pension plan liability adjustment. | |||||||||||||||||||||
(g) | In the first quarter of 2020, the Company recorded a $10.1 million gain ($7.4 million or $.04 per share after tax) related to a non-marketable equity investment transaction. The gain is comprised of a $2.5 million realized gain due to the partial sale of the investment and an $7.6 million unrealized gain due to the mark to market of the remaining investment. | |||||||||||||||||||||
THE NEW YORK TIMES COMPANY |
RECONCILIATION OF NON-GAAP INFORMATION |
In this release, the Company has referred to non-GAAP financial information with respect to diluted earnings per share from continuing operations excluding severance, non-operating retirement costs and special items (or adjusted diluted earnings per share from continuing operations); operating profit before depreciation, amortization, severance, multiemployer pension plan withdrawal costs and special items (or adjusted operating profit); and operating costs before depreciation, amortization, severance and multiemployer pension withdrawal costs (or adjusted operating costs). The Company has included these non-GAAP financial measures because management reviews them on a regular basis and uses them to evaluate and manage the performance of the Company’s operations. Management believes that, for the reasons outlined below, these non-GAAP financial measures provide useful information to investors as a supplement to reported diluted earnings/(loss) per share from continuing operations, operating profit/(loss) and operating costs. However, these measures should be evaluated only in conjunction with the comparable GAAP financial measures and should not be viewed as alternative or superior measures of GAAP results.
Adjusted diluted earnings per share provides useful information in evaluating the Company’s period-to-period performance because it eliminates items that the Company does not consider to be indicative of earnings from ongoing operating activities. Adjusted operating profit is useful in evaluating the ongoing performance of the Company’s business as it excludes the significant non-cash impact of depreciation and amortization as well as items not indicative of ongoing operating activities. Total operating costs include depreciation, amortization, severance and multiemployer pension plan withdrawal costs. Total operating costs excluding these items provide investors with helpful supplemental information on the Company’s underlying operating costs that is used by management in its financial and operational decision-making.
Management considers special items, which may include impairment charges, pension settlement charges and other items that arise from time to time, to be outside the ordinary course of our operations. Management believes that excluding these items provides a better understanding of the underlying trends in the Company’s operating performance and allows more accurate comparisons of the Company’s operating results to historical performance. In addition, management excludes severance costs, which may fluctuate significantly from quarter to quarter, because it believes these costs do not necessarily reflect expected future operating costs and do not contribute to a meaningful comparison of the Company’s operating results to historical performance.
Non-operating retirement costs include (i) interest cost, expected return on plan assets, amortization of actuarial gains and loss components and amortization of prior service credits of single-employer pension expense, (ii) interest cost, amortization of actuarial gains and loss components and amortization of prior service credits of retirement medical expense and (iii) all multiemployer pension plan withdrawal costs. These non-operating retirement costs are primarily tied to financial market performance including changes in market interest rates and investment performance. Management considers non-operating retirement costs to be outside the performance of the business and believes that presenting adjusted diluted earnings per share from continuing operations excluding non-operating retirement costs and presenting adjusted operating results excluding multiemployer pension plan withdrawal costs, in addition to the Company’s GAAP diluted earnings per share from continuing operations and GAAP operating results, provide increased transparency and a better understanding of the underlying trends in the Company’s operating business performance.
Reconciliations of these non-GAAP financial measures to the most directly comparable GAAP measures are set out in the tables below.
THE NEW YORK TIMES COMPANY | ||||||||||||||||||||
RECONCILIATION OF NON-GAAP INFORMATION | ||||||||||||||||||||
(Dollars in thousands, except per share data) | ||||||||||||||||||||
Reconciliation of diluted earnings per share from continuing operations excluding severance, non-operating retirement costs and special items (or adjusted diluted earnings per share from continuing operations) | ||||||||||||||||||||
Third Quarter | Nine Months | |||||||||||||||||||
2020 | 2019 | % Change | 2020 | 2019 | % Change | |||||||||||||||
Diluted earnings per share from continuing operations | $ | 0.20 | $ | 0.10 | * | $ | 0.54 | $ | 0.43 | 25.6% | ||||||||||
Add: | ||||||||||||||||||||
Severance | — | — | — | 0.04 | 0.01 | * | ||||||||||||||
Non-operating retirement costs: | ||||||||||||||||||||
Multiemployer pension plan withdrawal costs | 0.01 | 0.01 | — | 0.02 | 0.03 | (33.3)% | ||||||||||||||
Other components of net periodic benefit costs | 0.01 | 0.01 | — | 0.04 | 0.03 | 33.3% | ||||||||||||||
Special items: | ||||||||||||||||||||
Restructuring charge | — | 0.02 | * | — | 0.02 | * | ||||||||||||||
Gain from non-marketable equity security | — | — | — | (0.06) | — | * | ||||||||||||||
Gain from pension liability adjustment | — | (0.01) | * | — | (0.01) | * | ||||||||||||||
Income tax expense of adjustments | (0.01) | (0.01) | — | (0.01) | (0.02) | (50.0)% | ||||||||||||||
Adjusted diluted earnings per share from continuing operations(1) | $ | 0.22 | $ | 0.12 | 83.3% | $ | 0.57 | $ | 0.49 | 16.3% | ||||||||||
(1) Amounts may not add due to rounding. | ||||||||||||||||||||
* Represents a change equal to or in excess of 100% or not meaningful. | ||||||||||||||||||||
Reconciliation of operating profit before depreciation & amortization, severance, multiemployer pension plan withdrawal costs and special items (or adjusted operating profit) | ||||||||||||||||||||
Third Quarter | Nine Months | |||||||||||||||||||
2020 | 2019 | % Change | 2020 | 2019 | % Change | |||||||||||||||
Operating profit | $ | 39,596 | $ | 25,086 | 57.8% | $ | 95,722 | $ | 97,617 | (1.9)% | ||||||||||
Add: | ||||||||||||||||||||
Depreciation & amortization | 15,552 | 15,450 | 0.7% | 46,368 | 45,548 | 1.8% | ||||||||||||||
Severance | — | 367 | * | 6,675 | 2,441 | * | ||||||||||||||
Multiemployer pension plan withdrawal costs | 1,376 | 1,204 | 14.3% | 4,198 | 4,454 | (5.7)% | ||||||||||||||
Special items: | ||||||||||||||||||||
Restructuring charge | — | 4,008 | * | — | 4,008 | * | ||||||||||||||
Gain from pension liability adjustment | — | (2,045) | * | — | (2,045) | * | ||||||||||||||
Adjusted operating profit | $ | 56,524 | $ | 44,070 | 28.3% | $ | 152,963 | $ | 152,023 | 0.6% | ||||||||||
* Represents a change equal to or in excess of 100% or not meaningful. | ||||||||||||||||||||
RECONCILIATION OF NON-GAAP INFORMATION | ||||||||||||||||||||
(Dollars in thousands, except per share data) | ||||||||||||||||||||
Reconciliation of operating costs before depreciation & amortization, severance and multiemployer pension plan withdrawal costs (or adjusted operating costs) | ||||||||||||||||||||
Third Quarter | Nine Months | |||||||||||||||||||
2020 | 2019 | % Change | 2020 | 2019 | % Change | |||||||||||||||
Operating costs | $ | 387,299 | $ | 401,452 | (3.5)% | $ | 1,178,559 | $ | 1,204,241 | (2.1)% | ||||||||||
Less: | ||||||||||||||||||||
Depreciation & amortization | 15,552 | 15,450 | 0.7% | 46,368 | 45,548 | 1.8% | ||||||||||||||
Severance | — | 367 | * | 6,675 | 2,441 | * | ||||||||||||||
Multiemployer pension plan withdrawal costs | 1,376 | 1,204 | 14.3% | 4,198 | 4,454 | (5.7)% | ||||||||||||||
Adjusted operating costs | $ | 370,371 | $ | 384,431 | (3.7)% | $ | 1,121,318 | $ | 1,151,798 | (2.6)% | ||||||||||
* Represents a change equal to or in excess of 100% or not meaningful. | ||||||||||||||||||||
THE NEW YORK TIMES COMPANY |
RECONCILIATION OF GAAP INFORMATION |
(Dollars in thousands, except per share data) |
Reclassification
The Company changed the expense captions on its Condensed Consolidated Statement of Operations effective for the quarter ended March 29, 2020. These changes were made in order to reflect how the Company manages its business and to communicate where the Company is investing resources and how this aligns with the Company’s strategy. The Company reclassified expenses for the prior period in order to present comparable financial results. There was no change to consolidated operating income, operating expense, net income or cash flows as a result of this change in classification. A summary of changes is as follows:
“Production costs” has become “Cost of revenue”:
- Cost of revenue contains all costs related to content creation, subscriber and advertiser servicing, and print production and distribution costs as well as infrastructure costs related to delivering digital content, which include all cloud and cloud related costs as well as compensation for employees that enhance and maintain our platforms. This represents a change from previously disclosed production costs, which did not include distribution or subscriber servicing costs. In addition, certain product development costs previously included in production costs have been reclassified to product development.
“Selling, general and administrative” has been split into three lines:
- Sales and marketing represents all costs related to the Company’s marketing efforts as well as advertising sales costs.
- Product development represents the Company’s investment into developing and enhancing new and existing product technology, including engineering, product development, and data insights.
- General and administrative includes general management, corporate enterprise technology, building operations, unallocated overhead costs, severance and multiemployer pension plan withdrawal costs.
In addition, incentive compensation, which was previously wholly included in selling, general and administrative, was reclassified to align with the classification of the related wages across each of the expense captions.
THE NEW YORK TIMES COMPANY |
RECONCILIATION OF GAAP INFORMATION |
(Dollars in thousands) |
A reconciliation of the expenses as previously disclosed to the recast presentation for the quarter and nine months ended September 29, 2019, is as follows:
As Reported for
| Reclassification | Recast for
| |||||||||||
Operating costs | |||||||||||||
Production costs: | |||||||||||||
Wages and benefits | $ | 106,377 | $ | (106,377) | (1)(2) | $ | — | ||||||
Raw materials | 18,531 | (18,531) | (1) | — | |||||||||
Other production costs | 53,868 | (53,868) | (1)(2) | — | |||||||||
Total production costs | 178,776 | (178,776) | (1)(2) | — | |||||||||
Cost of revenue (excluding depreciation and amortization) | — | 245,100 | (1)(3)(4) | 245,100 | |||||||||
Selling, general and administrative costs | 207,226 | (207,226) | (3)(4)(5) | — | |||||||||
Sales and marketing | — | 64,218 | (4)(5) | 64,218 | |||||||||
Product development | — | 26,669 | (2)(4)(5) | 26,669 | |||||||||
General and administrative | — | 50,015 | (4)(5) | 50,015 | |||||||||
Depreciation and amortization | 15,450 | — | 15,450 | ||||||||||
Total operating costs | $ | 401,452 | $ | — | $ | 401,452 | |||||||
As Reported for
| Reclassification | Recast for
| |||||||||||
Operating costs | |||||||||||||
Production costs: | |||||||||||||
Wages and benefits | $ | 313,244 | $ | (313,244) | (1)(2) | $ | — | ||||||
Raw materials | 57,527 | (57,527) | (1) | — | |||||||||
Other production costs | 149,102 | (149,102) | (1)(2) | — | |||||||||
Total production costs | 519,873 | (519,873) | (1)(2) | — | |||||||||
Cost of revenue (excluding depreciation and amortization) | — | 729,654 | (1)(3)(4) | 729,654 | |||||||||
Selling, general and administrative costs | 638,820 | (638,820) | (3)(4)(5) | — | |||||||||
Sales and marketing | — | 201,327 | (4)(5) | 201,327 | |||||||||
Product development | — | 75,658 | (2)(4)(5) | 75,658 | |||||||||
General and administrative | — | 152,054 | (4)(5) | 152,054 | |||||||||
Depreciation and amortization | 45,548 | — | 45,548 | ||||||||||
Total operating costs | $ | 1,204,241 | $ | — | $ | 1,204,241 | |||||||
(1) | In the first quarter of 2020, the Company discontinued the use of the production cost caption. These costs, with the exception of product engineering and product design costs, which were reclassified to product development, were reclassified to cost of revenue. | |
(2) | Costs related to developing and enhancing new and existing product technology previously included in production costs were reclassified to product development. | |
(3) | Distribution and fulfillment costs and subscriber and advertising servicing related costs previously included in selling, general and administrative were reclassified to cost of revenue. | |
(4) | Incentive Compensation previously included in selling, general and administrative was reclassified to align with the related salaries in each caption. | |
(5) | In the first quarter of 2020, the Company discontinued the use of the selling, general and administrative cost caption. These costs, with the exception of those related to distribution and fulfillment, subscriber and advertising servicing and incentive compensation related to cost of revenue, were reclassified to the new captions: sales and marketing, product development and general and administrative. |
View source version on businesswire.com: https://www.businesswire.com/news/home/20201105005201/en/
Contacts:
For Investors: Harlan Toplitzky, 212-556-7775; harlan.toplitzky@nytimes.com
