Deckers has gotten torched over the last six months - since March 2026, its stock price has dropped 21.8% to $80.15 per share. This might have investors contemplating their next move.
Is there a buying opportunity in Deckers, or does it present a risk to your portfolio? Get the full breakdown from our expert analysts, it’s free.
Why Do We Think Deckers Will Underperform?
Even though the stock has become cheaper, we’re passing on Deckers for now. Here are three reasons why there are better opportunities than DECK, plus one stock we’d rather own.
1. Weak Constant Currency Growth Points to Soft Demand
In addition to reported revenue, constant currency revenue is a useful data point for analyzing Consumer Discretionary - Footwear companies. This metric excludes currency movements, which are outside of Deckers’s control and are not indicative of underlying demand.
Over the last two years, Deckers’s constant currency revenue averaged 11.1% year-on-year growth. This performance was underwhelming and suggests it might have to lower prices or invest in product improvements to accelerate growth, factors that can hinder near-term profitability. 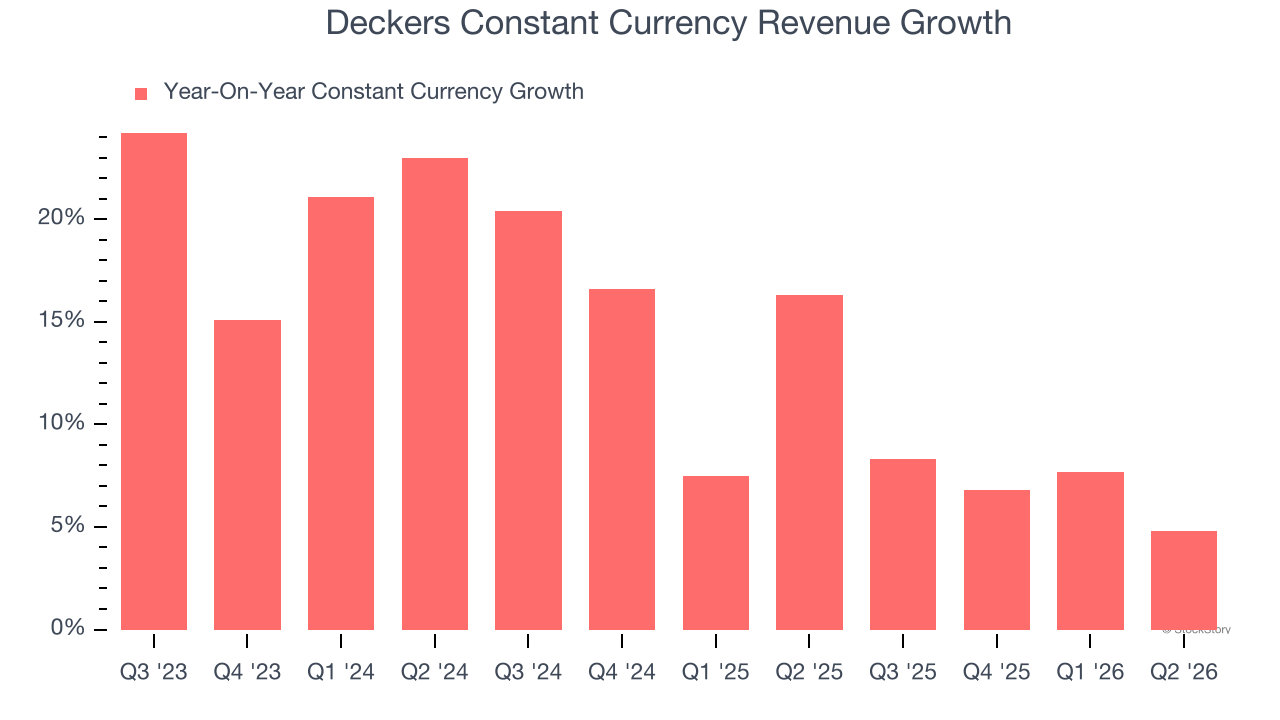
2. Weak Operating Margin Could Cause Trouble
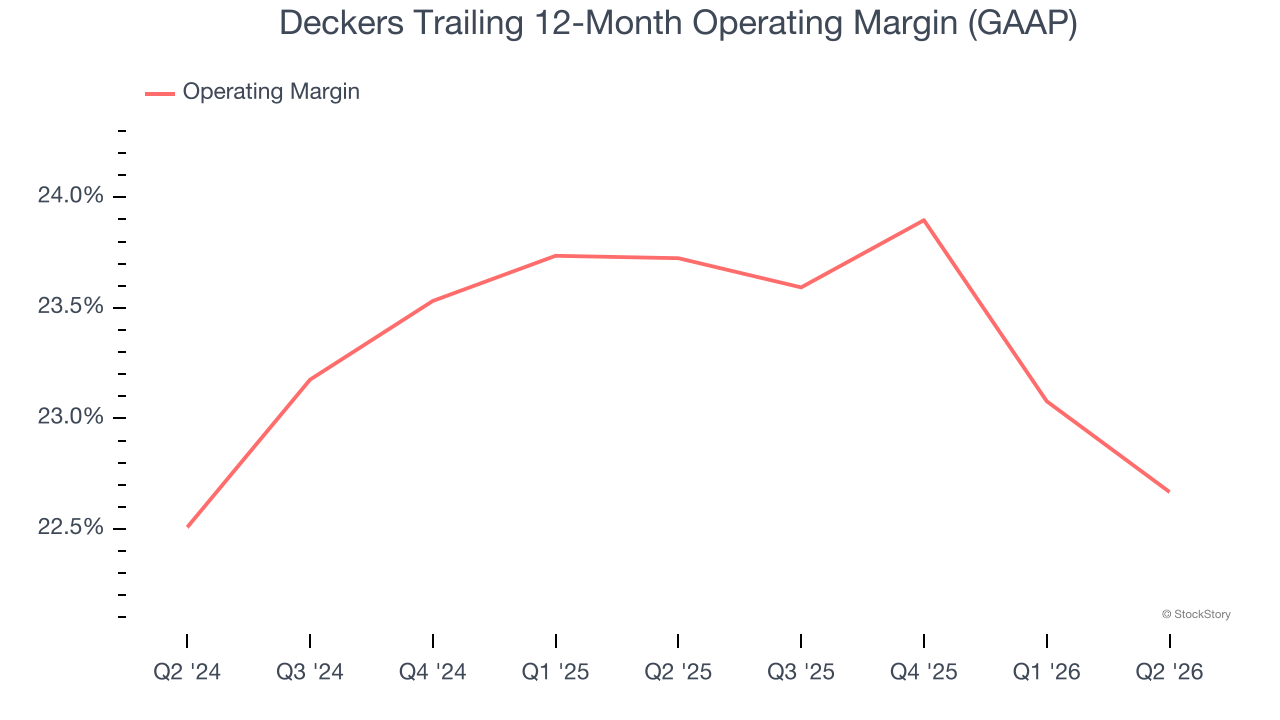
Operating margin is a key measure of profitability. Think of it as net income - the bottom line - excluding the impact of taxes and interest on debt, which are less connected to business fundamentals.
Deckers’s operating margin has been trending down over the last 12 months and averaged 23.2% over the last two years. The company’s profitability was mediocre for a consumer discretionary business and shows it couldn’t pass its higher operating expenses onto its customers.
3. Mediocre Free Cash Flow Margin Limits Reinvestment Potential
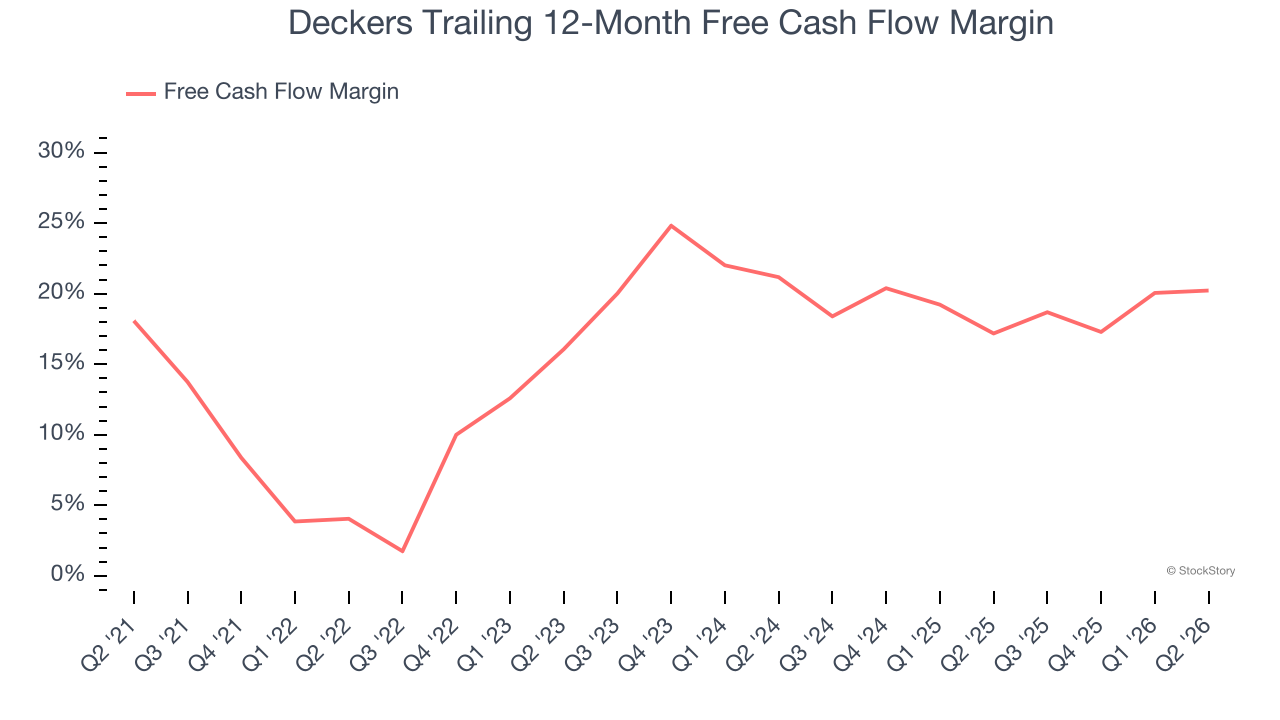
Free cash flow isn’t a prominently featured metric in company financials and earnings releases, but we think it’s telling because it accounts for all operating and capital expenses, making it tough to manipulate. Cash is king.
Deckers has shown poor cash profitability relative to peers over the last two years, giving the company fewer opportunities to return capital to shareholders. Its free cash flow margin averaged 18.8%, below what we’d expect for a consumer discretionary business.
Final Judgment
We cheer for all companies serving everyday consumers, but in the case of Deckers, we’ll be cheering from the sidelines. After the recent drawdown, the stock trades at 10.5× forward P/E (or $80.15 per share). While this valuation is reasonable, we don’t see a big opportunity at the moment. There are better stocks to buy right now. We’d recommend looking at a top digital advertising platform riding the creator economy.
Stocks We Would Buy Instead of Deckers
ONE MORE THING: Top 5 Growth Stocks. The biggest stock winners almost always had one thing in common before they ran. Revenue growing like crazy. Meta. CrowdStrike. Broadcom. Our AI flagged all three. They returned 315%, 314%, and 455%, respectively.
Find out which 5 stocks it’s flagging this month — FREE. Get Our Top 5 Growth Stocks for Free HERE.
Stocks that have made our list include now familiar names such as Nvidia (+1,460% between June 2020 and June 2025) as well as under-the-radar businesses like the once-small-cap company Comfort Systems (+1,154% between June 2020 and June 2025). Find your next big winner with StockStory today.