ABM currently trades at $48.95 per share and has shown little upside over the past six months, posting a middling return of 2.9%. The stock also fell short of the S&P 500’s 11.7% gain during that period.
Is there a buying opportunity in ABM, or does it present a risk to your portfolio? Check out our in-depth research report to see what our analysts have to say, it’s free.
Why Is ABM Not Exciting?
We’re passing on ABM for now. Here are three reasons why ABM doesn’t excite us, plus one stock we’d rather own.
1. Slow Organic Growth Suggests Waning Demand In Core Business
We can better understand Industrial & Environmental Services companies by analyzing their organic revenue. This metric gives visibility into ABM’s core business because it excludes one-time events such as mergers, acquisitions, and divestitures along with foreign currency fluctuations - non-fundamental factors that can manipulate the income statement.
Over the last two years, ABM’s organic revenue averaged 4.1% year-on-year growth. This performance slightly lagged the sector and suggests it may need to improve its products, pricing, or go-to-market strategy, which can add an extra layer of complexity to its operations. 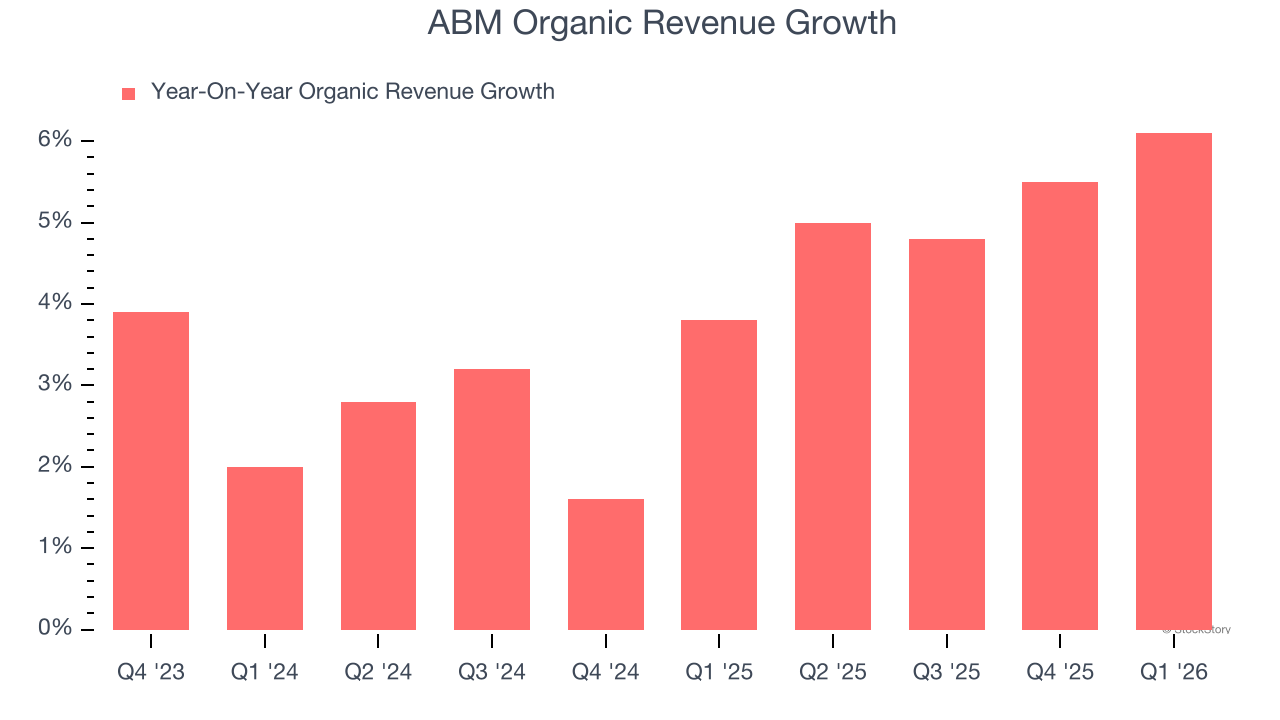
2. EPS Growth Has Stalled
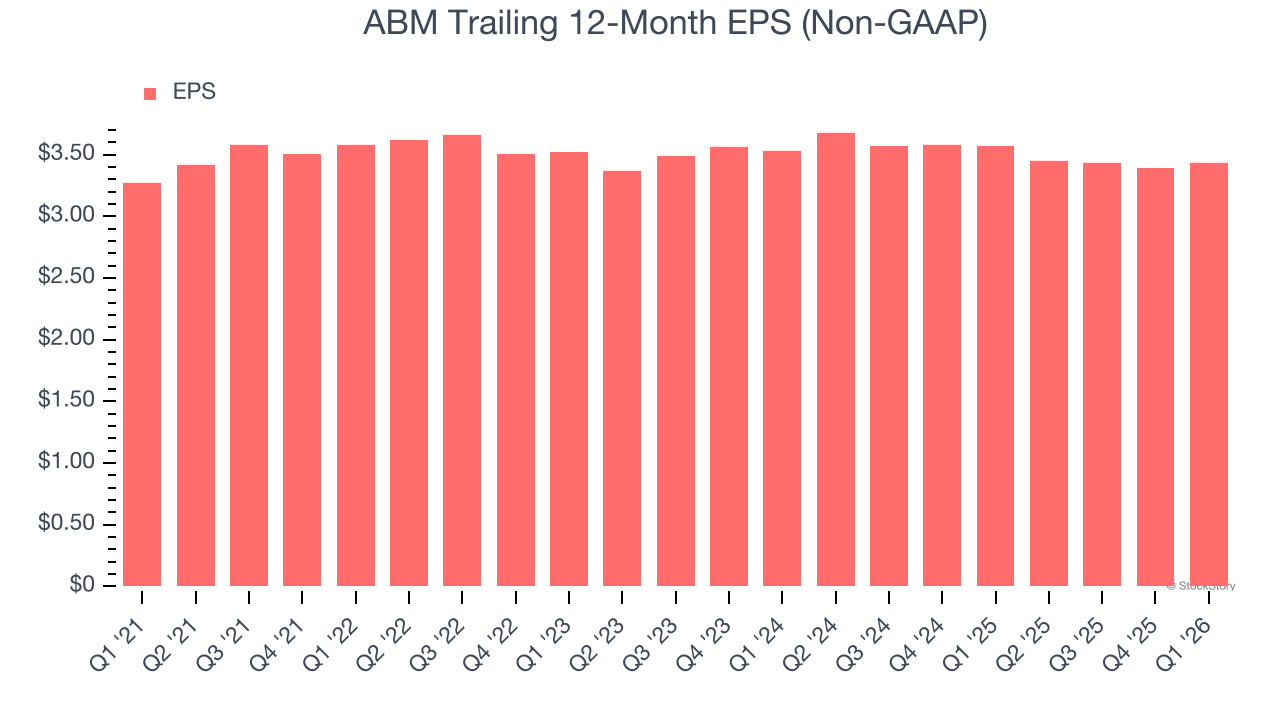
We track the long-term change in earnings per share (EPS) because it highlights whether a company’s growth is profitable.
ABM’s flat EPS over the last five years was below its 9.1% annualized revenue growth. This tells us the company became less profitable on a per-share basis as it expanded.
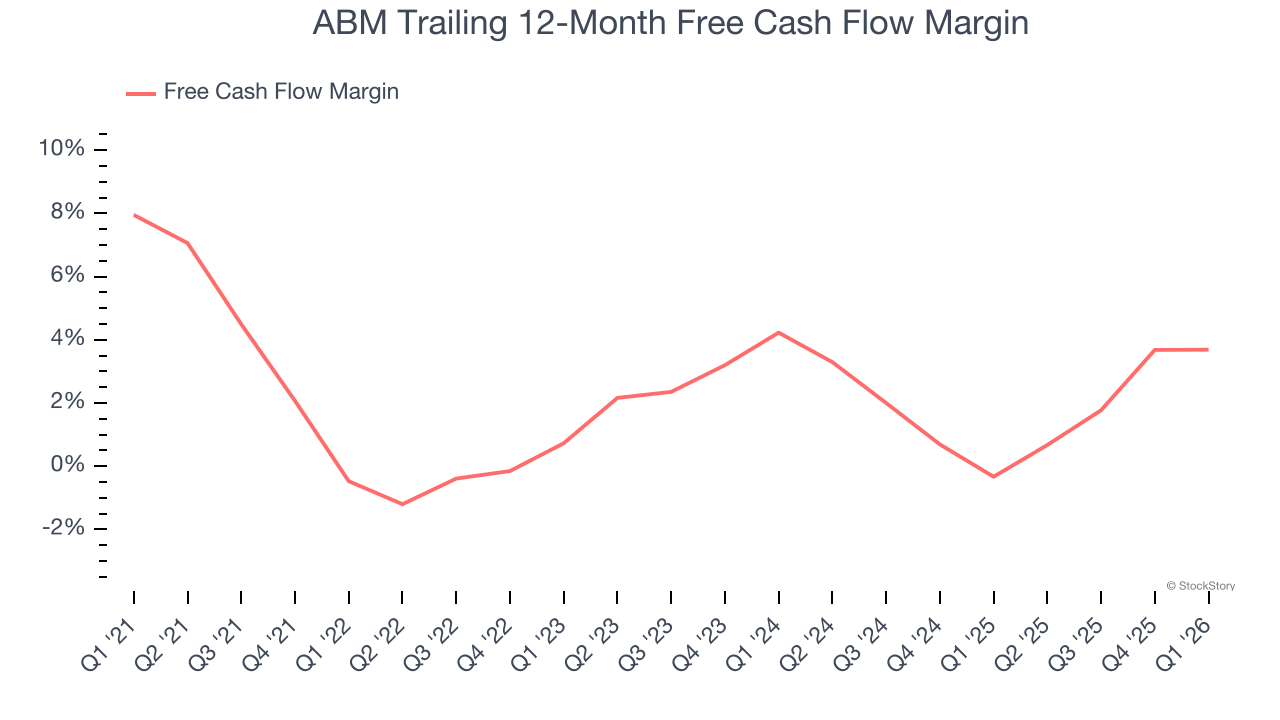
3. Mediocre Free Cash Flow Margin Limits Reinvestment Potential
Free cash flow isn’t a prominently featured metric in company financials and earnings releases, but we think it’s telling because it accounts for all operating and capital expenses, making it tough to manipulate. Cash is king.
ABM has shown poor cash profitability relative to peers over the last five years, giving the company fewer opportunities to return capital to shareholders. Its free cash flow margin averaged 1.7%, below what we’d expect for a business services business.
Final Judgment
ABM’s business quality ultimately falls short of our standards. With its shares underperforming the market lately, the stock trades at 11.9× forward P/E (or $48.95 per share). While this valuation is reasonable, we don’t really see a big opportunity at the moment. We’re fairly confident there are better investments elsewhere. Let us point you toward the most dominant software business in the world.
Stocks We Like More Than ABM
ONE MORE THING: Top 6 Stocks for This Week. This market is separating quality stocks from expensive ones fast. AI is taking down whole sectors with no warning. In a rotation this fast, you need more than a list of good companies.
Our AI system flagged Palantir before it ran 1,662% between October 2022 and February 2026. AppLovin before it ran 753% between February 2024 and February 2026. Nvidia before it ran 1,178% between January 2023 and February 2026. Each week it produces 6 new names that pass the same tests. Get Our Top 6 Stocks for Free HERE.
Stocks that have made our list include now familiar names such as Nvidia (+1,460% between June 2020 and June 2025) as well as under-the-radar businesses like the once-micro-cap company Tecnoglass (+1,552% between June 2020 and June 2025). Find your next big winner with StockStory today.