Online fashion resale marketplace ThredUp (NASDAQ: TDUP) met Wall Street’s revenue expectations in Q2 CY2026, with sales up 16.9% year on year to $90.77 million. On the other hand, next quarter’s revenue guidance of $88 million was less impressive, coming in 5.4% below analysts’ estimates. Its GAAP loss of $0.05 per share was $0.02 below analysts’ consensus estimates.
Is now the time to buy ThredUp? Find out by accessing our full research report, it’s free.
ThredUp (TDUP) Q2 CY2026 Highlights:
- Revenue: $90.77 million vs analyst estimates of $90.34 million (16.9% year-on-year growth, in line)
- EPS (GAAP): -$0.05 vs analyst estimates of -$0.03 ($0.02 miss)
- Adjusted EBITDA: $4.78 million vs analyst estimates of $4.69 million (5.3% margin, relatively in line)
- The company dropped its revenue guidance for the full year to $346.4 million at the midpoint from $353.7 million, a 2.1% decrease
- Operating Margin: -6.7%, in line with the same quarter last year
- Free Cash Flow was $1.78 million, up from -$2.94 million in the same quarter last year
- Orders: up 300,000 year on year
- Market Capitalization: $796.2 million
“We're pleased with our Q2 results, which exceeded our expectations across the board," said ThredUp CEO and co-founder James Reinhart.
Company Overview
Founded to revolutionize thrifting, ThredUp (NASDAQ: TDUP) is a leading online fashion resale marketplace offering a wide selection of gently-used clothing and accessories.
Revenue Growth
Reviewing a company’s long-term sales performance reveals insights into its quality. Any business can experience short-term success, but top-performing ones enjoy sustained growth for years. Regrettably, ThredUp’s sales grew at a weak 7.3% compounded annual growth rate over the last five years. This was below our standard for the consumer discretionary sector and is a rough starting point for our analysis.
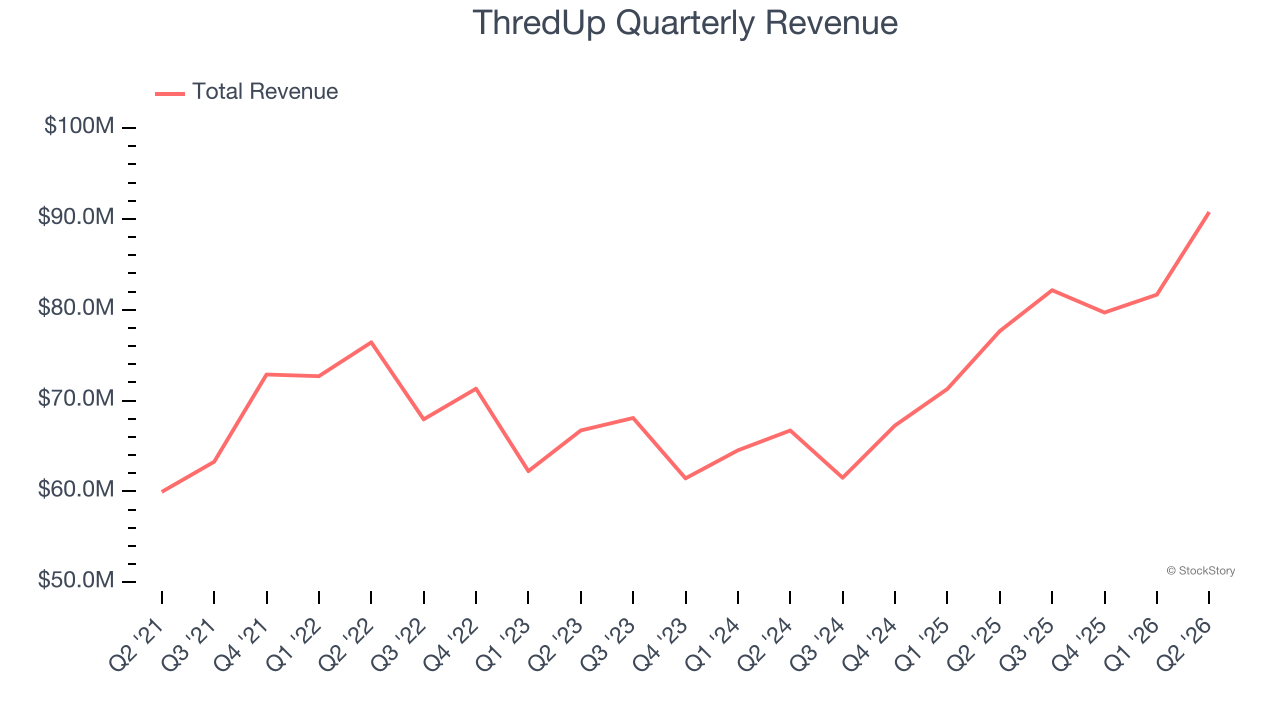
We at StockStory place the most emphasis on long-term growth, but within consumer discretionary, a stretched historical view may miss a company riding a successful new product or trend. ThredUp’s annualized revenue growth of 13.2% over the last two years is above its five-year trend, which is encouraging. 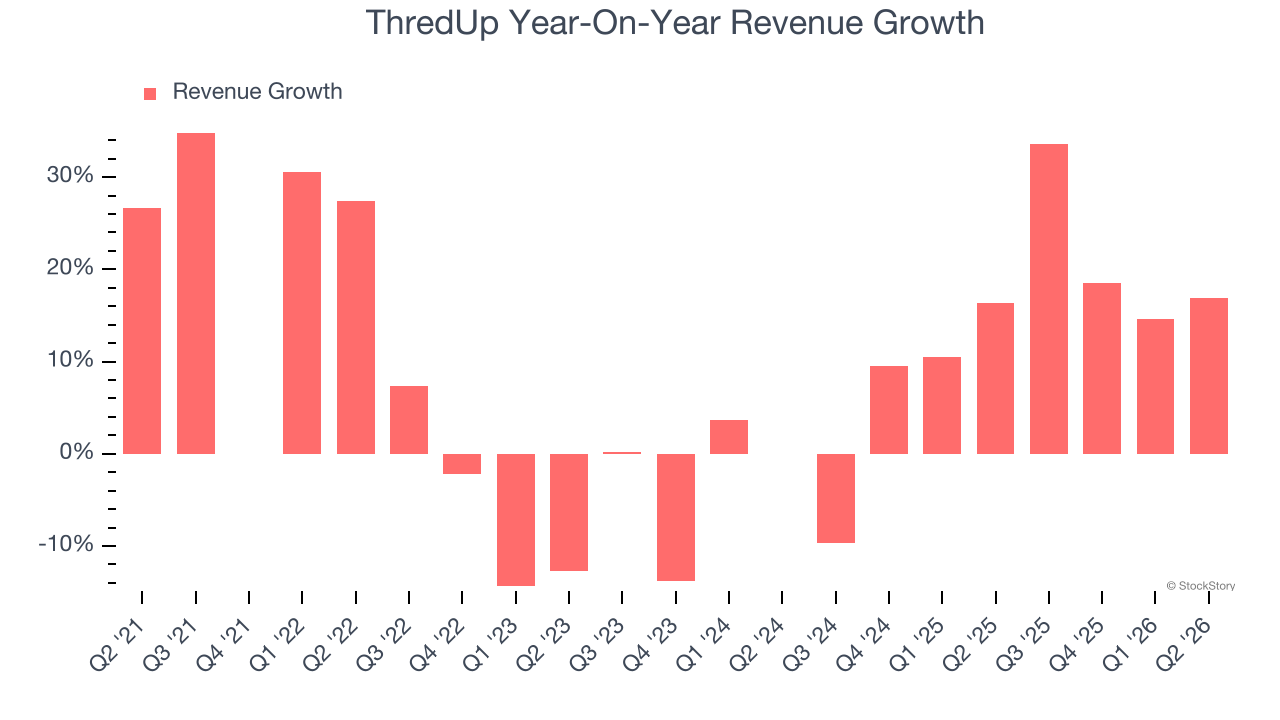
ThredUp also discloses its number of orders, which reached 1.77 million in the latest quarter. Over the last two years, ThredUp’s orders was flat. Because this number is lower than its revenue growth during the same period, we can see the company’s monetization has risen. 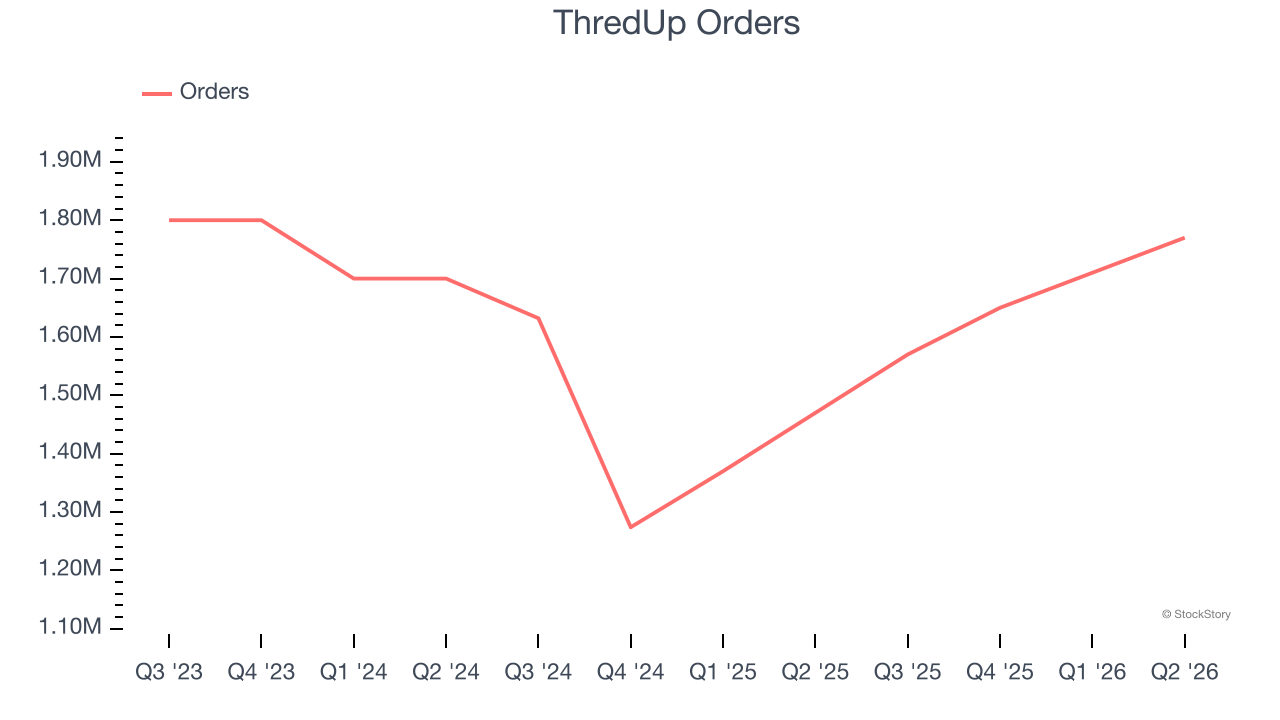
This quarter, ThredUp’s year-on-year revenue growth was 16.9%, and its $90.77 million of revenue was in line with Wall Street’s estimates. Company management is currently guiding for a 7.1% year-on-year increase in sales next quarter.
Looking further ahead, sell-side analysts expect revenue to grow 11.7% over the next 12 months, a slight deceleration versus the last two years. This projection doesn’t excite us and suggests its products and services will see some demand headwinds.
ONE MORE THING: The $21 AI Application Stock Wall Street Forgot. While Wall Street obsesses over who’s building AI, one company is already using it to print money. And nobody’s paying attention.
AI chip stocks trade at ridiculous valuations. This company processes a trillion consumer signals monthly using AI and trades at a third of the price. The gap won’t last. The institutions will figure it out. You need to see this first. Read the FREE Report Before They Notice.
Operating Margin
Operating margin is an important measure of profitability as it shows the portion of revenue left after accounting for all core expenses — everything from the cost of goods sold to advertising and wages. It’s also useful for comparing profitability across companies with different levels of debt and tax rates because it excludes interest and taxes.
ThredUp’s operating margin has been trending up over the last 12 months, but it still averaged negative 8.7% over the last two years. This is due to its large expense base and inefficient cost structure.
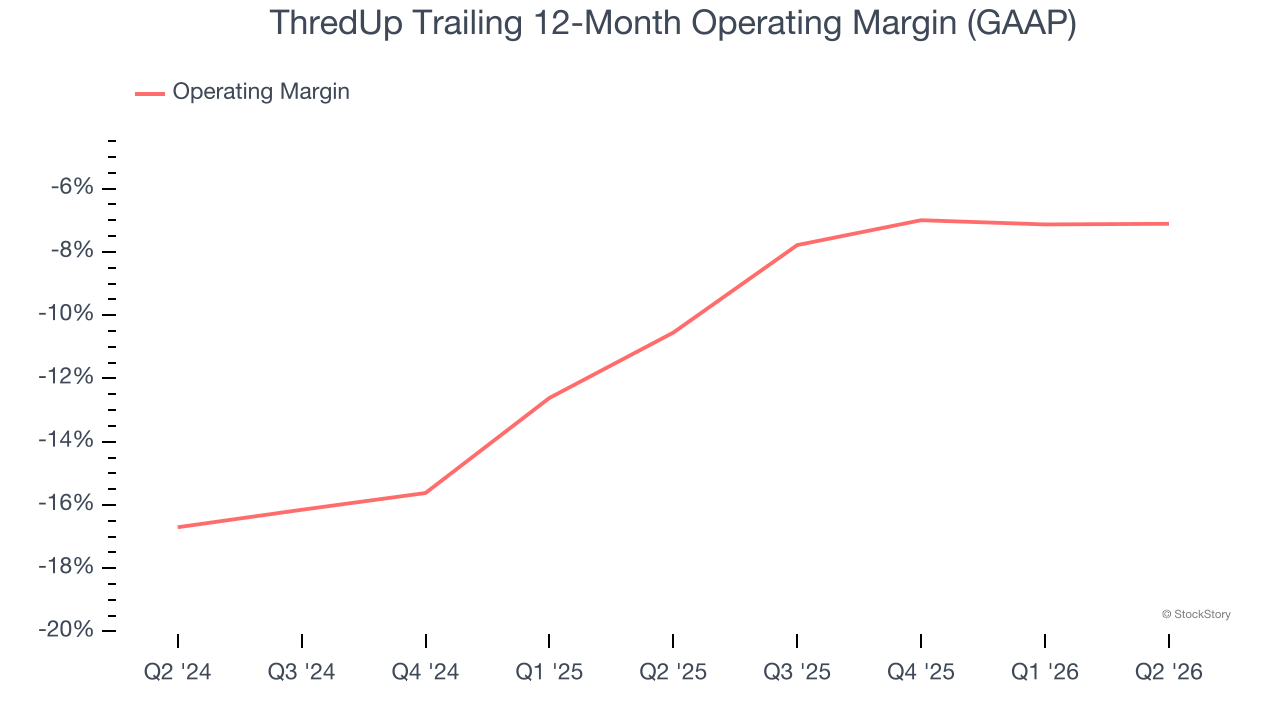
ThredUp’s operating margin was negative 6.7% this quarter. The company’s consistent lack of profits raises a flag.
Earnings Per Share
Revenue trends explain a company’s historical growth, but the long-term change in earnings per share (EPS) points to the profitability of that growth — for example, a company could inflate its sales through excessive spending on advertising and promotions.
Although ThredUp’s full-year earnings are still negative, it reduced its losses and improved its EPS by 44.4% annually over the last five years. The next few quarters will be critical for assessing its long-term profitability.
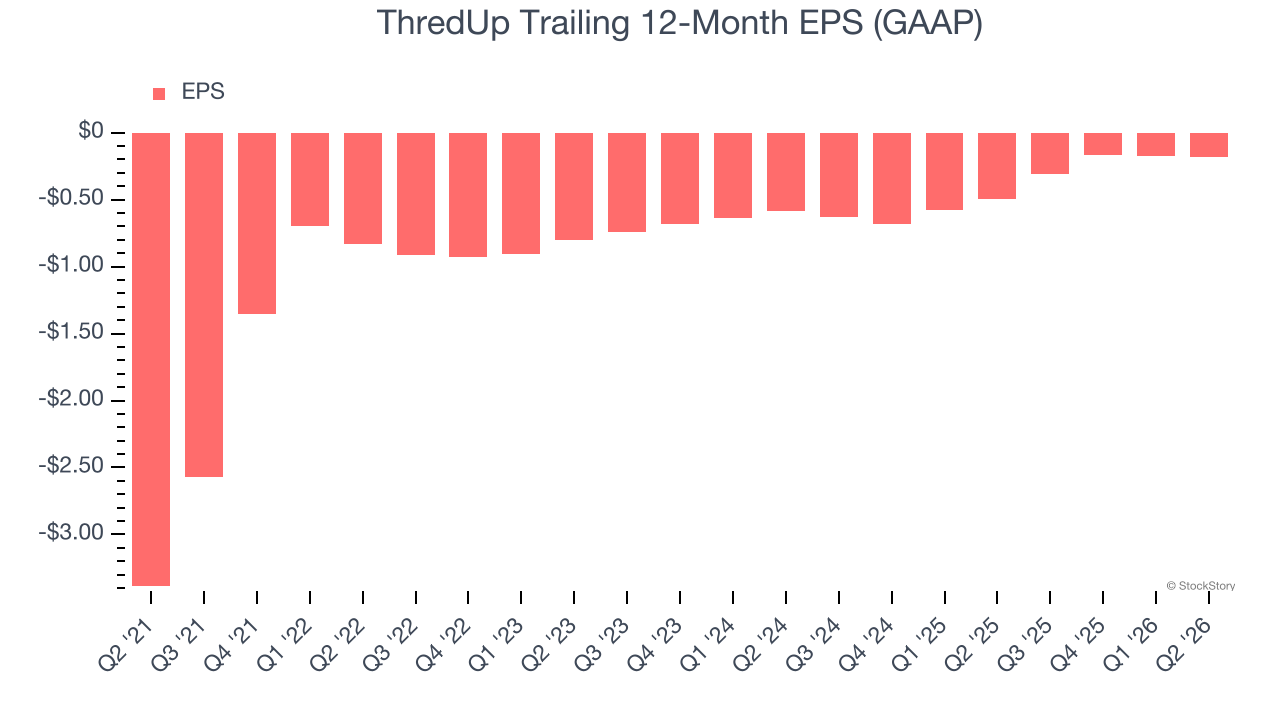
In Q2, ThredUp reported EPS of negative $0.05, in line with the same quarter last year. This print missed analysts’ estimates. Over the next 12 months, Wall Street expects ThredUp to improve its earnings losses. Analysts forecast its full-year EPS will improve from negative $0.18 to negative $0.07.
Key Takeaways from ThredUp’s Q2 Results
We struggled to find many positives in these results. Its EPS was in line and its full-year revenue guidance fell short of Wall Street’s estimates. Overall, this was a weaker quarter. The stock traded down 15.5% to $5.30 immediately after reporting.
ThredUp’s earnings report left more to be desired. Let’s look forward to see if this quarter has created an opportunity to buy the stock. If you’re making that decision, you should consider the bigger picture of valuation, business qualities, as well as the latest earnings. We cover that in our actionable full research report which you can read here (it’s free).