Mobile power and logistics company Solaris Energy Infrastructure (NYSE: SEI) beat Wall Street’s revenue expectations in Q2 CY2026, with sales up 46.9% year on year to $219.4 million. Its non-GAAP profit of $0.39 per share was 25.7% above analysts’ consensus estimates.
Is now the time to buy Solaris Energy Infrastructure? Find out by accessing our full research report, it’s free.
Solaris Energy Infrastructure (SEI) Q2 CY2026 Highlights:
- Revenue: $219.4 million vs analyst estimates of $204.9 million (46.9% year-on-year growth, 7.1% beat)
- Adjusted EPS: $0.39 vs analyst estimates of $0.31 (25.7% beat)
- Adjusted EBITDA: $108.3 million vs analyst estimates of $90.79 million (49.4% margin, 19.3% beat)
- Operating Margin: 25.8%, up from 23.8% in the same quarter last year
- Free Cash Flow was $491.8 million, up from -$160.9 million in the same quarter last year
- Market Capitalization: $3.55 billion
Company Overview
After acquiring Mobile Energy Rentals in 2024 to enter the distributed power market, Solaris Energy Infrastructure (NYSE: SEI) leases mobile power equipment and provides logistics services for oil and gas well completion.
Revenue Growth
Cyclical sectors like Energy often flatter weaker operators during favorable price environments, but a longer-term lens separates those from businesses that can consistently perform across market cycles. Luckily, Solaris Energy Infrastructure’s sales grew at an incredible 47.4% compounded annual growth rate over the last five years. Its growth beat the average energy upstream and integrated energy company and shows its offerings resonate with customers.
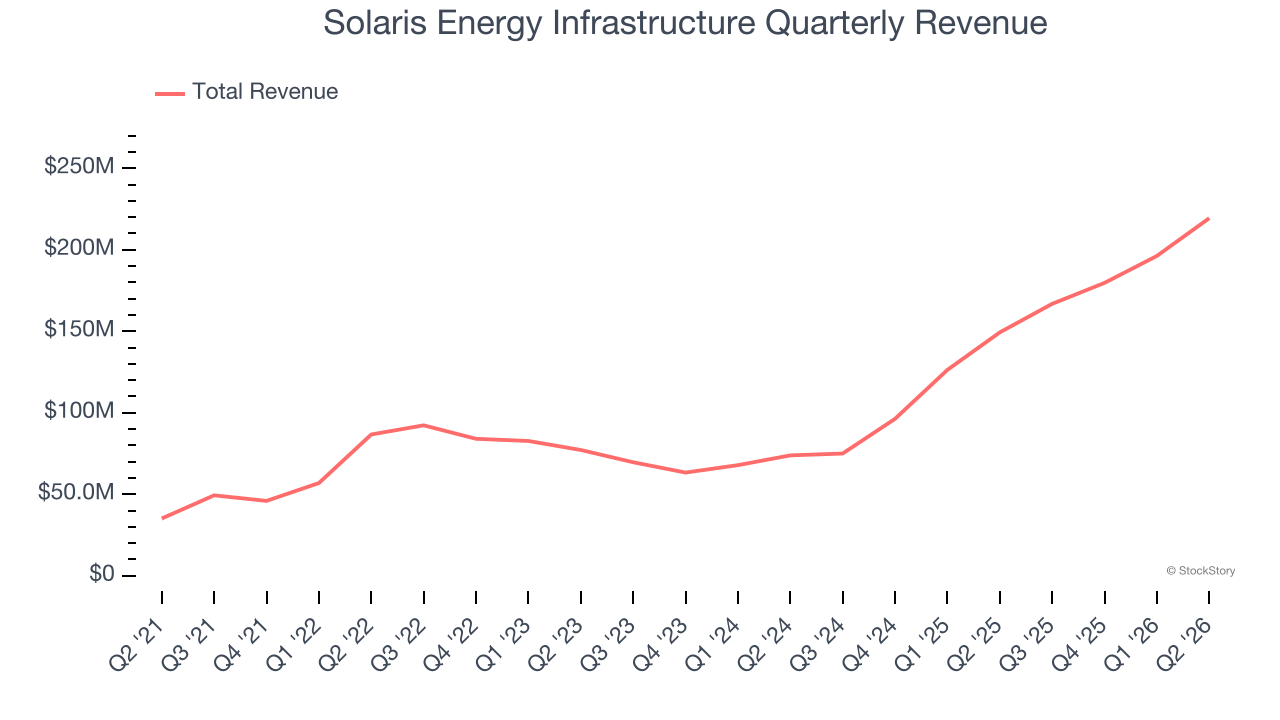
Within Energy, a singular timeframe, even if it’s quite long-term, only sheds light on how well a company rode the last commodity cycle. To better assess whether a company compounds through cycles, we validate our view with an even longer, ten-year view. Solaris Energy Infrastructure’s annualized revenue growth of 52.6% over the last ten years is above its five-year trend.
This quarter, Solaris Energy Infrastructure reported magnificent year-on-year revenue growth of 46.9%, and its $219.4 million of revenue beat Wall Street’s estimates by 7.1%.
WHILE YOU’RE HERE: The Next Palantir? One satellite company captures images of every point on Earth. Every single day. The Pentagon wants it. Hedge funds are using it to beat earnings. You’ve probably never heard of it.
This is what the early days of Palantir looked like before it became a giant. Same playbook. Different technology. If you missed Palantir, you need to see this. Claim The Stock Ticker for Free HERE.
Adjusted EBITDA Margin
Solaris Energy Infrastructure has done a decent job managing its cost base over the last five years. The company has produced an average EBITDA margin of 35.8%, higher than the broader energy upstream and integrated energy sector.
Looking at the trend in its profitability, Solaris Energy Infrastructure’s EBITDA margin rose by 20.4 percentage points over the last year, as its sales growth gave it immense operating leverage.
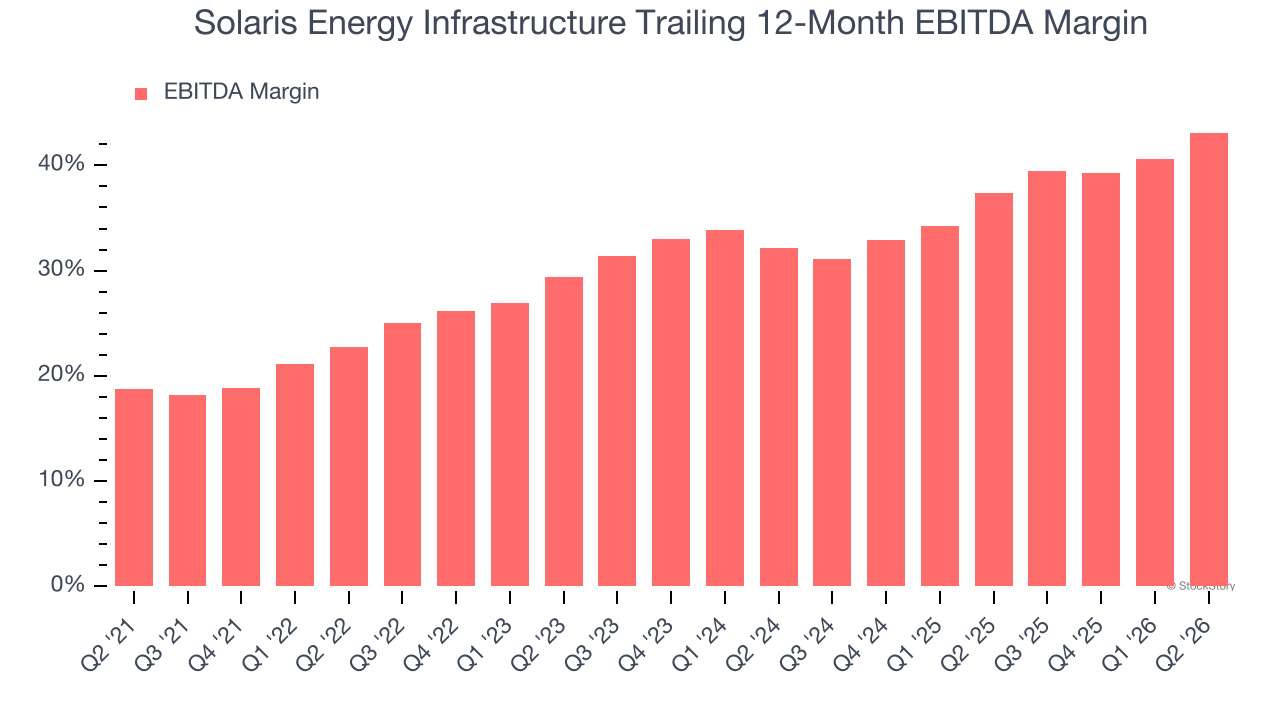
This quarter, Solaris Energy Infrastructure generated an EBITDA margin profit margin of 49.4%, up 8.8 percentage points year on year. This increase was a welcome development and shows it was more efficient. This adjusted EBITDA beat Wall Street’s estimates by 19.3%.
Cash Is King
Adjusted EBITDA shows how profitable a company’s existing wells are before financing and reinvestment decisions, but free cash flow shows how much value remains after paying the cost of replacing those wells. In upstream energy, production naturally declines over time, so companies must continuously reinvest just to stand still. A producer can report strong EBITDA margins yet generate little or no free cash flow if its wells decline quickly or if new drilling is expensive. Free cash flow therefore captures not only how efficiently a company produces hydrocarbons today, but also how costly it is to sustain that production into the future.
While Solaris Energy Infrastructure posted positive free cash flow this quarter, the broader story hasn’t been so clean. Solaris Energy Infrastructure’s demanding reinvestments have drained its resources over the last five years, putting it in a pinch and limiting its ability to return capital to investors. Its free cash flow margin averaged negative 15.9%, meaning it lit $15.86 of cash on fire for every $100 in revenue.
The level of free cash flow is important, but its durability across cycles is just as critical. Consistent margins are far more valuable than volatile swings driven by commodity prices.
Solaris Energy Infrastructure’s ratio of quarterly free cash flow volatility to WTI crude price volatility over the past five years was 58.3 (lower is better), indicating that its cash generation is far more sensitive to commodity-price swings than most peers. This elevated volatility limits its access to capital in downturns and makes it unlikely to act as a consolidator when weaker competitors come under pressure.
You may be asking why we wait until the free cash flow line to perform this stability analysis versus commodity prices. Why not compare revenue or EBITDA to WTI Crude prices in the case of Solaris Energy Infrastructure? Because what ultimately matters is not how much revenue or profit you earn when prices are high but how much cash you can generate when prices are low. Free cash flow is the superior metric because it includes everything from hedging prowess to growth and maintenance capex to management behavior during good times and bad.
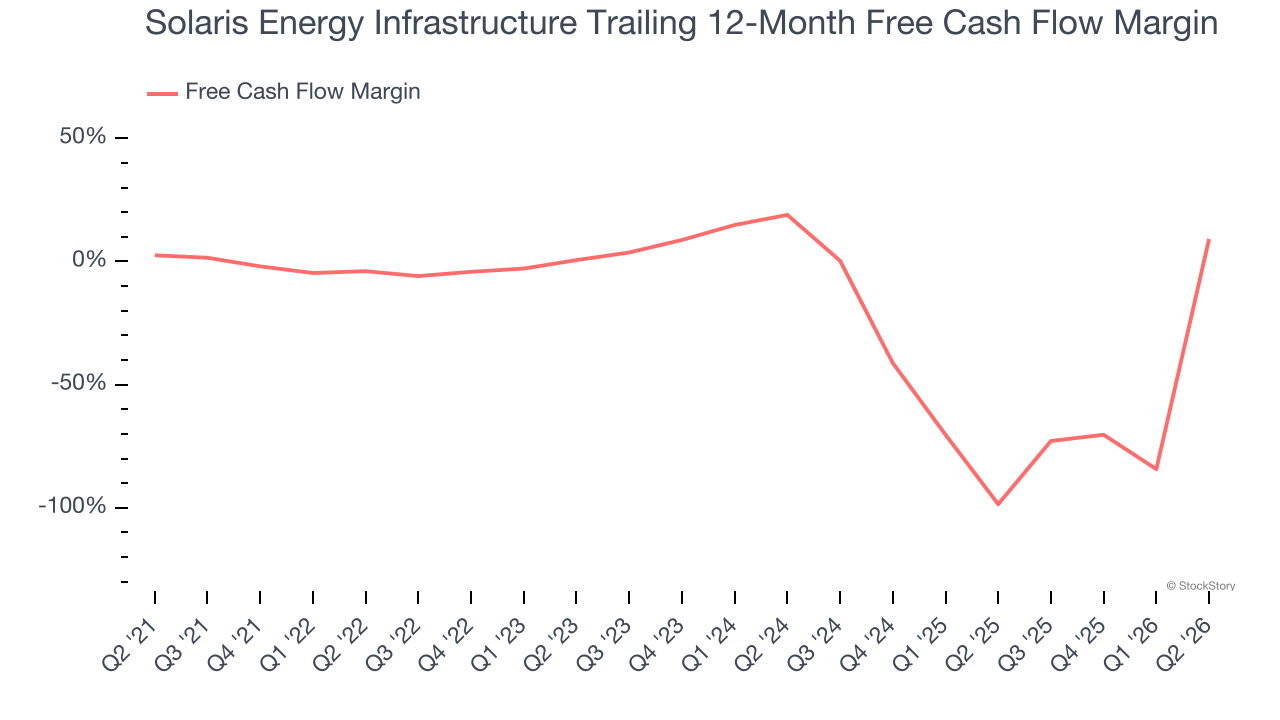
Solaris Energy Infrastructure’s free cash flow clocked in at $491.8 million in Q2, equivalent to a 224% margin. Its cash flow turned positive after being negative in the same quarter last year, marking a potential inflection point.
Key Takeaways from Solaris Energy Infrastructure’s Q2 Results
It was good to see Solaris Energy Infrastructure beat analysts’ EPS expectations this quarter. We were also excited its EBITDA outperformed Wall Street’s estimates by a wide margin. Zooming out, we think this was a good print with some key areas of upside. The stock traded up 4.5% to $58.17 immediately following the results.
Solaris Energy Infrastructure may have had a good quarter, but does that mean you should invest right now? When making that decision, it’s important to consider its valuation, business qualities, as well as what has happened in the latest quarter. We cover that in our actionable full research report which you can read here (it’s free).