
Media broadcasting company Sinclair (NASDAQ: SBGI) met Wall Street’s revenue expectations in Q2 CY2026, with sales up 7.1% year on year to $840 million. On the other hand, the company’s full-year revenue guidance of $3.47 billion at the midpoint came in 0.9% below analysts’ estimates. Its GAAP loss of $1.06 per share was significantly below analysts’ consensus estimates.
Is now the time to buy Sinclair? Find out by accessing our full research report, it’s free.
Sinclair (SBGI) Q2 CY2026 Highlights:
- Revenue: $840 million vs analyst estimates of $840 million (7.1% year-on-year growth, in line)
- EPS (GAAP): -$1.06 vs analyst estimates of -$0.31 (significant miss)
- Adjusted EBITDA: $149 million vs analyst estimates of $141.8 million (17.7% margin, 5.1% beat)
- EBITDA guidance for the full year is $745 million at the midpoint, above analyst estimates of $735.3 million
- Operating Margin: 6%, up from 2.7% in the same quarter last year
- Market Capitalization: $1.01 billion
Company Overview
With over 2,400 hours of local news produced weekly and 640 broadcast channels reaching millions of American homes, Sinclair (NASDAQ: SBGI) operates a network of 185 local television stations across 86 U.S. markets, producing news programming and distributing content from major networks.
Revenue Growth
Reviewing a company’s long-term sales performance reveals insights into its quality. Any business can put up a good quarter or two, but many enduring ones grow for years.
With $3.26 billion in revenue over the past 12 months, Sinclair is a mid-sized business services company, which sometimes brings disadvantages compared to larger competitors benefiting from better economies of scale.
As you can see below, Sinclair’s demand was weak over the last five years. Its sales fell by 12% annually, a poor baseline for our analysis.
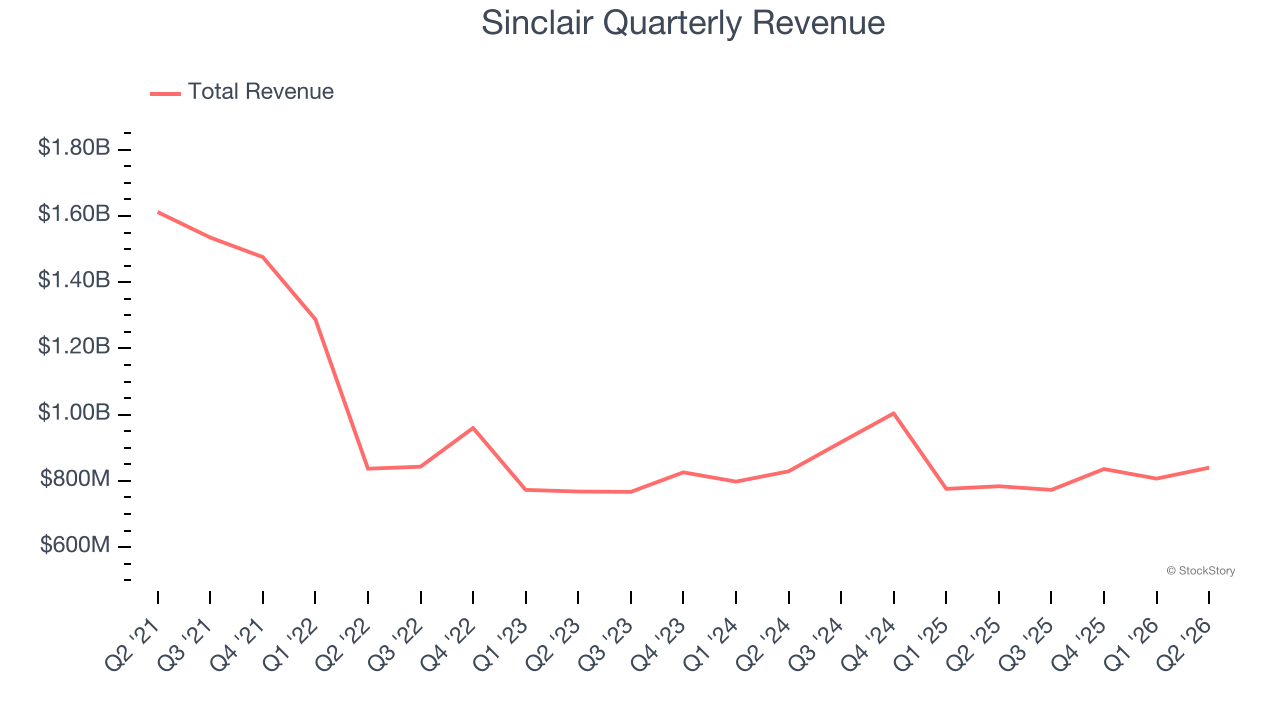
We at StockStory place the most emphasis on long-term growth, but within business services, a half-decade historical view may miss recent innovations or disruptive industry trends. Sinclair’s revenue over the last two years was flat, suggesting its demand was weak but stabilized after its initial drop. 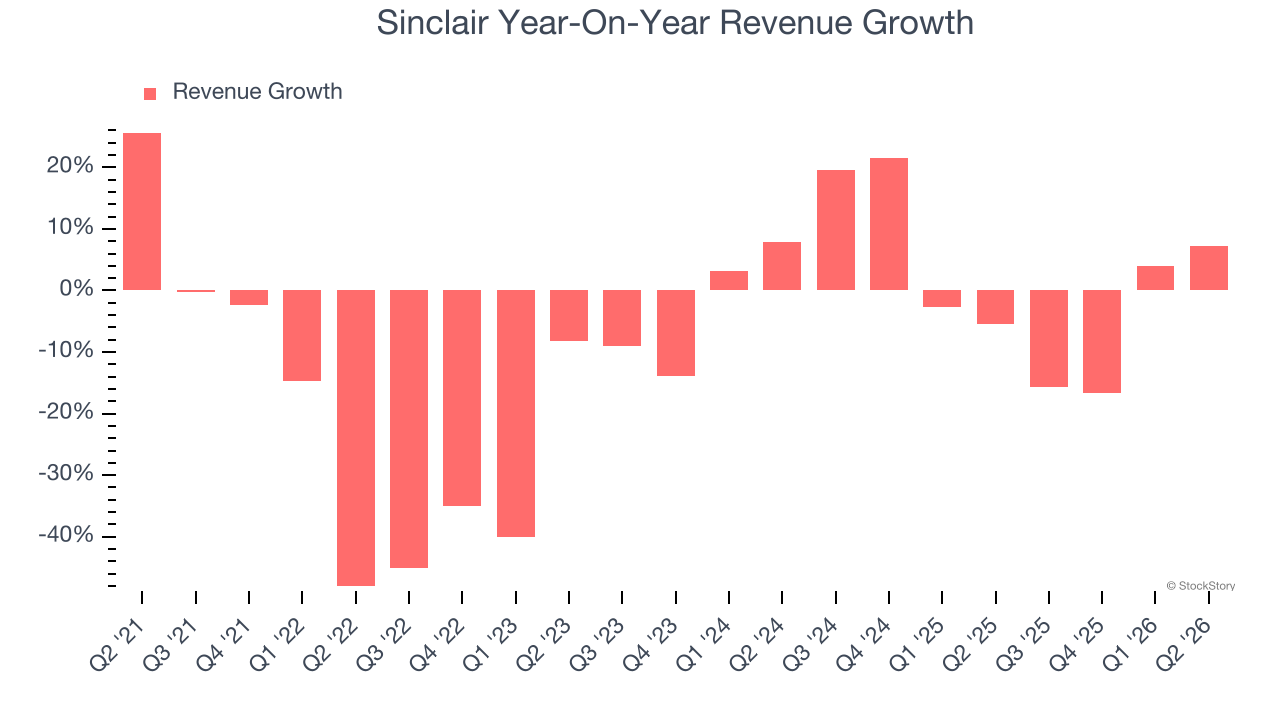
We can dig further into the company’s revenue dynamics by analyzing its most important segments, Distribution and Advertising, which are 36.7% and 52.9% of revenue. Over the last two years, Sinclair’s Distribution revenue (content distribution) averaged 6.6% year-on-year growth while its Advertising revenue (advertising sales) averaged 19.1% growth. 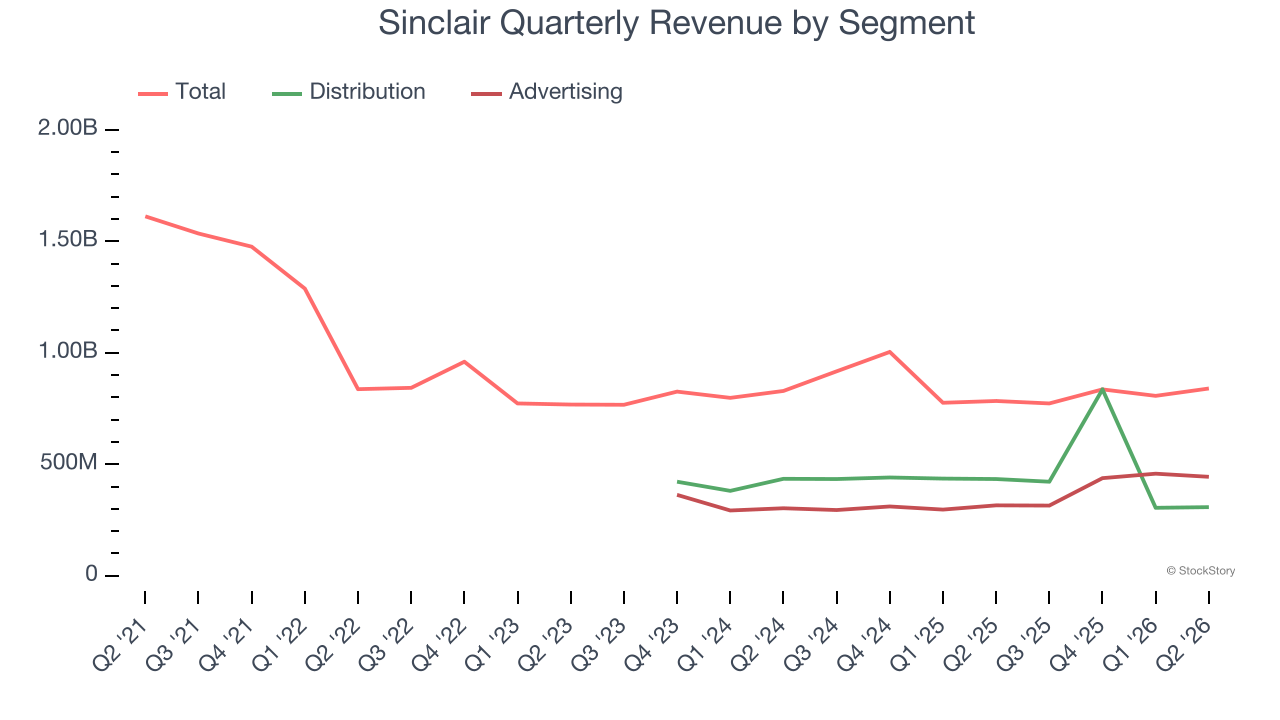
This quarter, Sinclair grew its revenue by 7.1% year on year, and its $840 million of revenue was in line with Wall Street’s estimates.
Looking ahead, sell-side analysts expect revenue to grow 6% over the next 12 months, an improvement versus the last two years. This projection is above the sector average and suggests its newer products and services will catalyze better top-line performance.
ALSO WORTH WATCHING: Nvidia’s Quiet Partner. Nvidia’s chips cost a hundred grand. The connectors that make them work cost even more. One company makes them all.
Every AI server needs specialized infrastructure the chip companies don’t make. High-speed cables. Power connectors. Thermal sensors. This 90-year-old company built a monopoly on it. The AI boom just started. This stock is still flying under the radar. Claim The Stock Ticker Here for FREE.
Adjusted Operating Margin
Sinclair has been a well-oiled machine over the last five years. It demonstrated elite profitability for a business services business, boasting an average adjusted operating margin of 25.5%.
Looking at the trend in its profitability, Sinclair’s adjusted operating margin decreased by 67 percentage points over the last five years. Even though its historical margin was healthy, shareholders will want to see Sinclair become more profitable in the future.
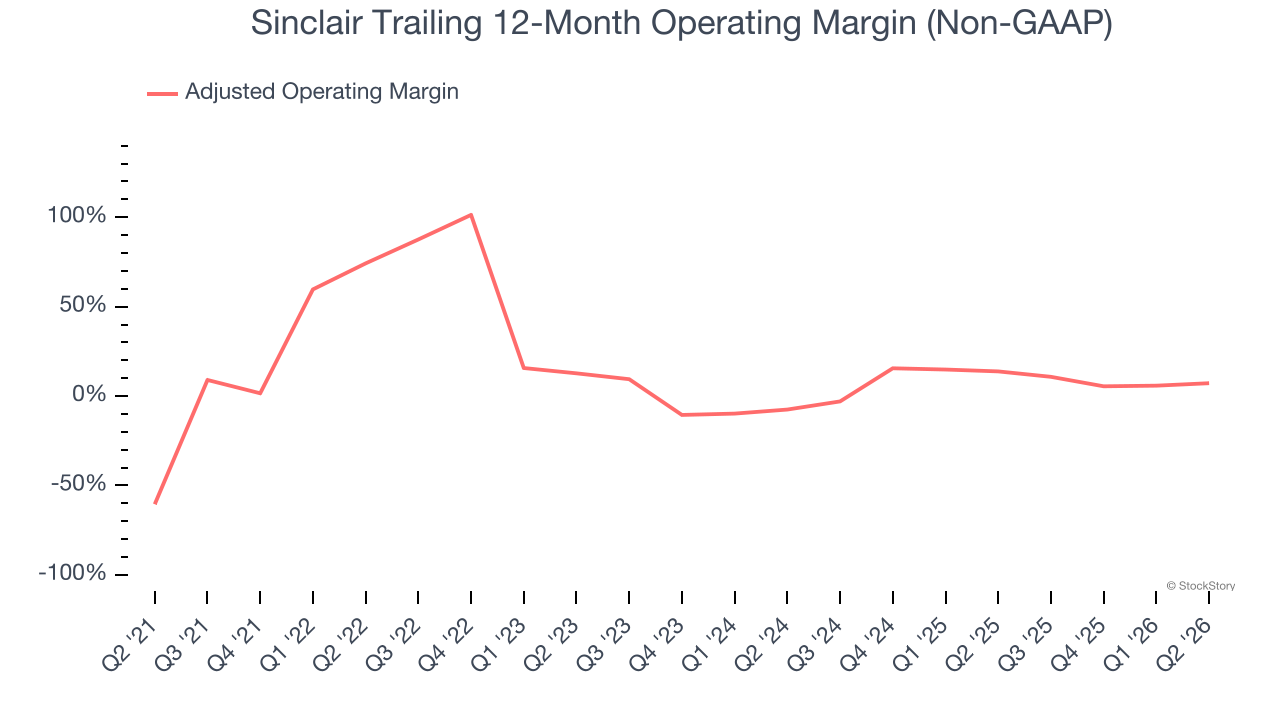
In Q2, Sinclair generated an adjusted operating margin profit margin of 8.2%, up 5.5 percentage points year on year. This increase was a welcome development and shows it was more efficient.
Earnings Per Share
Revenue trends explain a company’s historical growth, but the long-term change in earnings per share (EPS) points to the profitability of that growth — for example, a company could inflate its sales through excessive spending on advertising and promotions.
Sinclair’s full-year EPS flipped from negative to positive over the last five years. This is encouraging and shows it’s at a critical moment in its life.
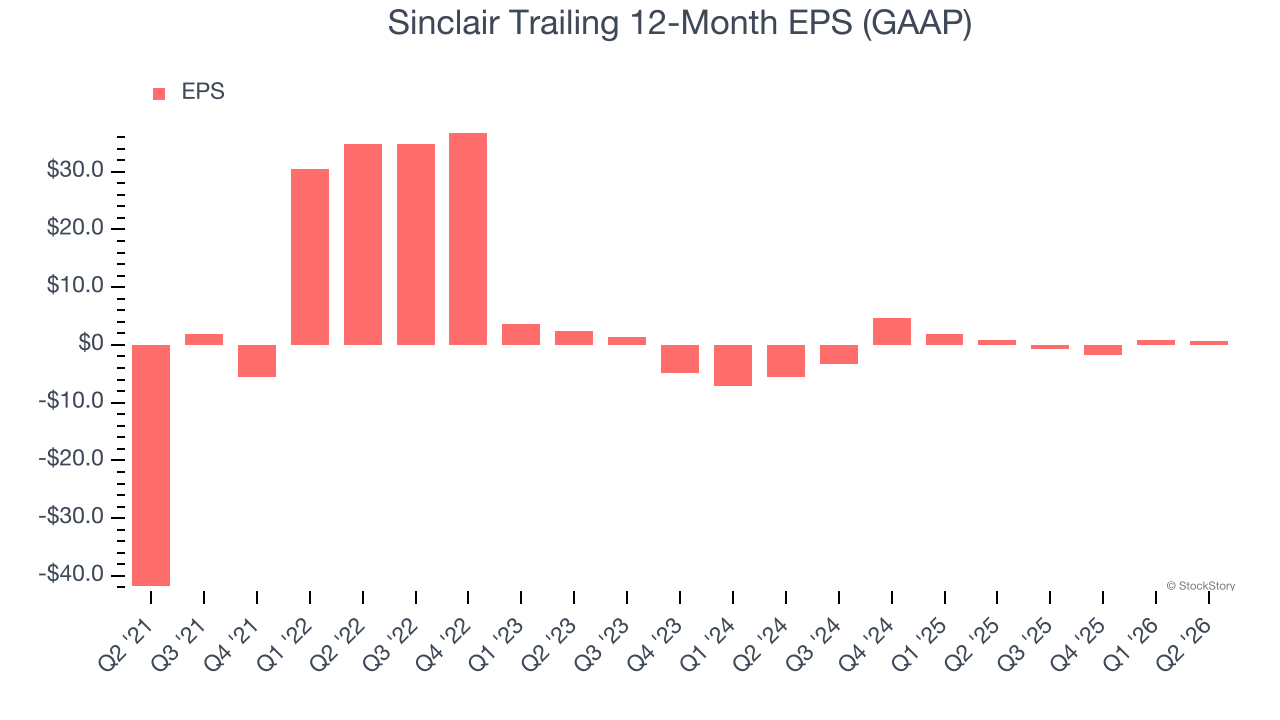
Like with revenue, we analyze EPS over a more recent period because it can provide insight into an emerging theme or development for the business.
For Sinclair, its two-year annual EPS growth of 46.3% was higher than its five-year trend. We love it when earnings growth accelerates, especially when it accelerates off an already high base.
In Q2, Sinclair reported EPS of negative $1.06, down from negative $0.92 in the same quarter last year. This print missed analysts’ estimates, but we care more about long-term EPS growth than short-term movements. Over the next 12 months, Wall Street expects Sinclair’s full-year EPS to shrink by 62.4% from $0.76 to $0.29. This is unusual as its revenue and operating margin are anticipated to increase, signaling the fall likely stems from “below-the-line” items such as taxes.
Key Takeaways from Sinclair’s Q2 Results
We struggled to find many positives in these results. Its EPS missed and its full-year revenue guidance fell slightly short of Wall Street’s estimates. Overall, this quarter could have been better. The stock traded up 3.1% to $14.27 immediately after reporting.
Is Sinclair an attractive investment opportunity right now? We think that the latest quarter is only one piece of the longer-term business quality puzzle. Quality, when combined with valuation, can help determine if the stock is a buy. We cover that in our actionable full research report which you can read here (it’s free).